Deployment metrics
In Astro Private Cloud versions before 1.0, Deployment-level metrics such as CPU usage, memory usage, and network I/O were available by default through built-in node exporter and cAdvisor integrations. These were removed in APC 1.0 to reduce Prometheus data volume and improve performance.
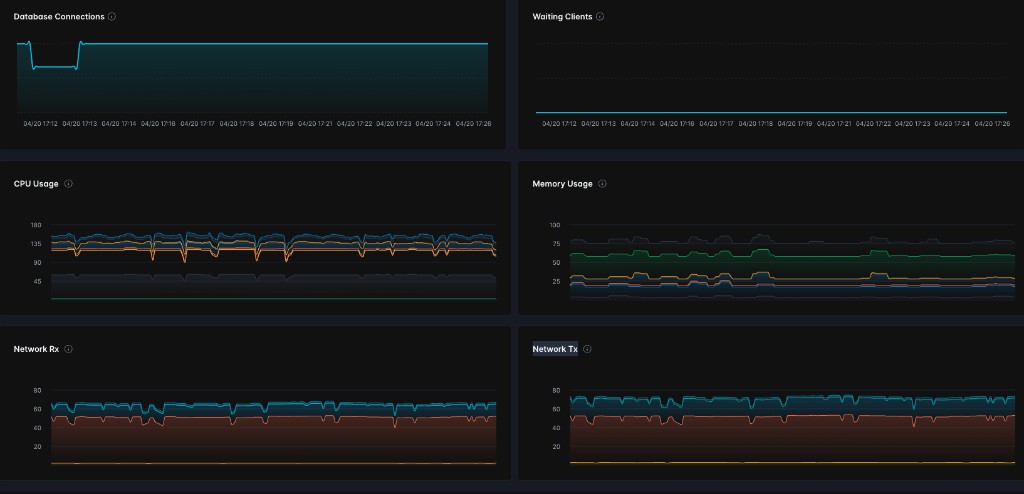
Starting with APC 2.0, you can re-enable these metrics with two Helm flags. After you enable them, four additional panels appear in the Metrics tab for each Deployment in the Astro Private Cloud UI:
- CPU Usage: Percentage of CPU consumed by the Deployment’s containers.
- Memory Usage: Percentage of memory consumed by the Deployment’s containers.
- Network Rx: Inbound network traffic received by the Deployment’s Pods.
- Network Tx: Outbound network traffic transmitted by the Deployment’s Pods.
Both features are disabled by default.
Prerequisites
- Astro Private Cloud 2.0 or later with Helm chart version 2.0.0 or later.
- System Admin access to update the Astro Private Cloud Helm configuration.