Introduction to Apache Airflow® Dags
Introduction to Apache Airflow® Dags
In Apache Airflow®, a Dag is a data pipeline or workflow. Dags are the main organizational unit in Airflow; they contain a collection of tasks and dependencies that you want to execute on a schedule.
Without a Dag, pipeline steps run independently with no awareness of each other. If an extraction step fails, downstream transformations might still run on stale or missing data. Dags solve this by defining explicit dependencies between tasks, so failures halt dependent steps and alert you to the problem.
A Dag is defined in Python code and visualized in the Airflow UI. Dags can be as simple as a single task or as complex as hundreds or thousands of tasks with complicated dependencies.
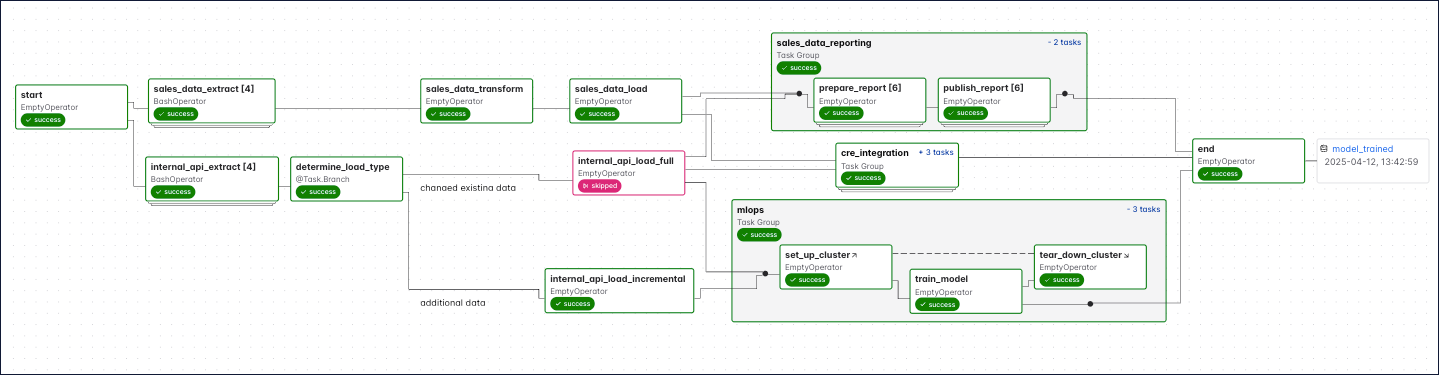
The following screenshot shows a complex Dag run graph in the Airflow UI. After reading this guide, you’ll be able to understand the elements in this graph, as well as know how to define Dags and use Dag parameters.
Assumed knowledge
To get the most out of this guide, you should have an understanding of:
- What Airflow is. See Introduction to Apache Airflow.
What is a Dag?
A Dag (directed acyclic graph) is a mathematical structure consisting of nodes and edges. In Airflow, a Dag represents a data pipeline or workflow with a start and an end.
The term “Dag” was historically written as the acronym “DAG”. The Airflow project now uses “Dag” as a standalone word.
The mathematical properties of Dags make them useful for building data pipelines:
-
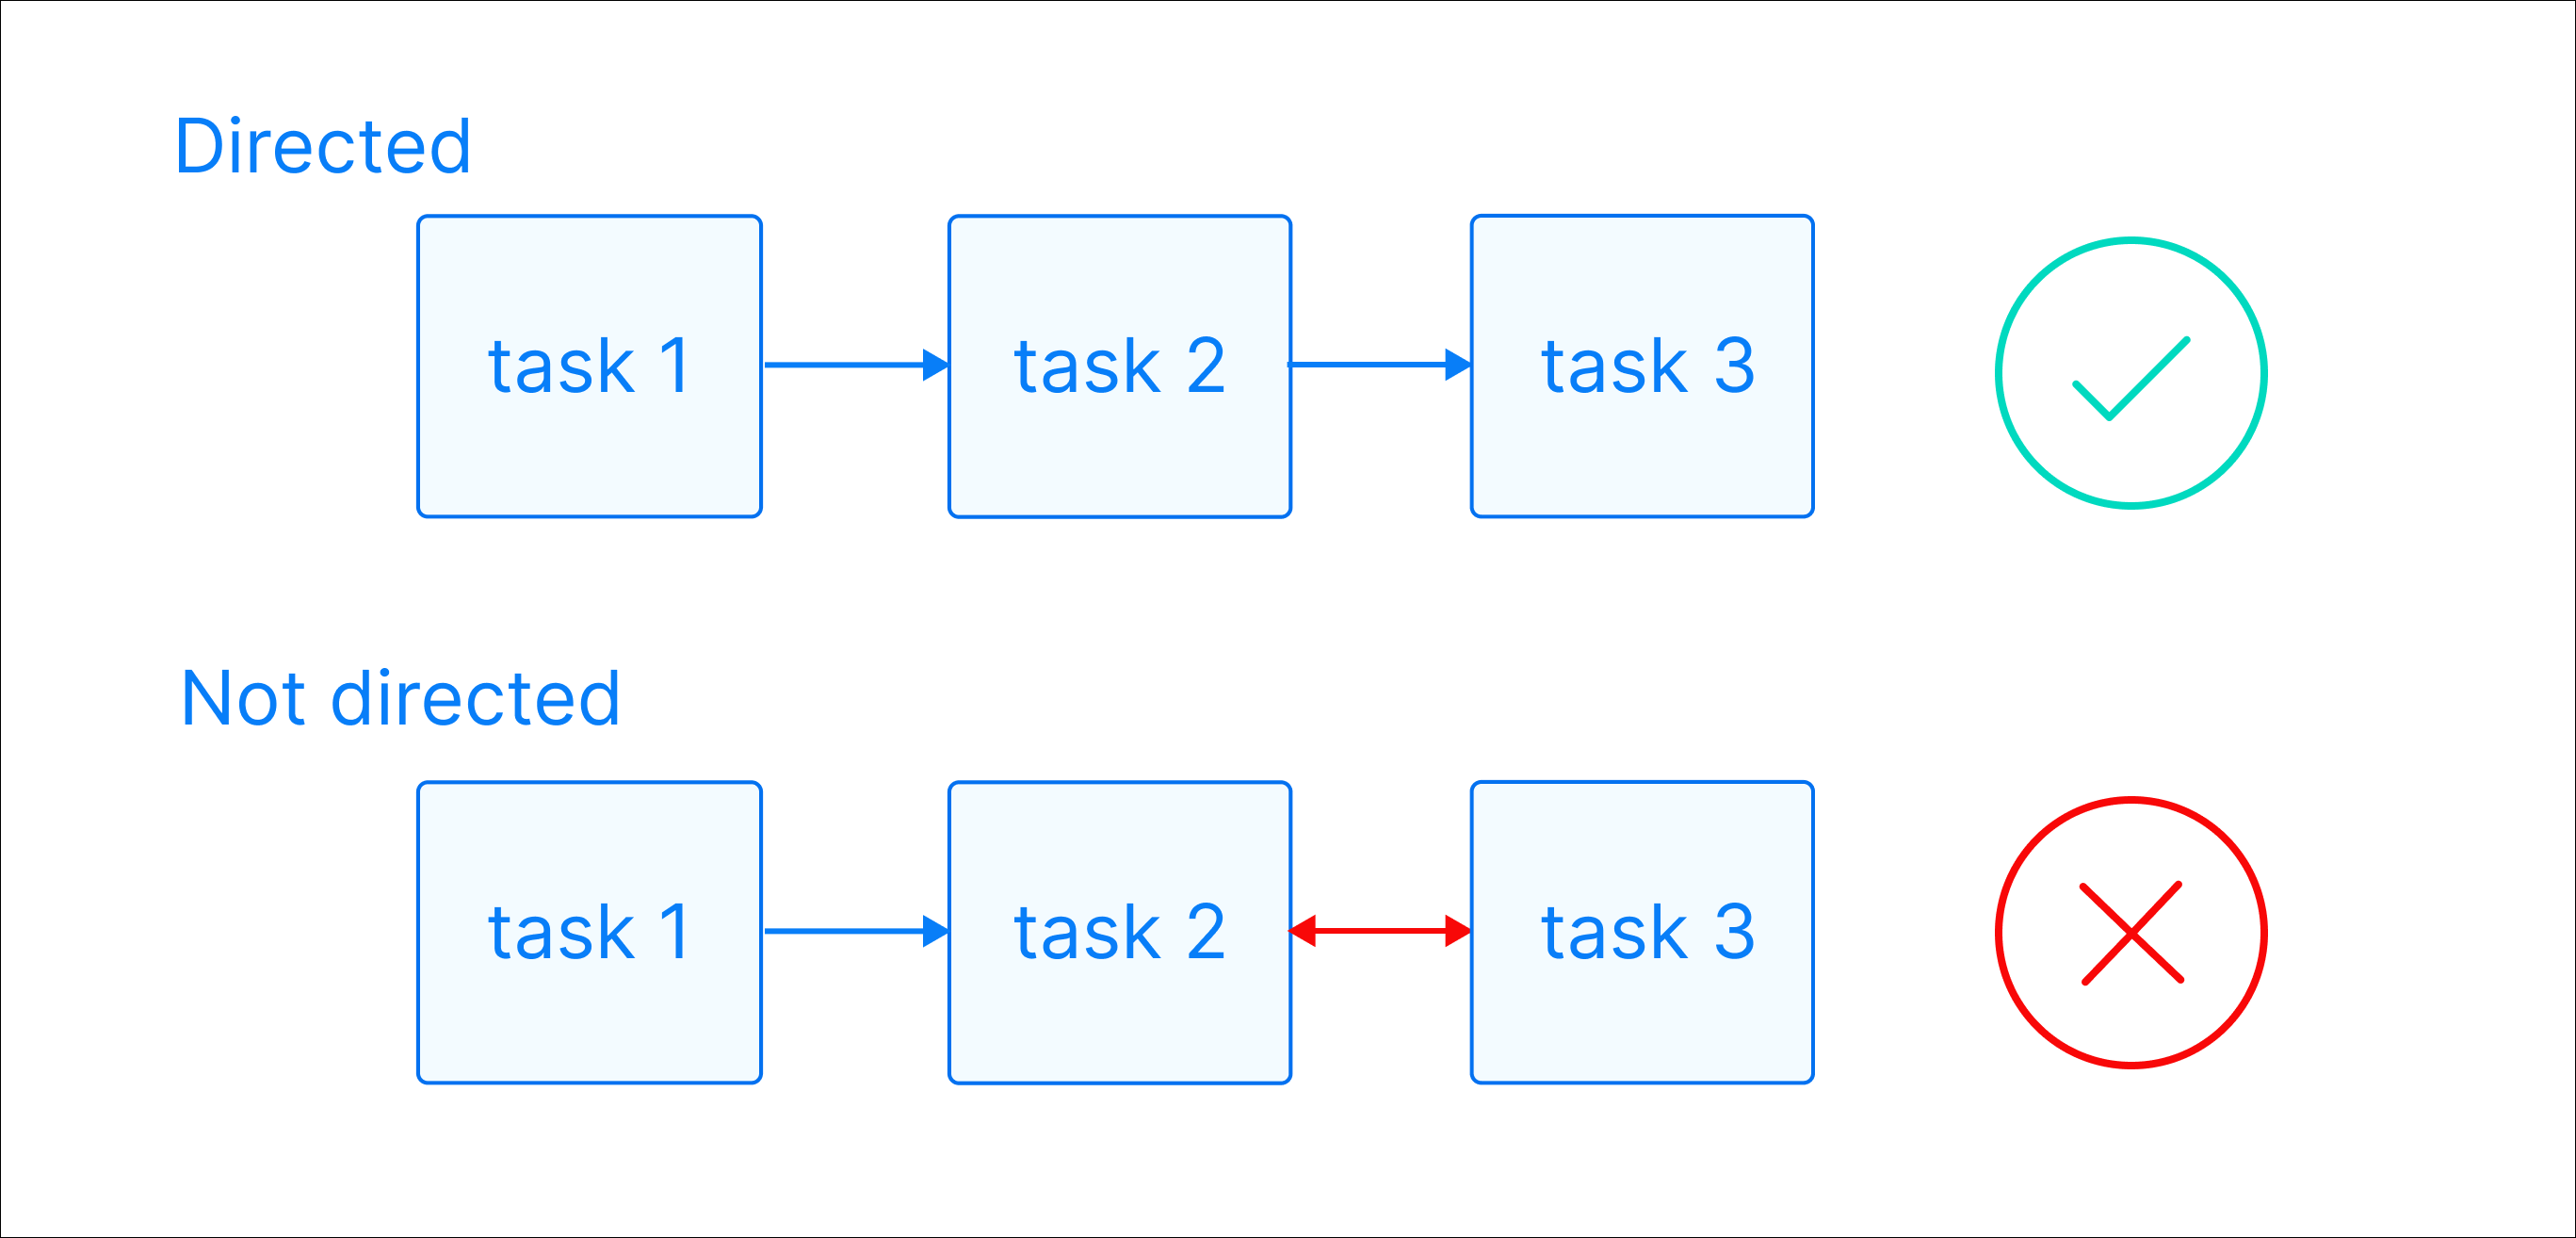
Directed: There is a clear direction of flow between tasks. A task can be either upstream, downstream, or parallel to another task.
-
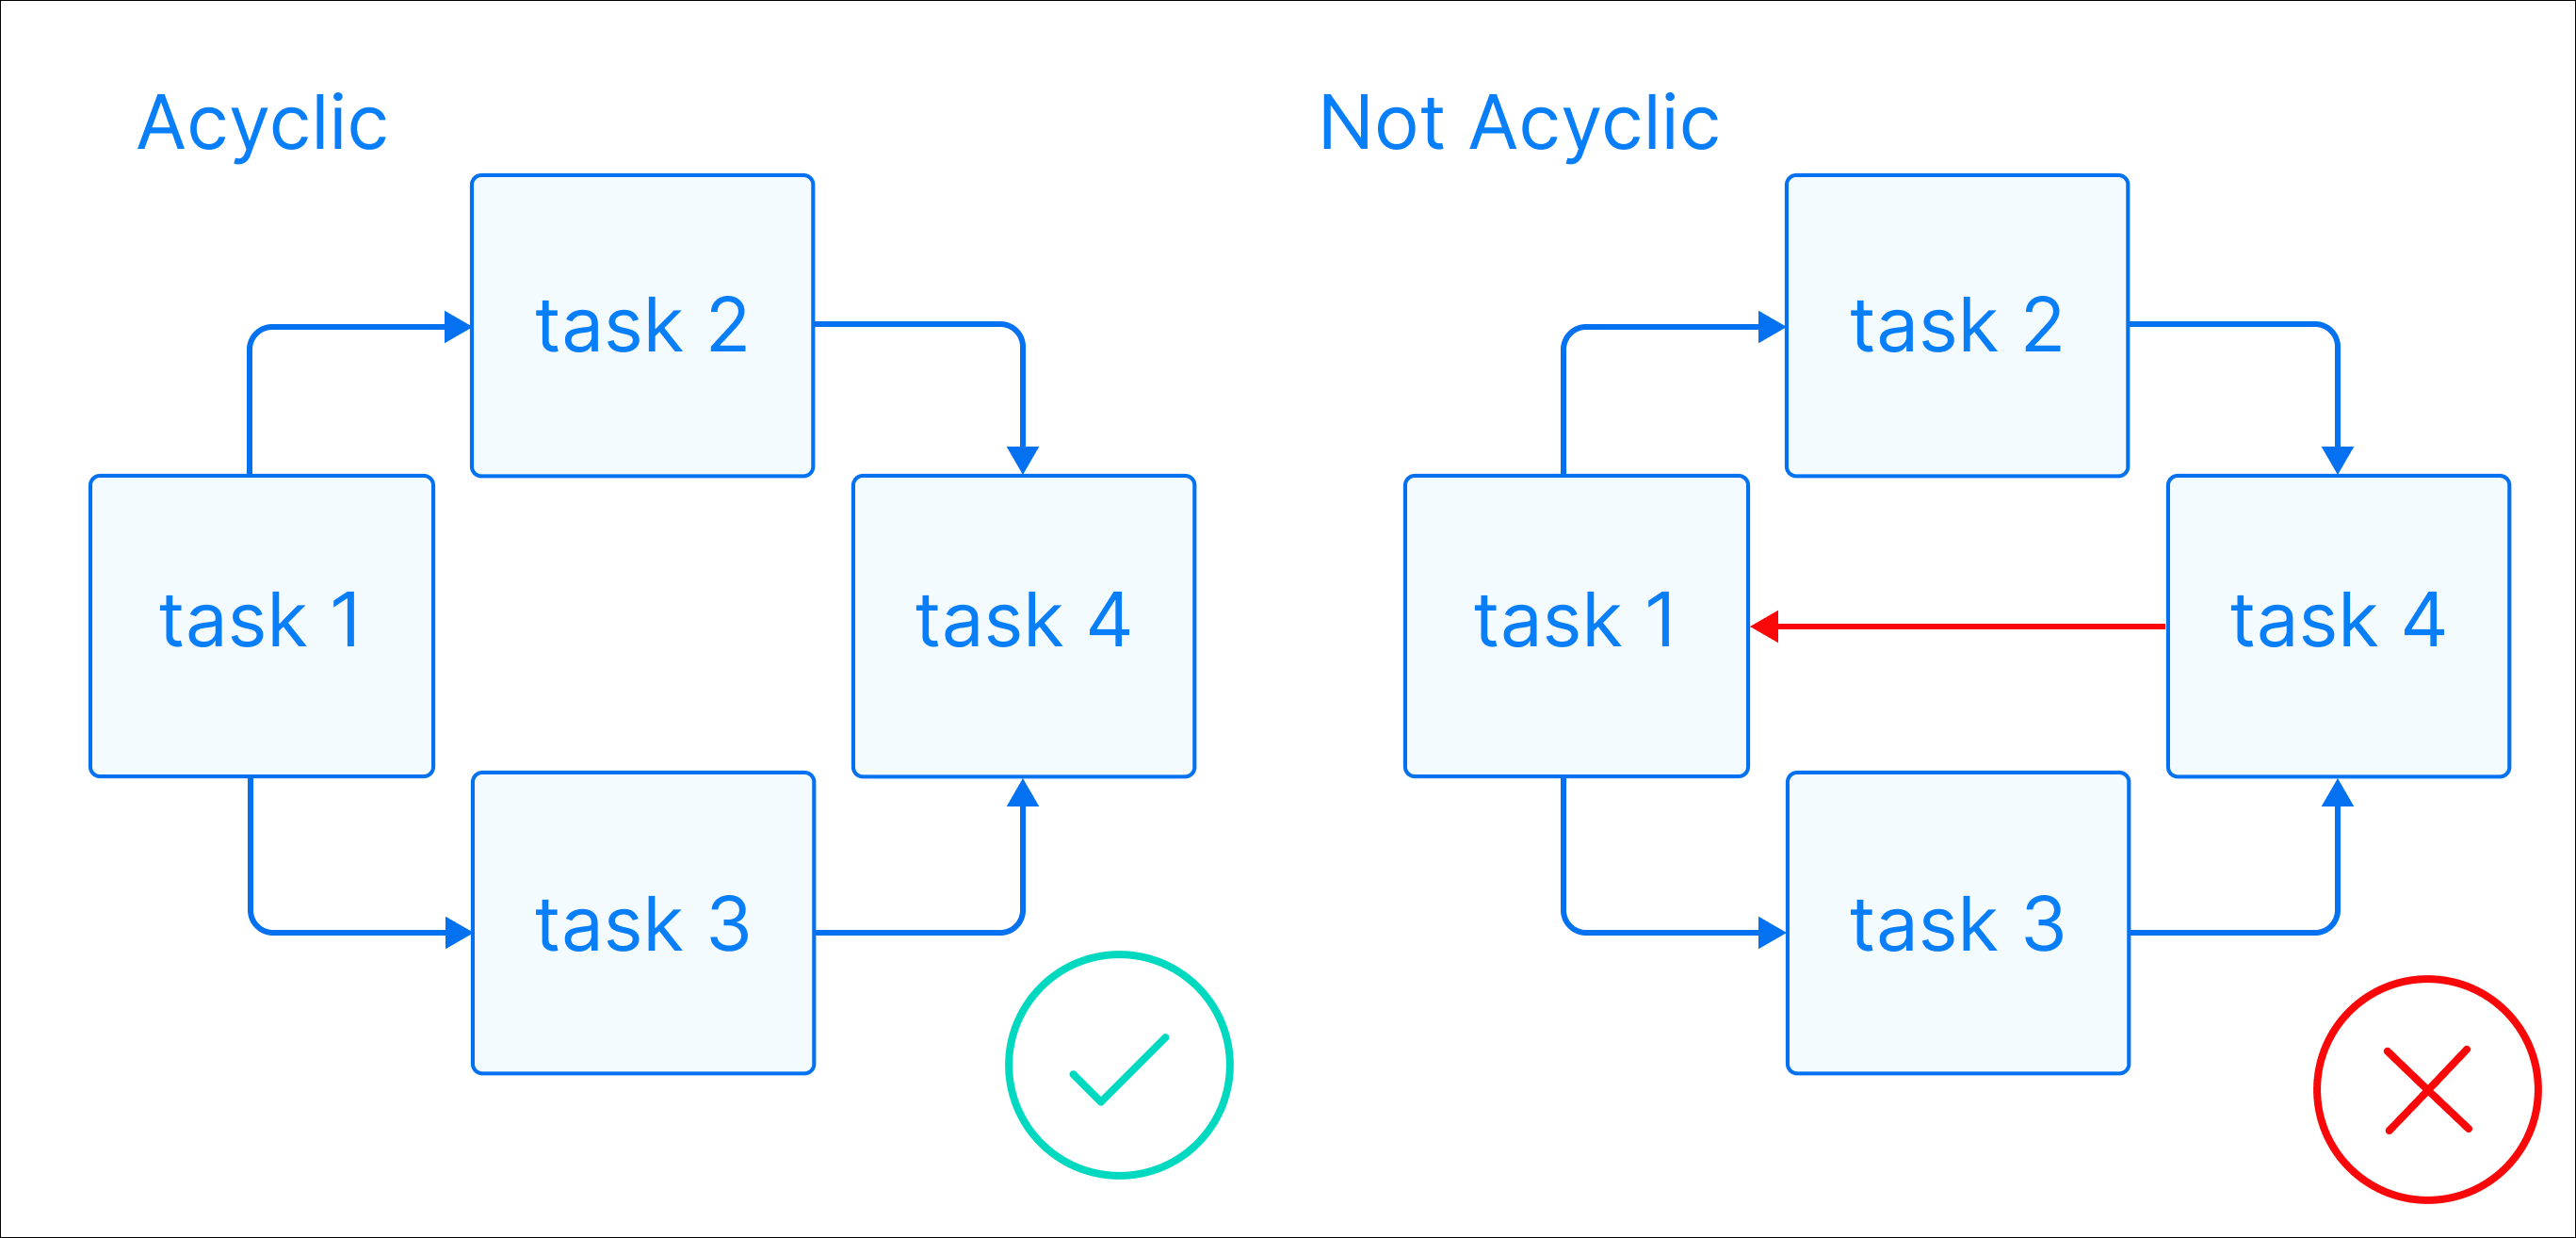
Acyclic: There are no circular dependencies in a Dag. This means that a task can’t depend on itself, nor can it depend on a task that ultimately depends on it.
-
Graph: A Dag is a graph, which is a structure consisting of nodes and edges. In Airflow, nodes are tasks and edges are dependencies between tasks. Defining workflows as graphs helps you visualize the entire workflow in a way that’s easy to navigate and conceptualize.
Beyond these requirements, a Dag can be as simple or as complicated as you need. You can define tasks that run in parallel or sequentially, implement conditional branches, and visually group tasks together in task groups.
For example, a common Dag might extract data from an API, anonymize sensitive fields, check for duplicate records, insert cleaned data into a database, and run a SQL query to update a dashboard. Each of these steps is a task, and the Dag ensures they run in the correct order.
Each task in a Dag should perform one unit of work. Tasks can be anything from a simple Python function to a complex data transformation or a call to an external service. They are defined using Airflow operators or Airflow decorators. The dependencies between tasks can be set in different ways (see Managing Dependencies).
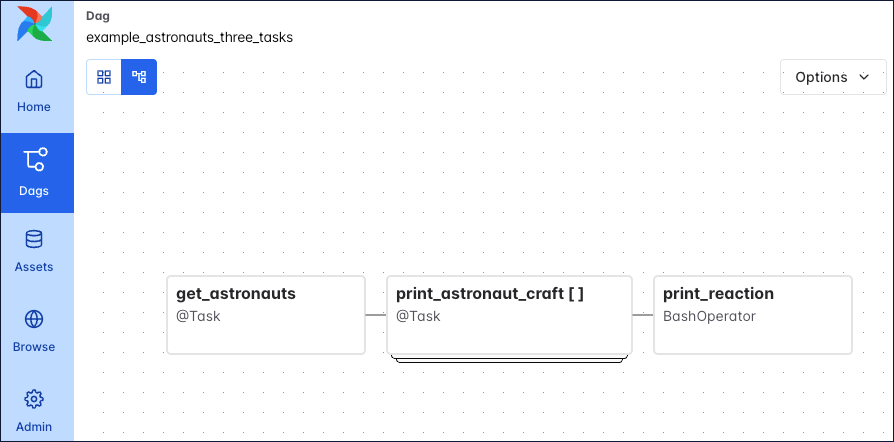
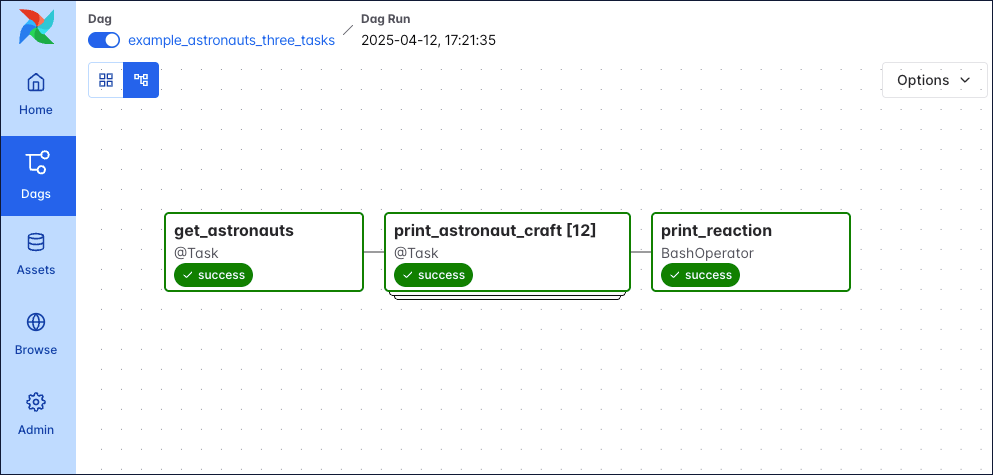
The following screenshot shows a simple Dag graph with 3 sequential tasks.
Click to view the full Dag code used to create the Dag in the screenshot
Why use Dags for data pipelines?
Structuring your data pipelines as Dags provides several advantages over running disconnected scripts or using separate interface-driven tools:
- Reliability: Tasks execute in a guaranteed order every run. If a task fails, dependent downstream tasks don’t execute, preventing data corruption from stale or incomplete data.
- Visibility: The Dag structure gives you a visual map of your entire pipeline in the Airflow UI, making it easier to debug failures and understand data flow at a glance.
- Testability: Because Dags define deterministic execution paths, you can test individual tasks in isolation and validate expected outcomes against known inputs.
What is a Dag run?
A Dag run is an instance of a Dag running at a specific point in time. A task instance is an instance of a task running at a specific point in time. Each Dag run has a unique run_id and contains one or more task instances. The history of previous Dag runs is stored in the Airflow metadata database.
In the Airflow UI, you can view previous runs of a Dag in the Grid view and select individual Dag runs by clicking on their respective duration bar.
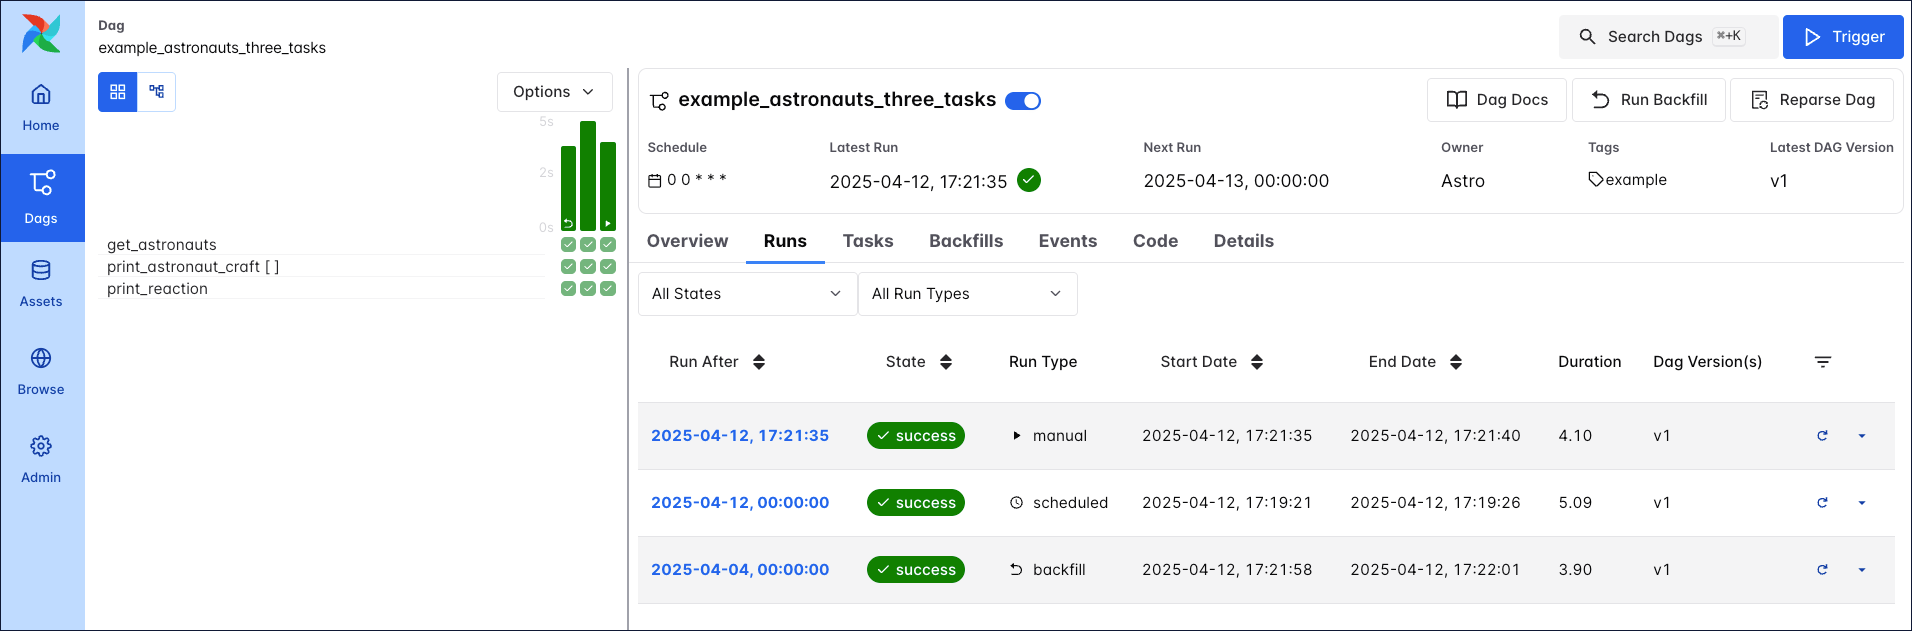
A Dag run graph looks similar to the Dag graph, but includes additional information about the status of each task instance in the Dag run.
Learn more about how to navigate the Airflow UI in the An introduction to the Airflow UI guide.
Each Dag run is associated with a Dag version. Each time you make structural changes to a Dag and create a new Dag run, the Dag version is incremented. This allows you to track changes to the Dag over time and better understand previous Dag runs. For more information on Dag versions, see Dag Versioning and Dag Bundles.
Dag run properties
A Dag run graph in the Airflow UI contains information about the Dag run, as well as the status of each task instance in the Dag run. The following screenshot shows the same Dag as in the previous section, but with annotations explaining the different elements of the graph.
![Screenshot of the Airflow UI. A Dag run with 3 tasks is shown. The annotations show the location of the dag_id and logical date (top of the screenshot), the task_id, task state and operator/decorator used in the nodes of the graph, as well as the number of dynamically mapped task instances in [] behind the task id and the Dag dependency layout to the right of the screen.](https://files.buildwithfern.com/astronomer.docs.buildwithfern.com/06356cbfa0ea2ec3316585eb846f72e9b061e1072eab32500dc964e434180fb1/docs/assets/img/guides/3-0-dags_simple_dag_run_graph_annotated.png)
dag_id: The unique identifier of the Dag.logical date: The point in time after which this particular Dag run can run. This date and time isn’t necessarily the same as the actual moment the Dag run is executed. See Scheduling for more information.task_id: The unique identifier of the task.task state: The status of the task instance in the Dag run. Possible states arerunning,success,failed,skipped,restarting,up_for_retry,upstream_failed,queued,scheduled,none,removed,deferred, andup_for_reschedule, they each cause the border of the node to be colored differently. See the OSS documentation on task instances for an explanation of each state.
There are four ways you can trigger a Dag run:
- Backfill: Backfilling is a mechanism by which you can create several Dag runs for dates in the past using the Airflow UI, API or CLI. Backfilled Dag runs include a curved arrow on their Dag run duration bar.
- Scheduled: Dag runs created based on a Dag’s schedule (for example
@daily,@hourly) are created by the Airflow scheduler. The Dag run duration bar doesn’t have an additional icon. - Manual: You can trigger manual runs of a Dag in the Airflow UI, or by using the Airflow CLI or API. Manually triggered Dag runs include a play icon on the Dag run duration bar.
- Asset triggered: Dags can be scheduled using data-aware scheduling. This means a Dag runs as soon as one or more Airflow assets are updated. These updates can come from tasks inside of the same Airflow instance, a call to the Airflow REST API, be made manually using the Airflow UI, or triggered based on messages in a message queue. The Dag run duration bar includes an asset icon.
A Dag run can have the following statuses:
- Queued: The time after which the Dag run can be created has passed but the scheduler hasn’t created task instances for it yet.
- Running: The Dag run is eligible to have task instances scheduled.
- Success: All task instances are in a terminal state (
success,skipped,failedorupstream_failed) and all leaf tasks (tasks with no downstream tasks) are either in the statesuccessorskipped. The duration bar of a successful Dag run is green. - Failed: All task instances are in a terminal state and at least one leaf task is in the state
failedorupstream_failed. The duration bar of a failed Dag run is red.
Complex Dag runs
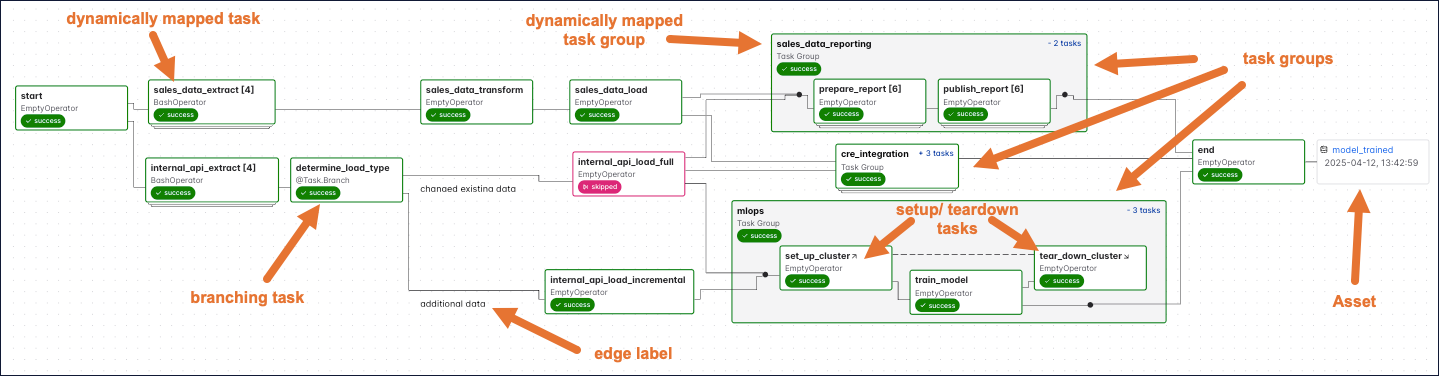
When you start writing more complex Dags, you will see additional Airflow features that are visualized in the Dag run graph. The following screenshot shows the same complex Dag as in the overview but with annotations explaining the different elements of the graph. Don’t worry if you don’t know about all these features yet. You will learn about them as you become more familiar with Airflow.
Click to view the full Dag code used for the screenshot
The following code creates the same DAG structure as shown in the previous screenshot.
Some more complex features visible in this Dag graph are:
- Dynamically mapped tasks: A dynamically mapped task is created dynamically at runtime based on user-defined input. The number of dynamically mapped task instances is shown in brackets (
[]) behind the task ID. - Branching tasks: A branching task creates a conditional branch in the Dag. See Branching in Airflow for more information.
- Edge labels: Edge labels appear on the edge between two tasks. These labels are often helpful to annotate branch decisions in a Dag graph.
- Task groups: A task group is a tool to logically and visually group tasks in an Airflow Dag. See Airflow task groups for more information.
- Setup/teardown tasks: When using Airflow to manage infrastructure, it can be helpful to define tasks as setup and teardown tasks to take advantage of additional intelligent dependency behavior. Setup and teardown tasks appear with diagonal arrows next to their task IDs and are connected with a dotted line. See Use setup and teardown tasks in Airflow for more information.
- Assets: Assets are shown in the Dag graph. If a Dag is scheduled on an asset, it is shown upstream of the first task of the Dag. If a task in the Dag updates an asset, it is shown after the respective task as in the previous screenshot. See Airflow assets for more information.
You can learn more about how to set complex dependencies between tasks and task groups in the Managing Dependencies guide.
Write a Dag
A Dag can be defined with a Python file placed in an Airflow project’s Dag bundle. When using the Astro CLI with default settings this is your dags folder. Airflow automatically parses all files in this folder every 5 minutes to check for new Dags, and it parses existing Dags for code changes every 30 seconds. You can force a new Dag parse using airflow dags reserialize, or astro dev run dags reserialize using the Astro CLI.
There are two types of syntax you can use to structure your Dag:
- TaskFlow API: The TaskFlow API contains the
@dagdecorator. A function decorated with@dagdefines a Dag. Note that you need to call the function at the end of the script for Airflow to register the Dag. All tasks are defined within the context of the Dag function. - Traditional syntax: You can create a Dag by instantiating a Dag context using the
DAGclass and defining tasks within that context.
TaskFlow API and traditional syntax can be freely mixed. See Mixing TaskFlow decorators with traditional operators for more information. Additionally, it is also possible to create one-task Dags with the @asset decorator, for more information see Airflow assets.
The following is an example of the same Dag written using each type of syntax.
TaskFlow
Traditional
Astronomer recommends creating one Python file for each Dag and naming it after the dag_id as a best practice for organizing your Airflow project. For certain advanced use cases it may be appropriate to dynamically generate Dags using Python code, see Dynamically generate Dags in Airflow for more information.
Dag-level parameters
In Airflow, you can configure when and how your Dag runs by setting parameters in the Dag object. Dag-level parameters affect how the entire Dag behaves, as opposed to task-level parameters which only affect a single task.
The Dags in the previous section have the following basic parameters defined:
dag_id: The name of the Dag. This must be unique for each Dag in the Airflow environment. When using the@dagdecorator and not providing thedag_idparameter name, the function name is used as thedag_id.start_date: The date and time after which the Dag starts being scheduled. Defaults toNone.schedule: The schedule for the Dag. There are many different ways to define a schedule, see Scheduling in Airflow for more information. Defaults toNone.
There are many more Dag-level parameters that let you configure anything from resource usage to the Dag’s appearance in the Airflow UI. See Dag-level parameters for a complete list.
FAQ
What does Dag stand for?
Dag stands for “directed acyclic graph,” a mathematical term for a graph with directed edges and no cycles. The Airflow project historically wrote this as the acronym “DAG” but now treats “Dag” as a standalone term.
What is a Dag used for?
In Airflow, a Dag defines a data workflow as a series of tasks with explicit dependencies. This gives you control over task ordering, visibility into pipeline execution through the Airflow UI, and automatic handling of failures across dependent tasks.
Can a Dag have parallel tasks?
Yes. Tasks without dependencies between them run in parallel, assuming your Airflow instance is set up to support parallel tasks. Only tasks with explicit upstream or downstream relationships run sequentially. You control parallelism by how you define task dependencies.
See also
- Get started with Apache Airflow tutorial for a hands-on introduction to writing your first simple Dag.
- Airflow operators and Introduction to the TaskFlow API and Airflow decorators for more information on how to define tasks in a Dag.