An introduction to the Airflow UI
The Apache Airflow user interface (UI) is the web-based hub for monitoring, managing, and troubleshooting your data pipelines served by the API server. With a significant redesign in Airflow 3 focused on improving the developer experience, the UI is now React-based and comes with a more intuitive plugin interface to add custom functionality.
The UI not only provides deep insights into your Dags and Dag runs but also allows you to manage core Airflow elements like variables, connections, and pools. You can interact directly with your pipelines, for example, to run your Dags, backfill them, clear task instances, or generate asset events. The UI is also where you can view previous versions of your Dags.
This guide provides an overview of the most useful features and visualizations in the Airflow UI. To follow along with the examples, you can get a local Airflow environment running in minutes using the Astro CLI.
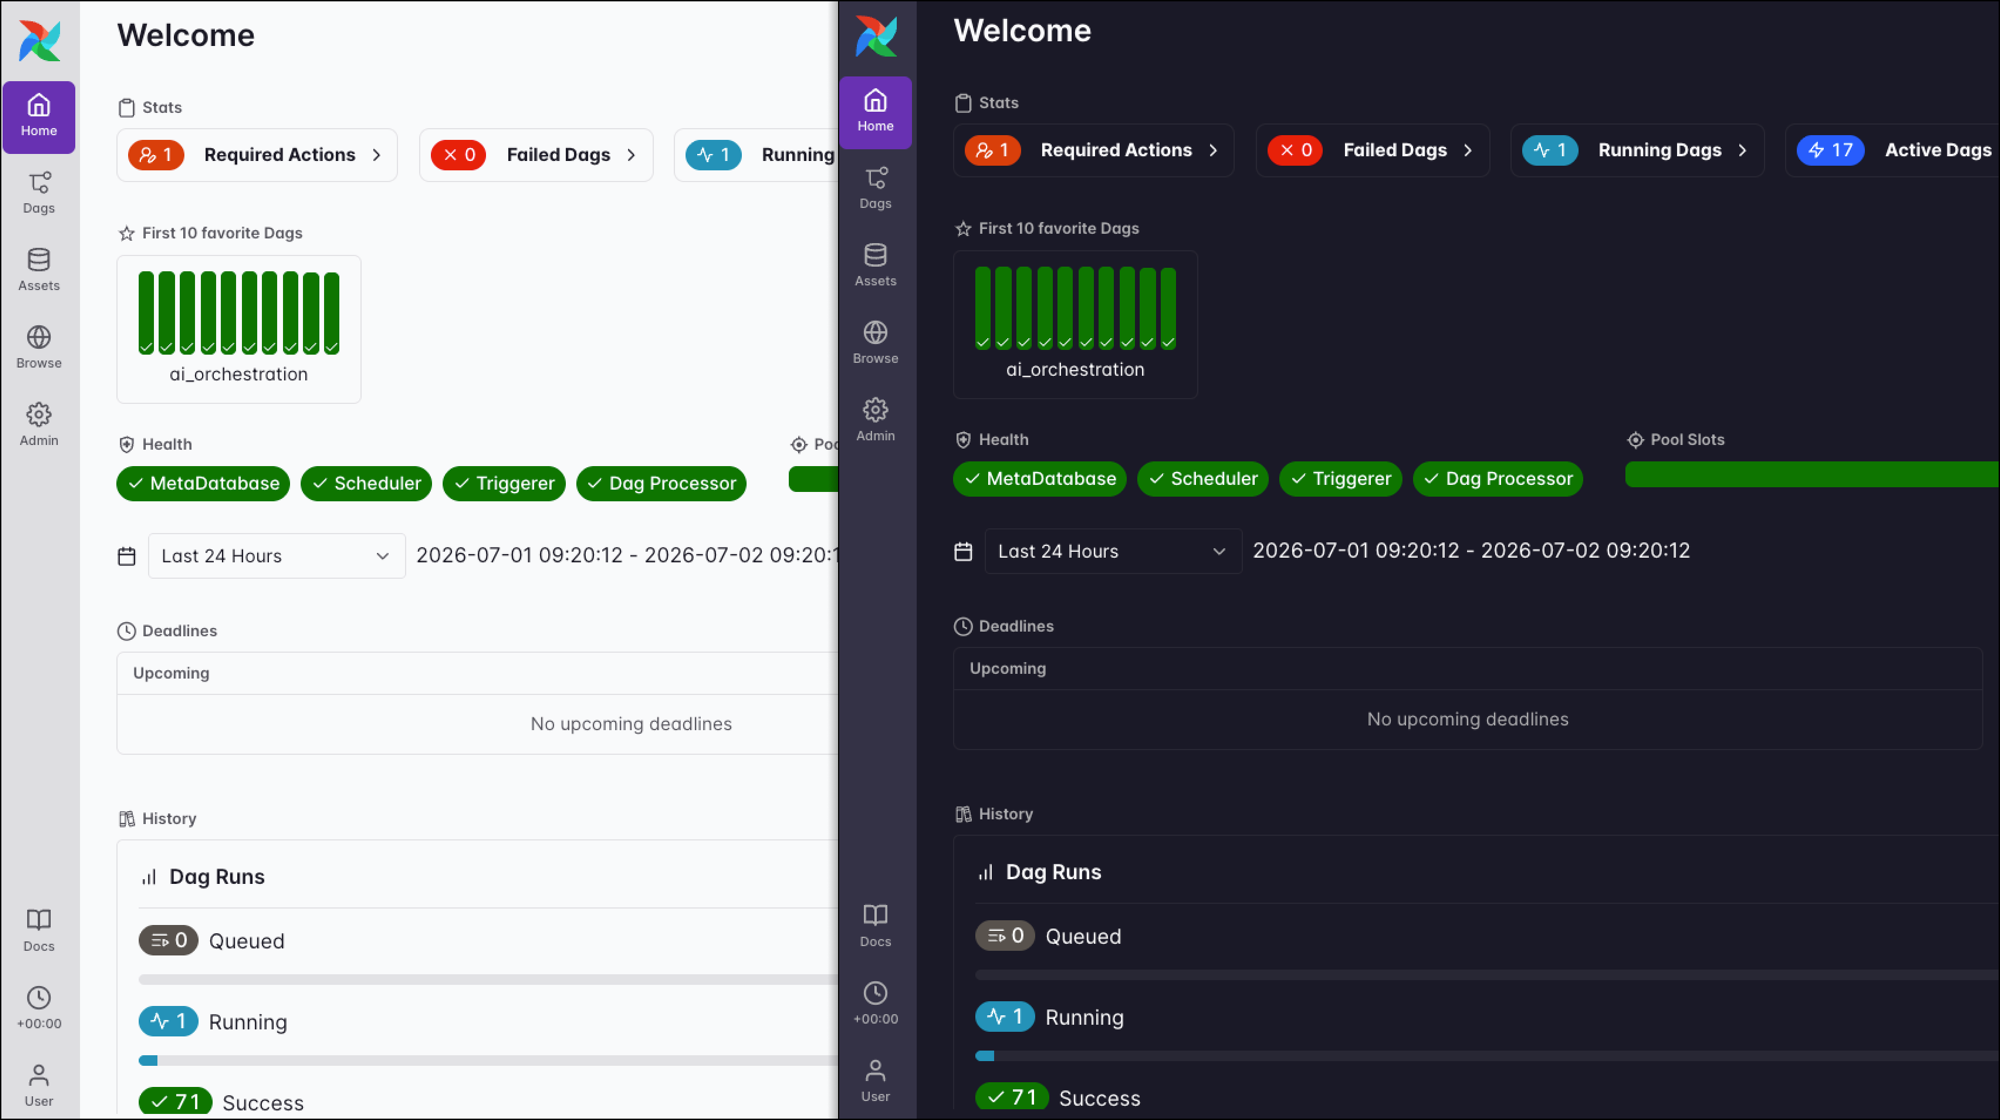
You can customize and extend the Airflow UI by using Airflow plugins. In Airflow 3.2+ you can change the colors and CSS styling of the UI with the AIRFLOW__API__THEME configuration.
Assumed knowledge
To get the most out of this guide, you should have an understanding of:
- Basic Airflow concepts. See Introduction to Apache Airflow.
- Airflow Dags. See Introduction to Airflow Dags.
Importance
While you can write, schedule, and run Dags without ever touching the Airflow UI, it is an indispensable tool for Dag development, monitoring, and operations. The UI serves as the primary window into your Airflow environment, providing the visibility and control necessary to manage complex data workflows effectively.
The Airflow UI is the core feature for the following scenarios:
Get a real-time status overview of your Dags and tasks. Use the grid, graph, and Gantt views to find performance bottlenecks and access task logs to troubleshoot failures. When using assets to schedule your Dags, the Airflow UI also visualizes data-driven dependencies between assets and tasks.
Perform daily operations like pausing Dags, clearing tasks, backfilling, or managing Airflow connections. The UI makes pipeline management accessible to less technical data practitioners.
Visually confirm your Dag’s structure and dependencies as you build. Inspect rendered templates and XComs to debug issues, speeding up the development process.
For a video-based introduction to the Airflow UI, see the Airflow: UI module in the Astronomer Academy.
Views
The Airflow UI is organized into several main views, accessible from the navigation bar. These views provide dedicated spaces for monitoring Dags and Dag runs, observing assets, browsing Airflow objects, and managing your environment.
While the UI is designed to be intuitive, many views contain powerful features that you may not know about. The following sections provide a walkthrough of each primary view and highlight specific features and advanced concepts to help you get the most out of the Airflow UI.
The most important views are:
- Home/Dashboard: A page to give you an overview of your Airflow instance and quick links to different views.
- Dags: A list of all Dags in your instance. From here you can access individual Dags and explore their tasks and runs.
- Assets: A list of all assets in your instance. From here you can access asset graphs that show data-driven dependencies between assets and Dags.
- Browse: Access to lists of audit logs, XComs, deadlines, and required actions for human-in-the-loop operators.
- Admin: Management access to elements such as Airflow connections, variables, or pools.
Home/Dashboard
The Home view is your landing page in Airflow and serves as a high-level dashboard for the entire environment. It provides a great overview of your pipelines’ status and system health, allowing you to assess the state of your Airflow instance at a glance.
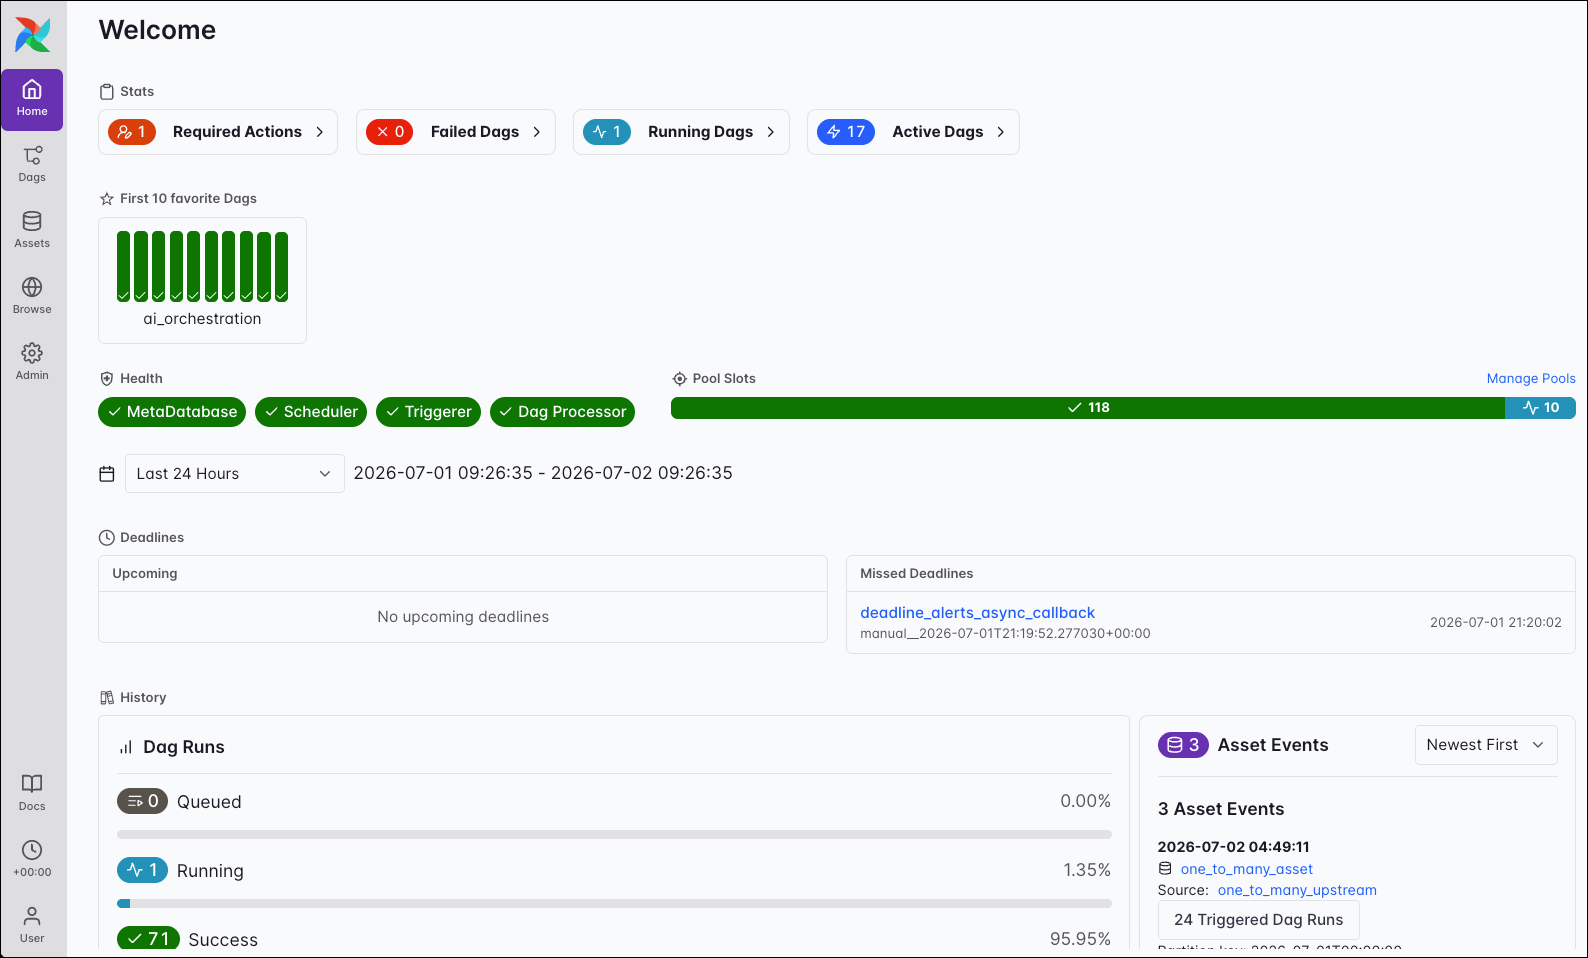
The Home view is composed of several key widgets:
- Stats: A quick summary of your environment’s workload, with counts of active Dags and running or failed task instances. Each statistic is a clickable link, taking you to the pre-filtered Dags view.
- Favorites: A list of your favorite Dags. You can add a Dag to your favorites by clicking the star icon next to its name in the Dags view or within the individual Dag view.
- Health: See the overall health of your Airflow components.
- Pool Slots: Shows the accumulated number of slots of all configured pools and their utilization.
- History: See summary statistics of recent Dag runs and task instances at a glance.
- Asset Events: Shows a list of newest or oldest asset events.
Dags
The Dags view is your central control panel for all data pipelines in your Airflow environment. It allows you to quickly assess the status of your Dags, monitor their recent performance, and perform key operational actions.
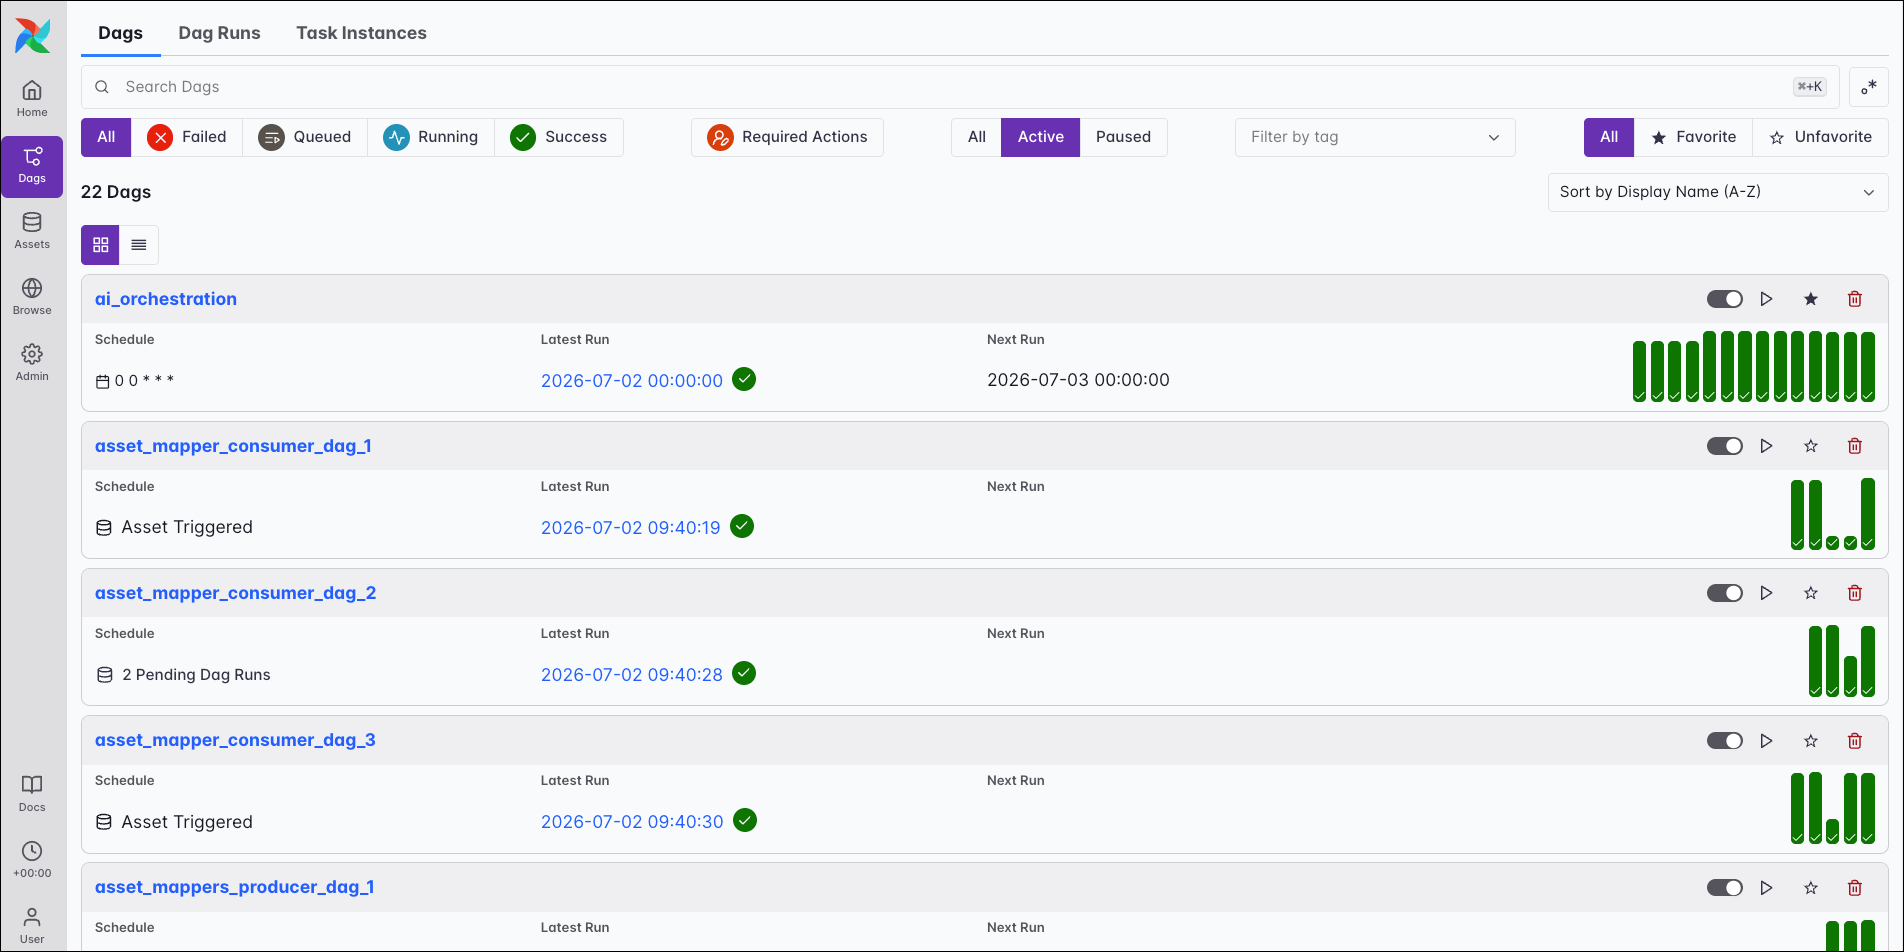
This view provides a searchable and filterable list of all your Dags. It shows you an overview of key metadata, including:
- Schedule: Whether a Dag runs on a cron expression, a timetable, or if it’s triggered by updates to specific assets.
- Next Run: When the Dag is scheduled to run next.
- Latest Run: The status and date of the most recent Dag run.
- Tags: Any tags applied to the Dag, which can be used for filtering and organization.
- Actions: Quick access to pause or unpause a Dag, trigger a Dag run, star a Dag as a favorite to display it in the Home view, or delete it.
The card view also includes a visual history of recent Dag runs as a series of vertical bars. The height of each bar corresponds to the run’s duration, while its color indicates the Dag’s state, allowing you to spot anomalies quickly.
For a more condensed list of Dags, you can switch to the list view, which presents the information in a compact table ideal for environments with many Dags. You can toggle between the views directly below the total number of Dags.
Use the keyboard shortcut ⌘+K (or Ctrl+K on Windows/Linux) to jump to the advanced search bar. This allows you to filter and navigate through hundreds of Dags instantly without waiting for page reloads.
Individual Dag
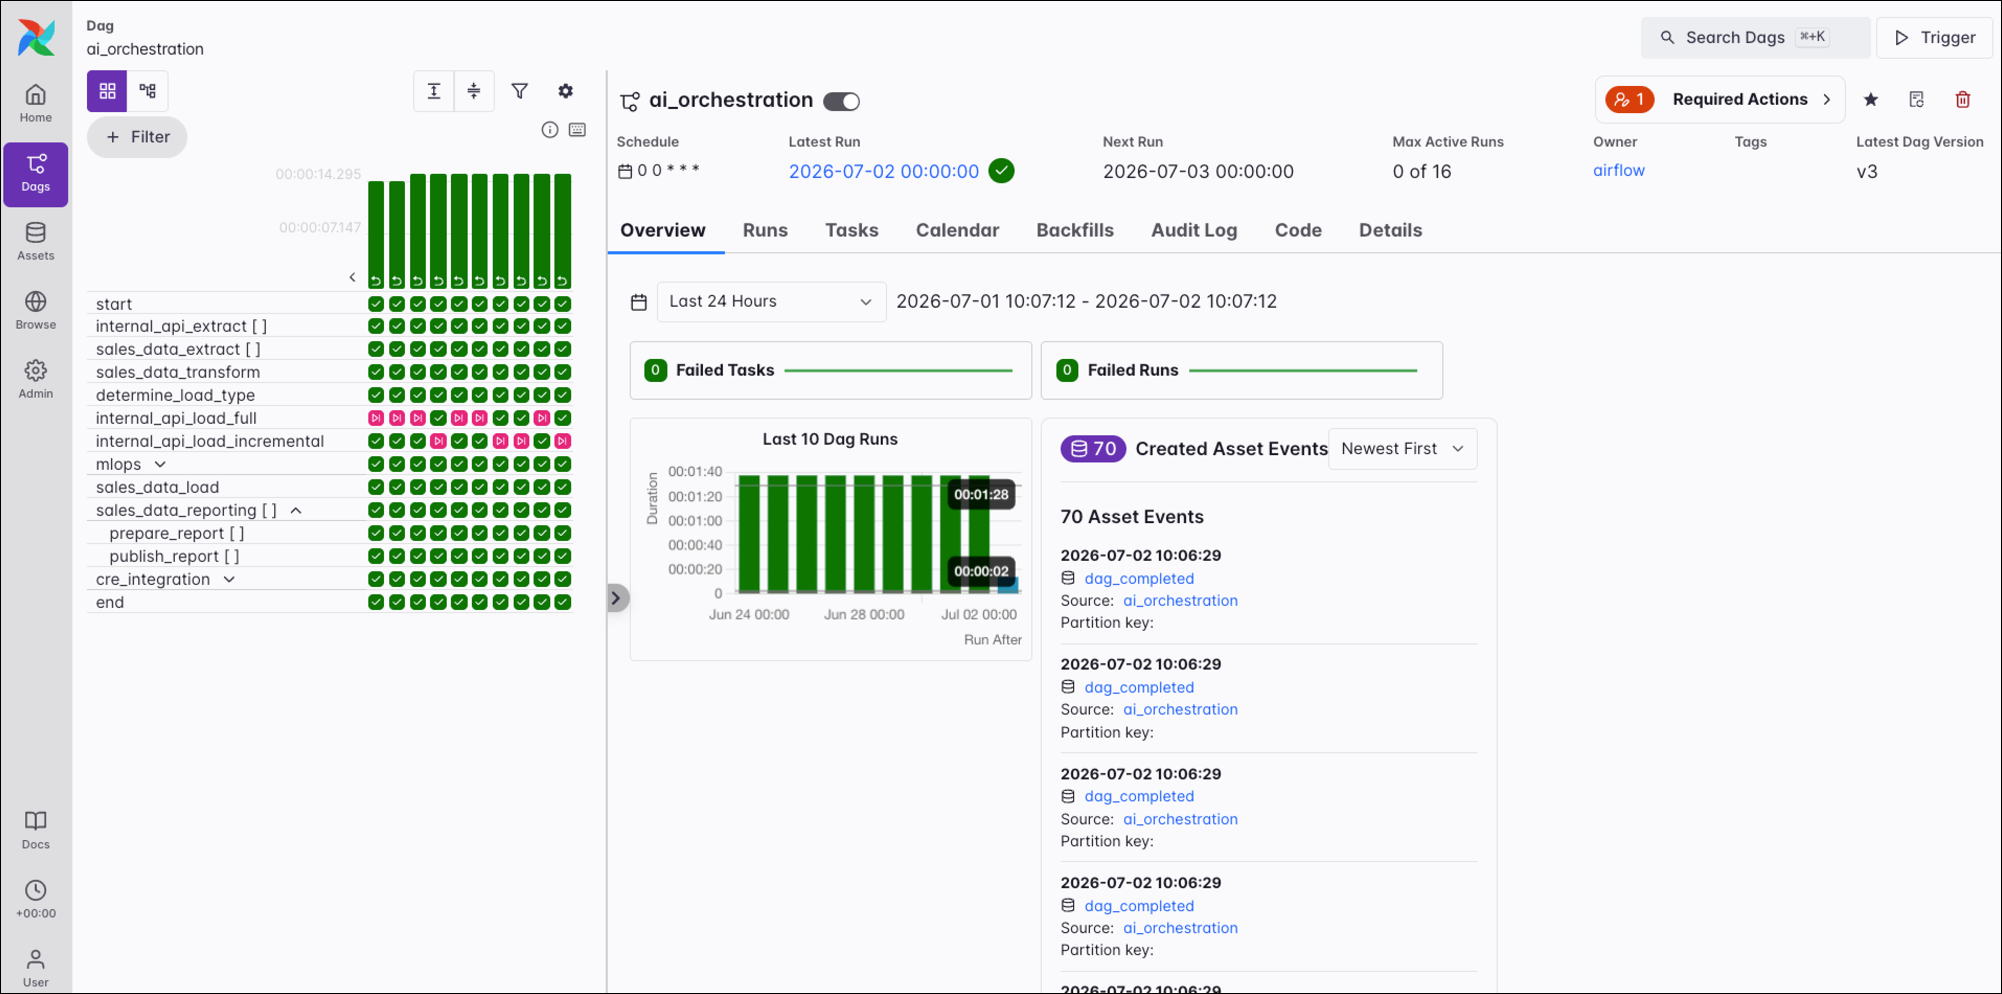
The individual Dag view gives you detailed insights into a specific Dag, including its Dag runs, task instances, and required actions (when using the human-in-the-loop feature). You can also trigger a backfill, or reparse the Dag.
Actions
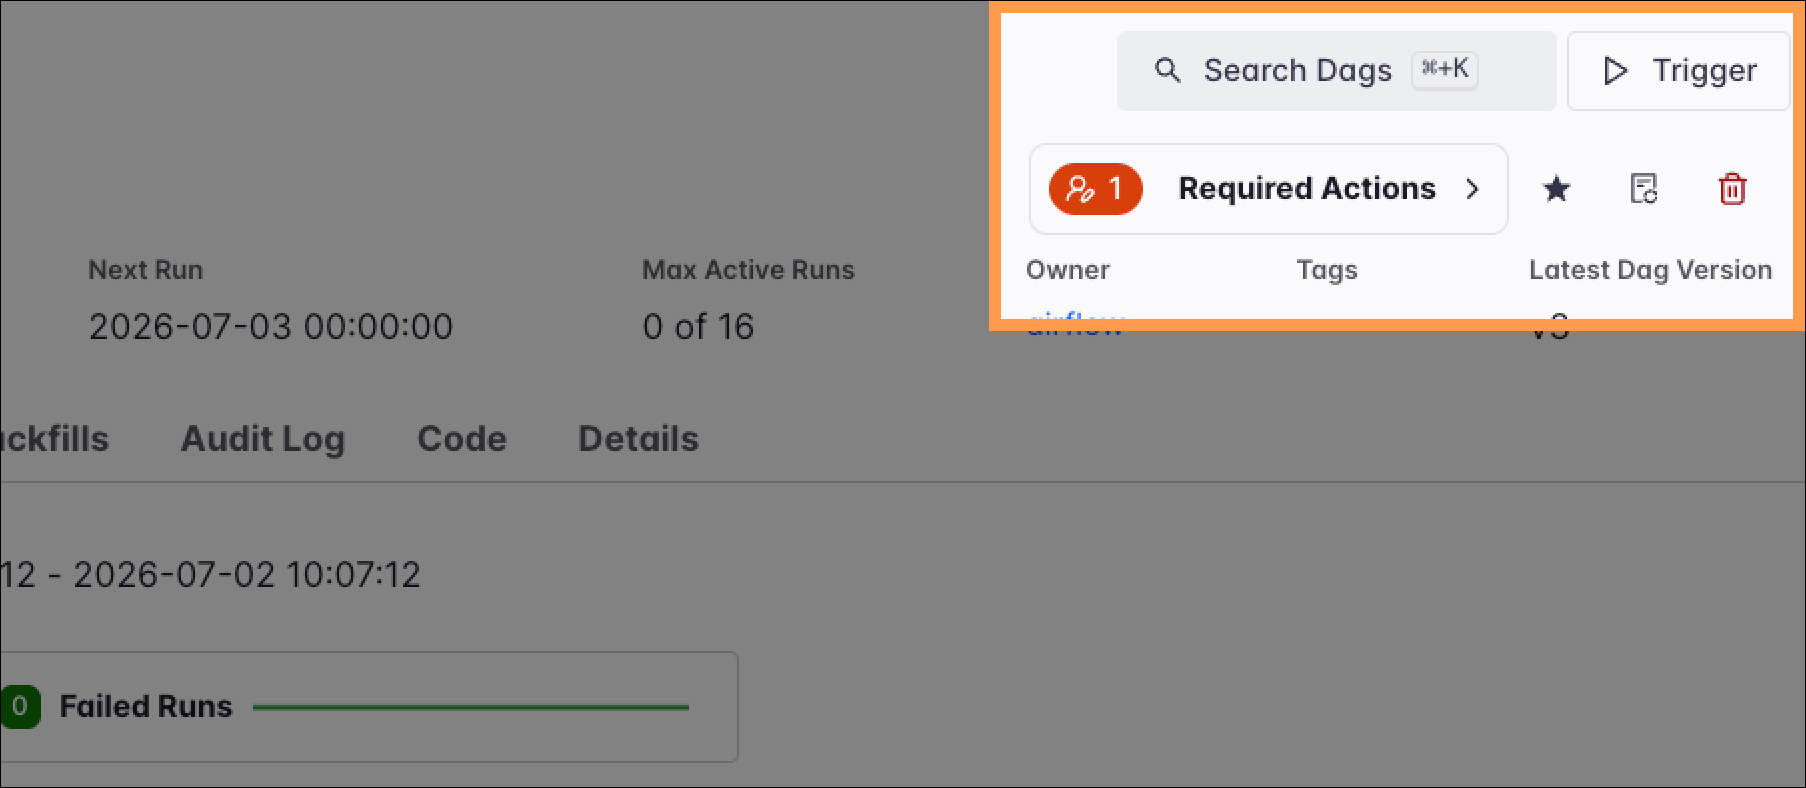
In the top-right corner of the individual Dag view, a set of action buttons provides direct control over the Dag’s lifecycle. In addition to responding to open required actions, favoriting, reparsing, or deleting the Dag, the Trigger button is your primary tool for initiating runs outside the regular schedule.
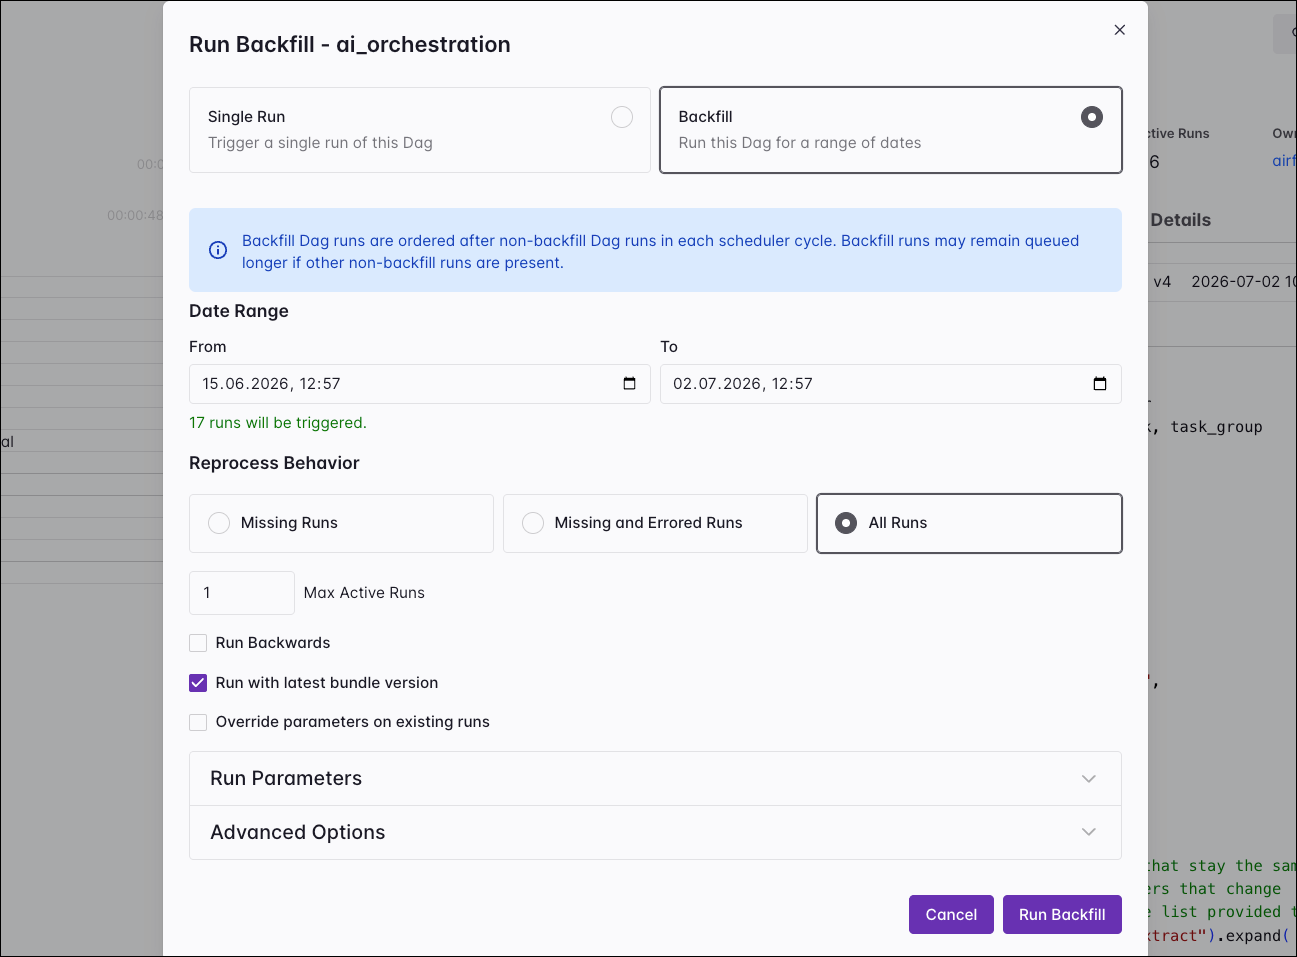
Clicking Trigger opens a dialog where you can start a single Dag run or a backfill operation. For both types of runs, you can supply custom configuration in the Advanced options area. For a backfill, you define a date range and select one of three reprocessing behaviors.
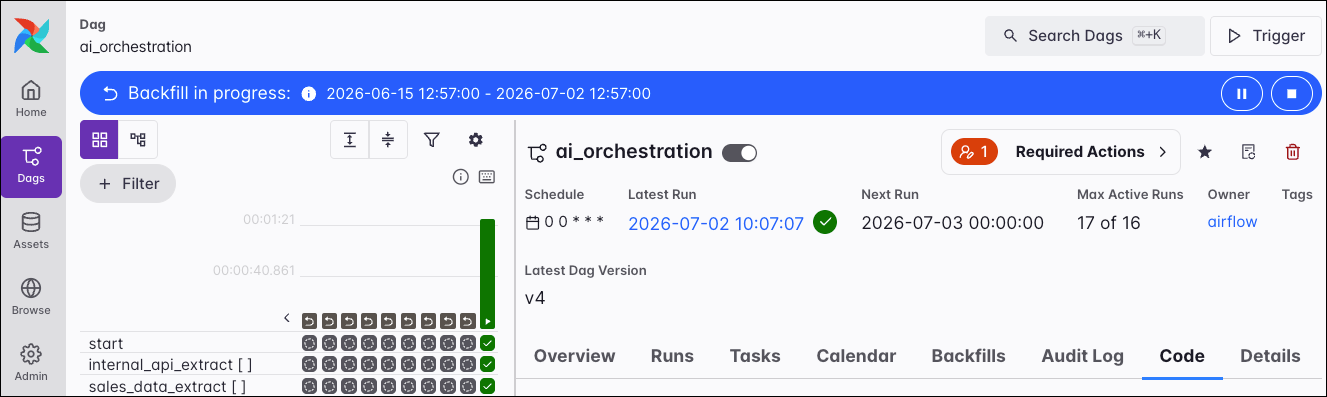
You can also control whether the backfill operation runs backwards and how many active runs to apply. While a backfill is in progress, a status bar appears at the top of the Dag view to visualize its progress. Individual runs created by a backfill are also marked with a dedicated icon in the grid, distinguishing them from regularly scheduled or manually triggered runs.
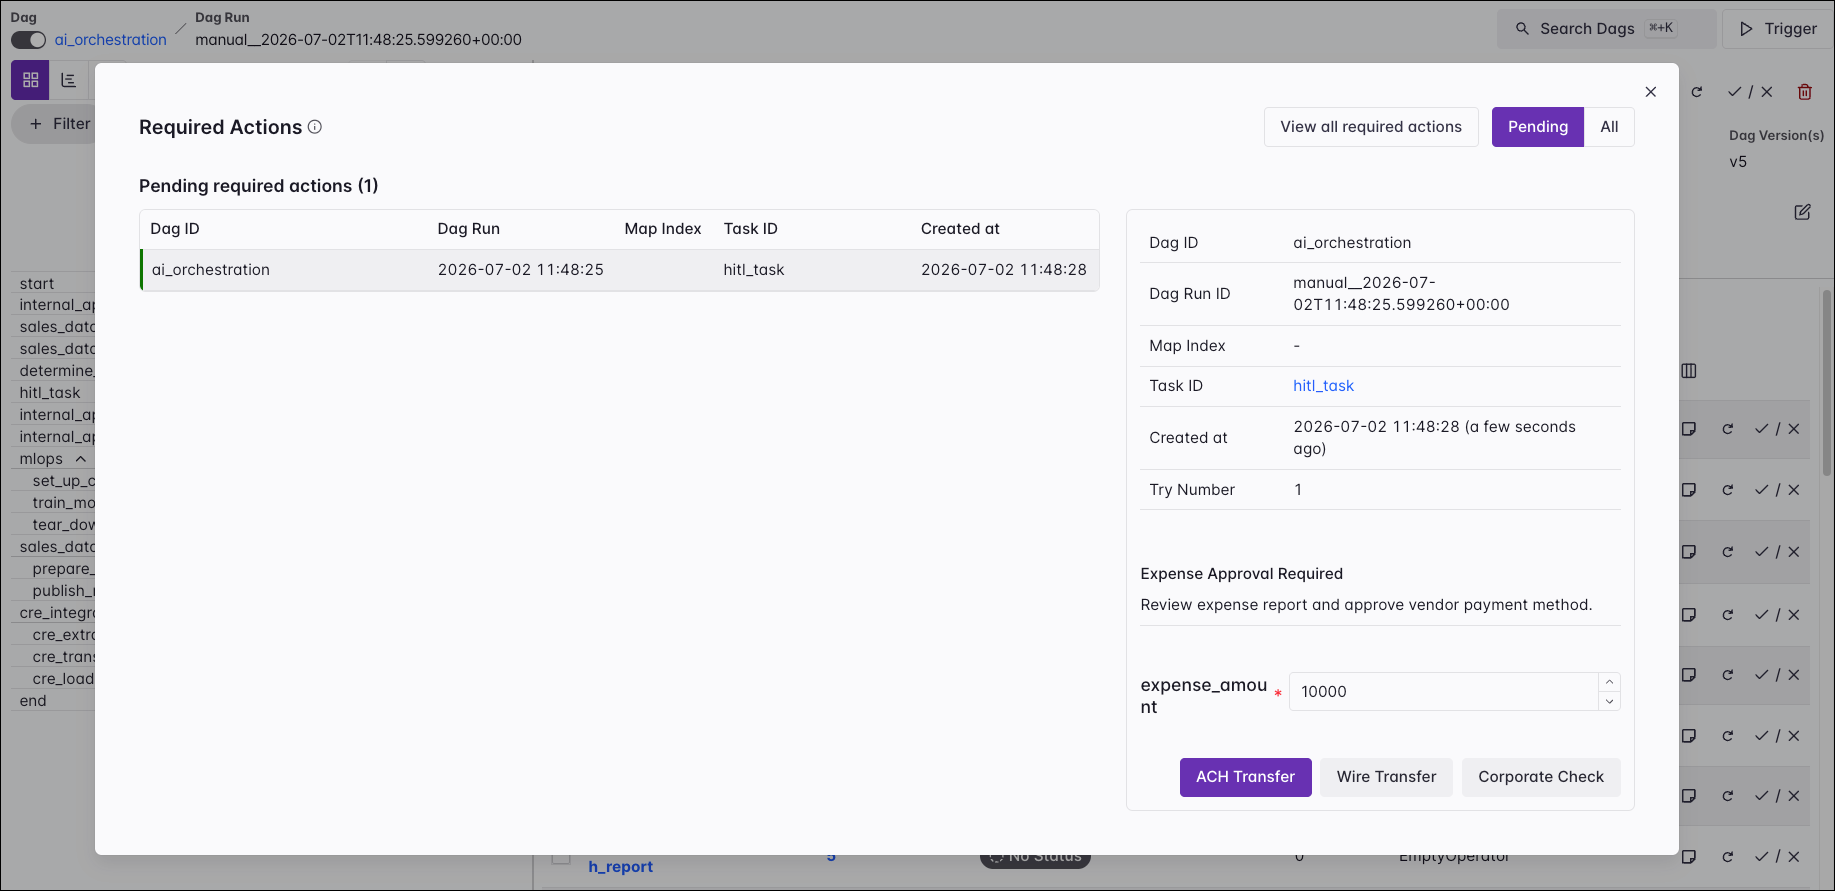
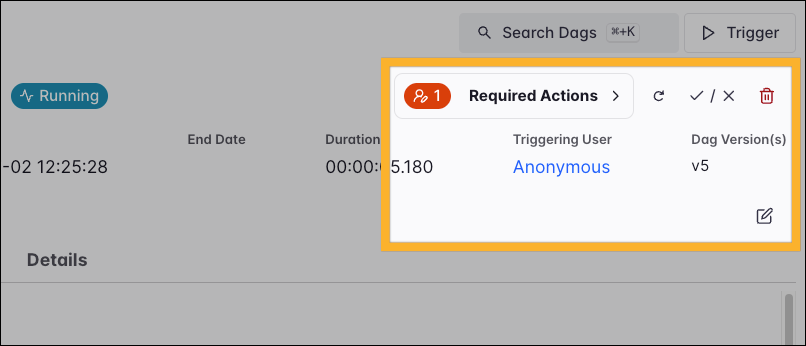
Required Actions
The Required Actions button is central to managing interactive workflows that use Airflow’s human-in-the-loop capabilities. This button is only visible for Dags with pending required actions.
It displays a list of all task instances that are currently awaiting an action or have required one in the past. Select any pending required action to view its details and respond to it.
Dag views
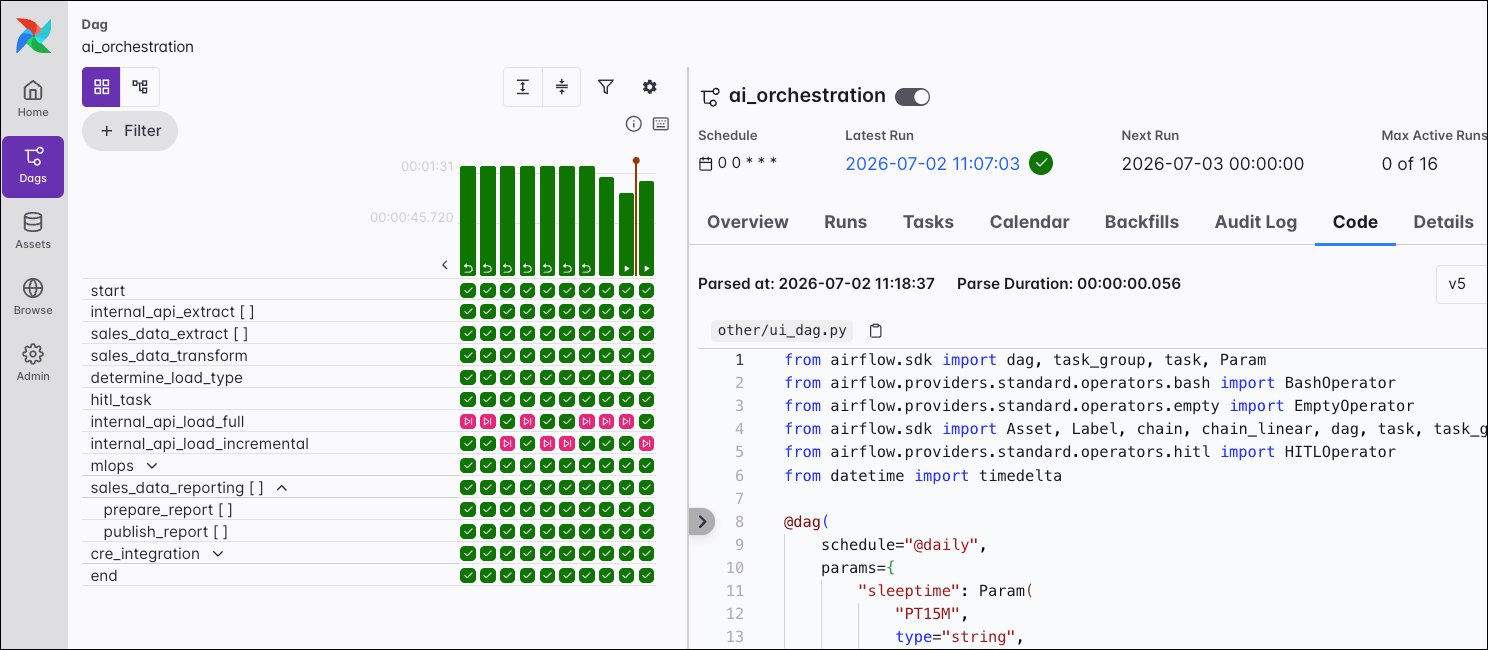
The two main visualizations of a Dag, displayed on the left side of the individual Dag view, are the grid view and the graph view.
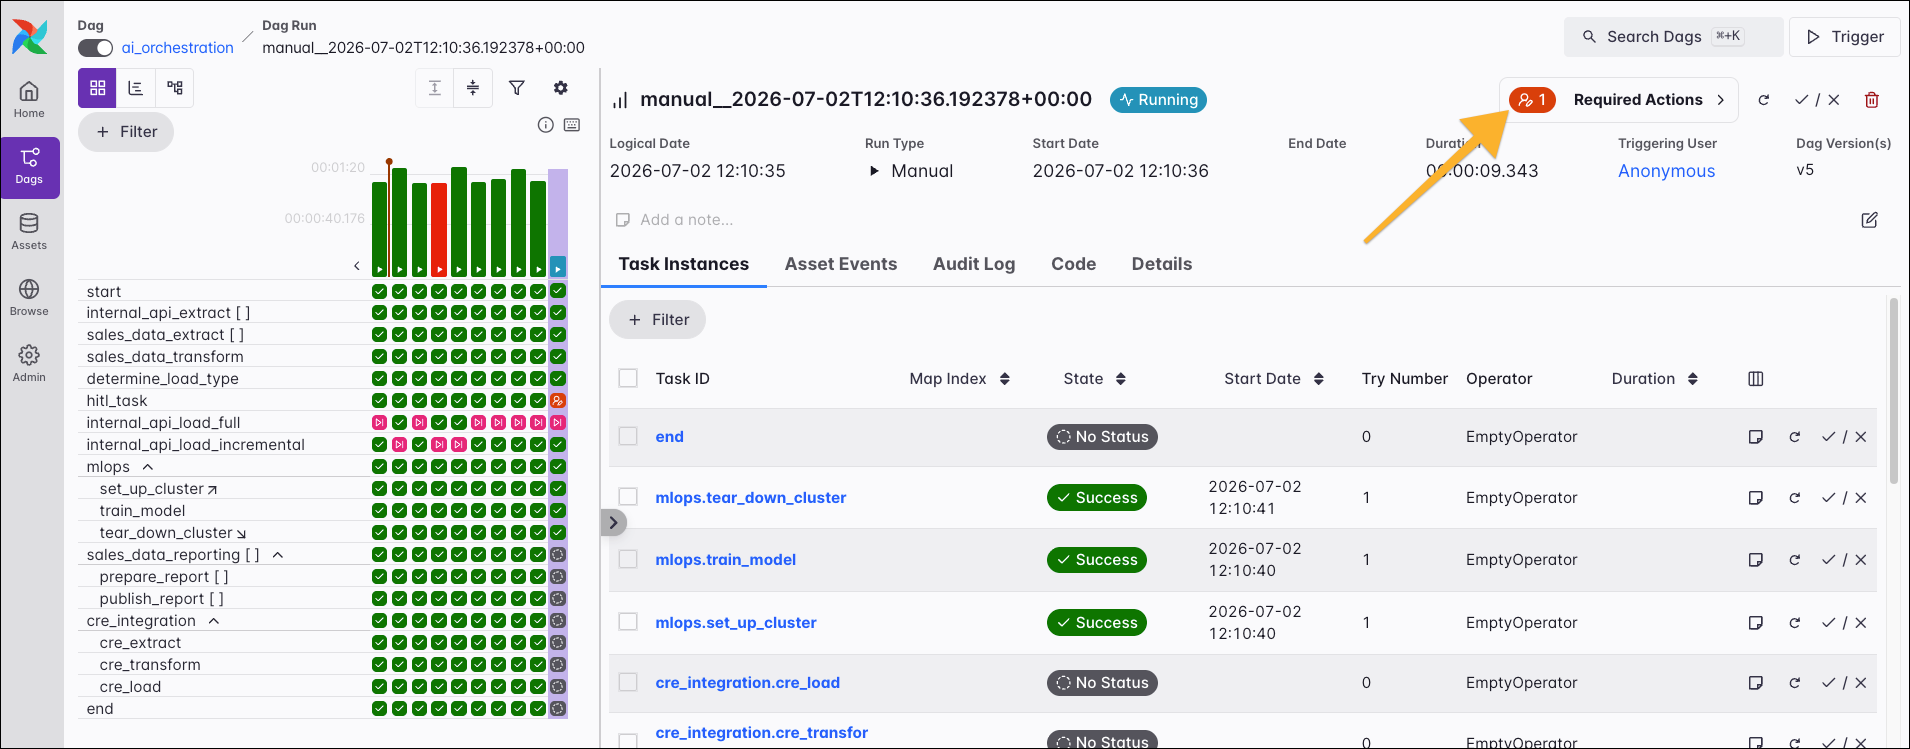
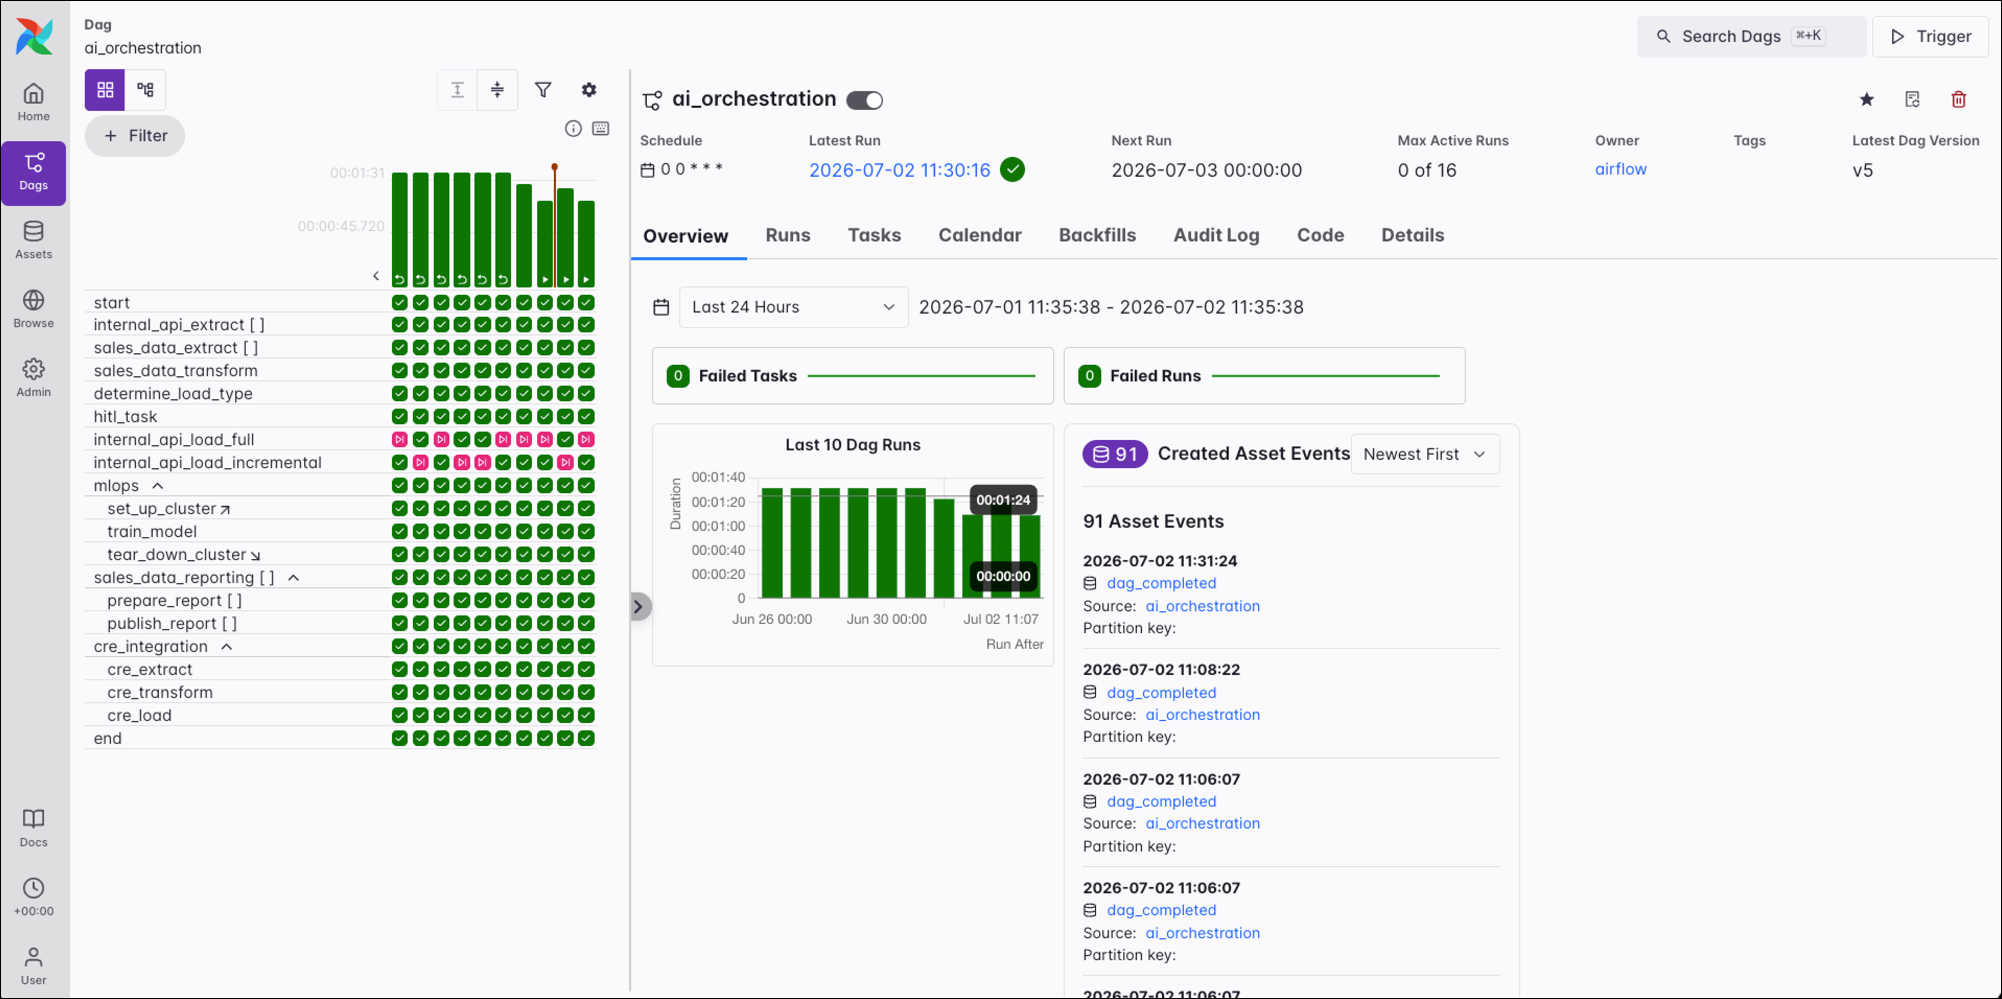
In the screenshot below, on the left you can see a grid representation of the Dag’s previous runs, including their duration and the outcome of all individual task instances. Each column represents a Dag run, and each square represents a task instance in that Dag run. Task instances are color-coded according to their status. A small play icon on a Dag run indicates that a run was triggered manually, a backwards turning arrow indicates a backfilled Dag run, and a small asset icon shows that a run was triggered by an asset update. If no icon is shown, the Dag ran according to its schedule.
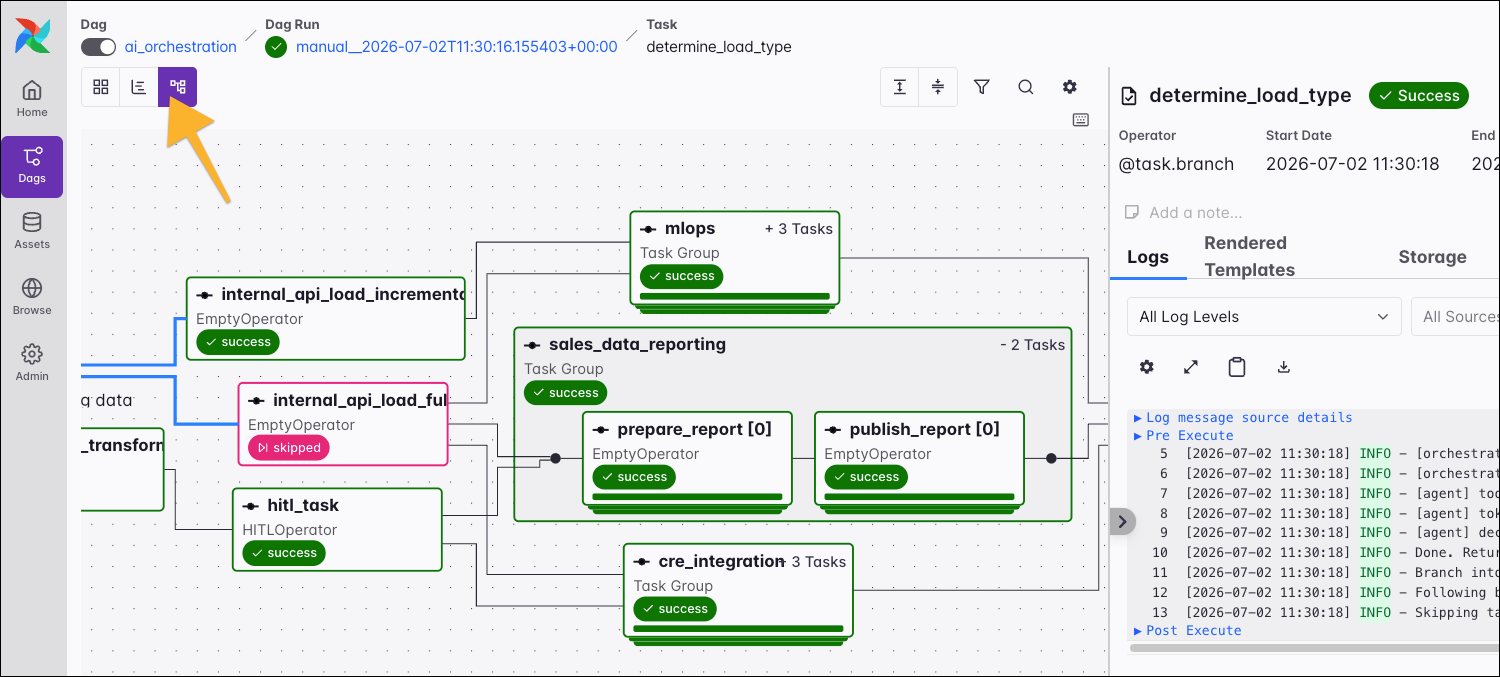
On the right side of the grid/graph view, you can see the different tabs you can select to access more information about the Dag, Dag run, task, or task instance you selected in the grid or graph view.
After clicking the upper bar of an individual run in the grid representation, you have the option to enable the Gantt chart by clicking on the Show Gantt button.
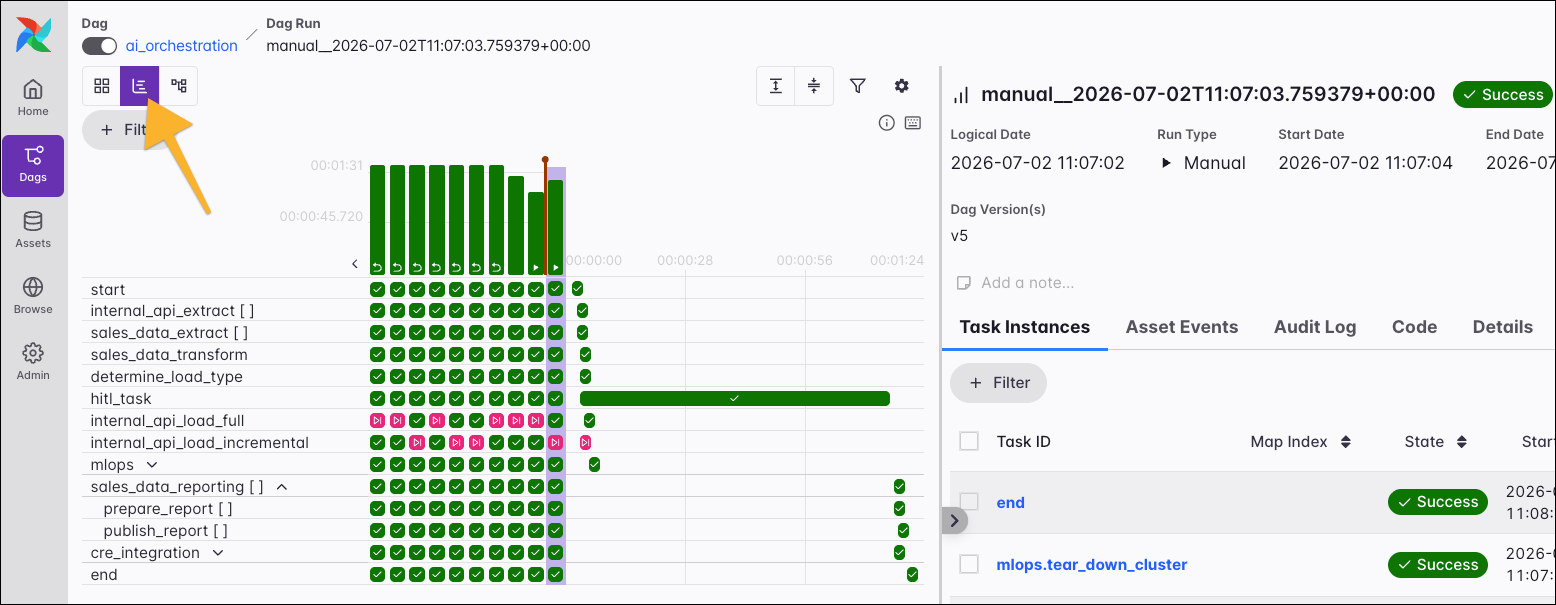
The Gantt chart provides a timeline view of a single Dag run, showing when each task started, how long it ran, and where tasks ran in parallel. This visualization is excellent for identifying bottlenecks in your pipeline. Look for long bars, as these represent the longest-running tasks. Optimizing these tasks can significantly reduce the overall duration of your Dag run.
Clicking a task instance box in the grid takes you directly to the task instance’s logs for quick debugging.
In the top-left corner, you can switch between the grid and graph views. The graph view shows your Dag, its tasks, and their dependencies. You can open the graph view from the individual Dag page to see the graph independent of Dag runs. Alternatively, open it for a specific Dag run to also visualize the task states.
Press g to quickly toggle between the graph and grid views.
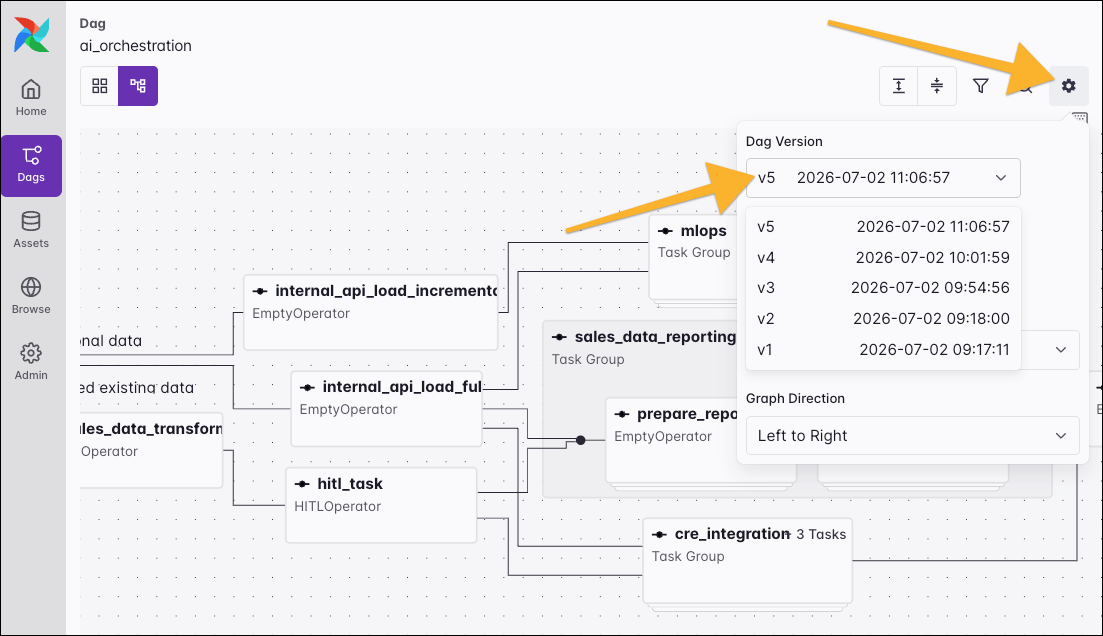
Use the gear icon in the graph view to select a specific Dag version. This lets you review your Dag’s history and see that version’s tasks and dependencies.
Tabs
There are several tabs available within the individual Dag view:
Get a summary of the most recent Dag runs and any related asset events.
View a detailed list of all historical and active Dag runs with their status and duration.
Inspect detailed information about each task within the Dag and its dependencies.
See past run history and future scheduled runs in a monthly calendar grid.
View and respond to any tasks that are currently paused and waiting for human input.
Review detailed information and logs for any backfill jobs that have been executed.
See a complete log of all events related to the Dag, including run triggers and task clears.
View the Python source code that defines the current version of your Dag.
See all metadata about the Dag, including its owner, tags, and parameters.
Overview
The Overview tab shows a basic summary of the Dag, including recent runs and related asset events. You can filter this view by different time ranges.
Runs
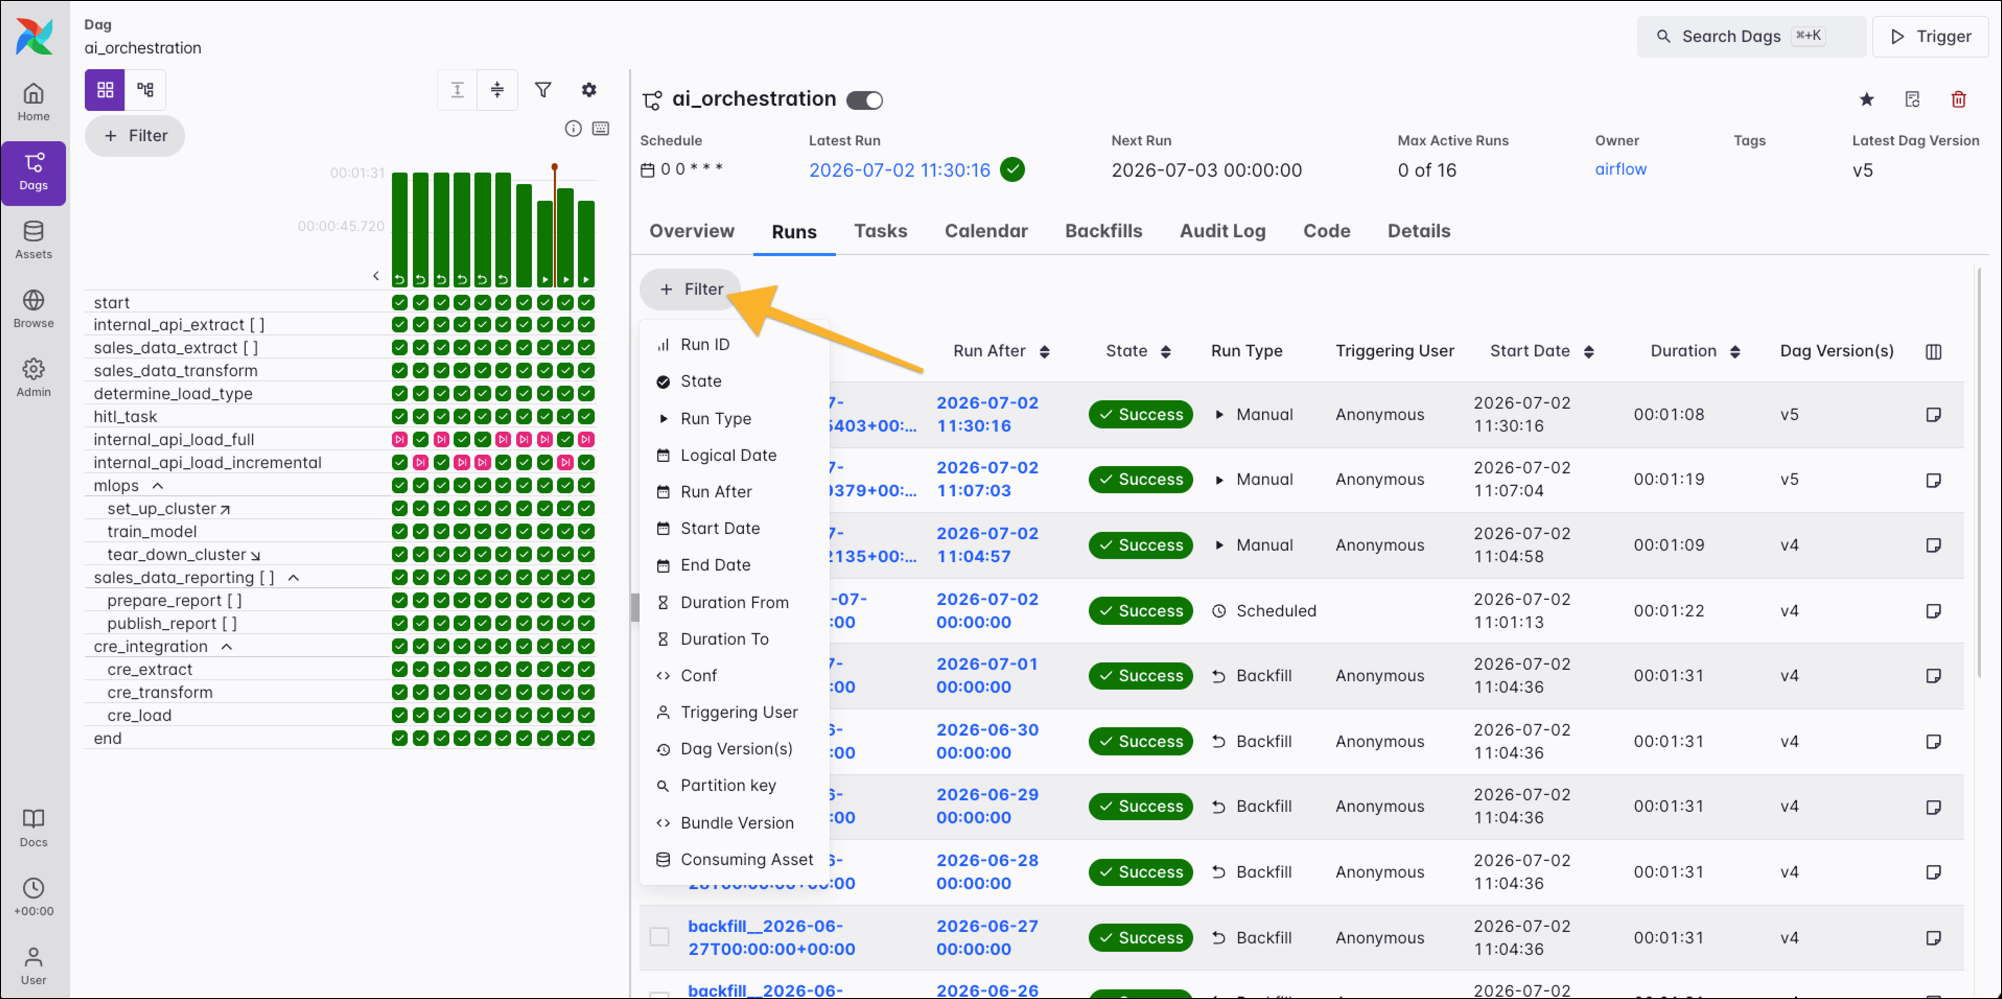
The Runs tab shows detailed information about Dag runs, including the run after date, state, run type, triggering user, start and end dates, duration, Dag version, and additional configuration values. You can open filters for the list by clicking on + Filter.
Click a run to open the individual Dag run view.
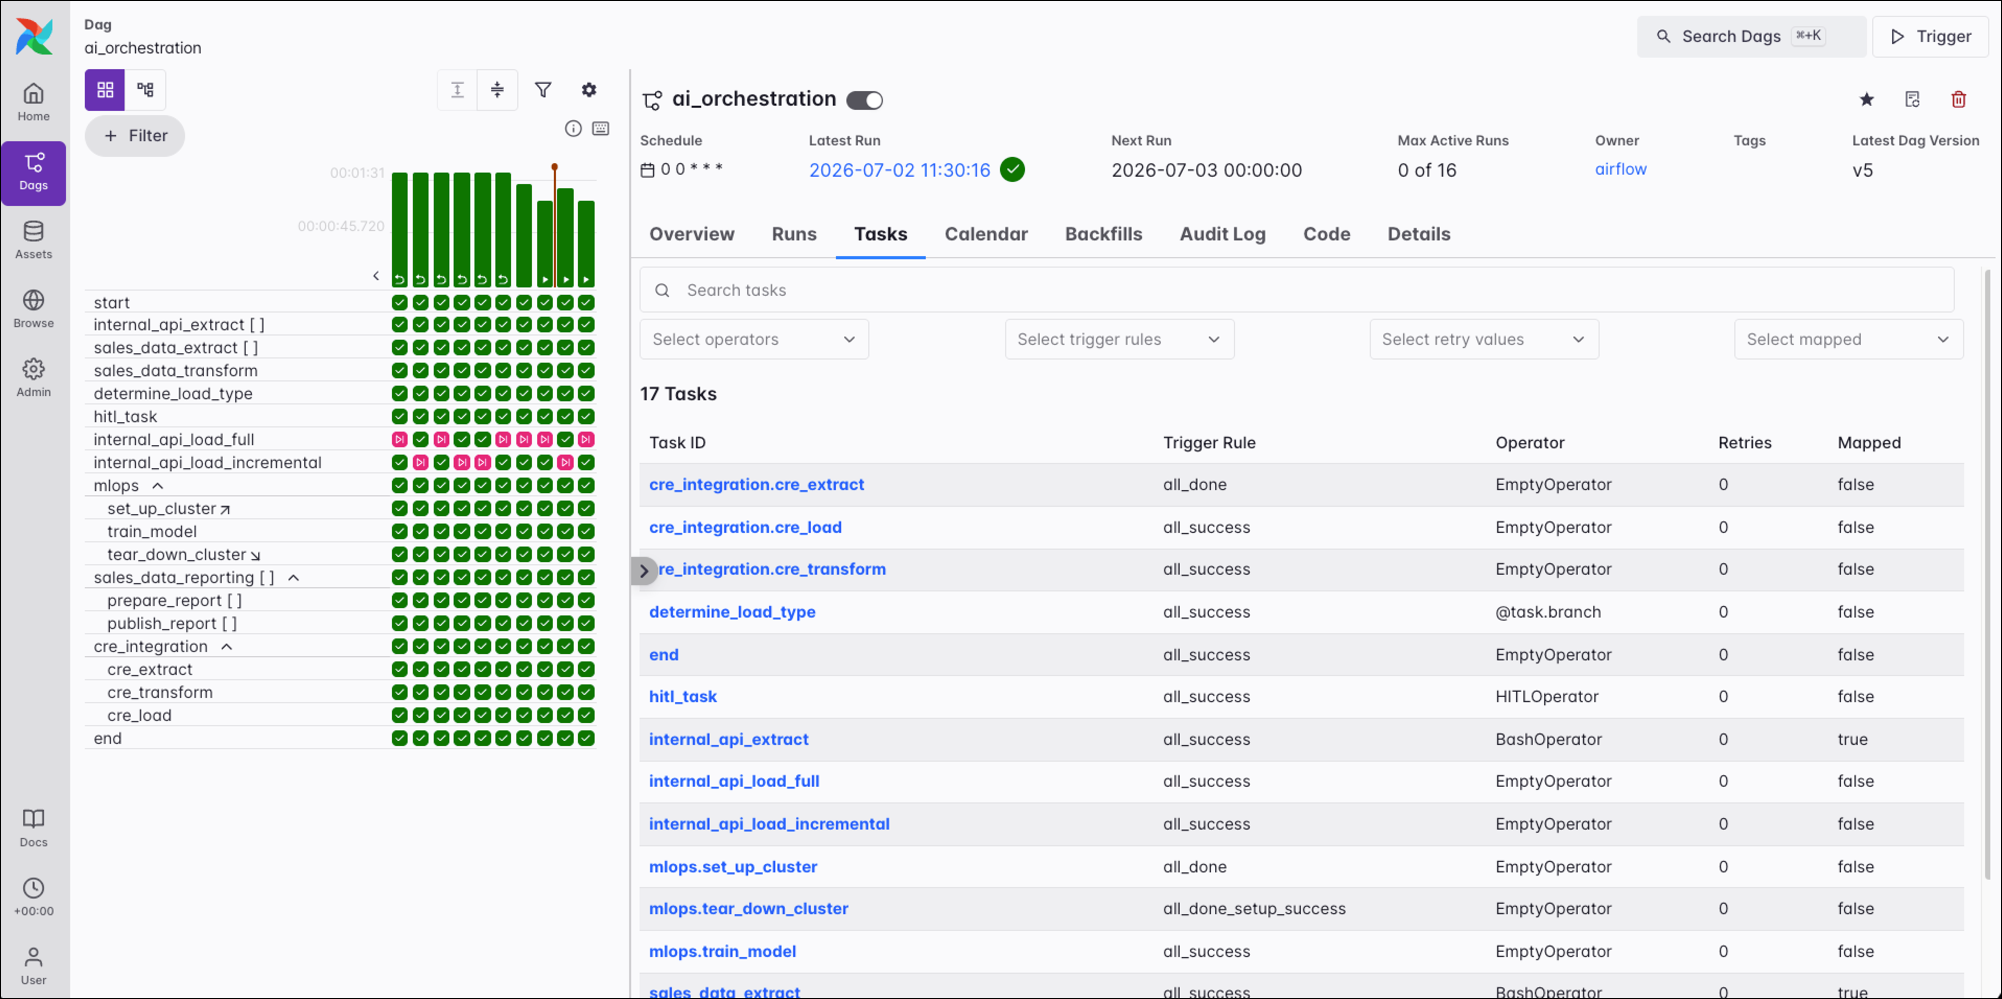
Tasks
The Tasks tab details information on all of the tasks in the Dag, including the task names, the operator type, the trigger rule, number of retries, and whether a task is dynamically mapped or not. You can click the individual task names to get back to the task overview page.
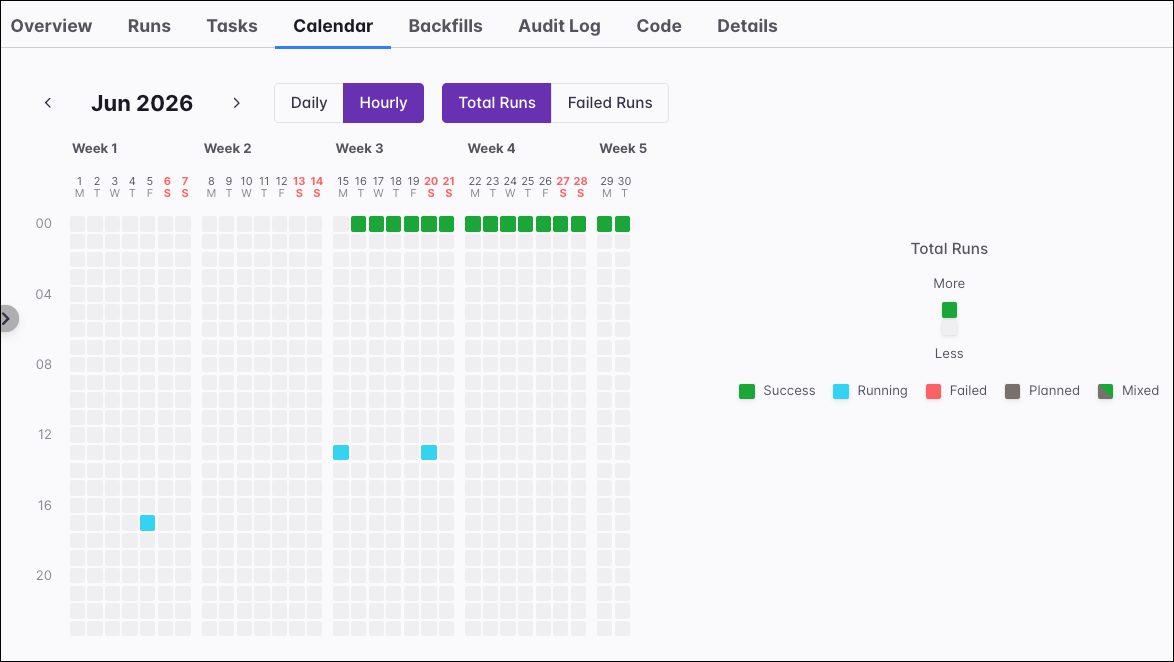
Calendar
The Calendar tab provides a long-term perspective on your Dag’s execution history. It presents a grid that visualizes run activity, which can be toggled between an hourly view for a given month and a daily view for an entire year.
Each colored square on the grid represents a time slot where one or more Dag runs occurred. The intensity of the color corresponds to the number of runs within that hour or day, making it easy to spot periods of high activity.
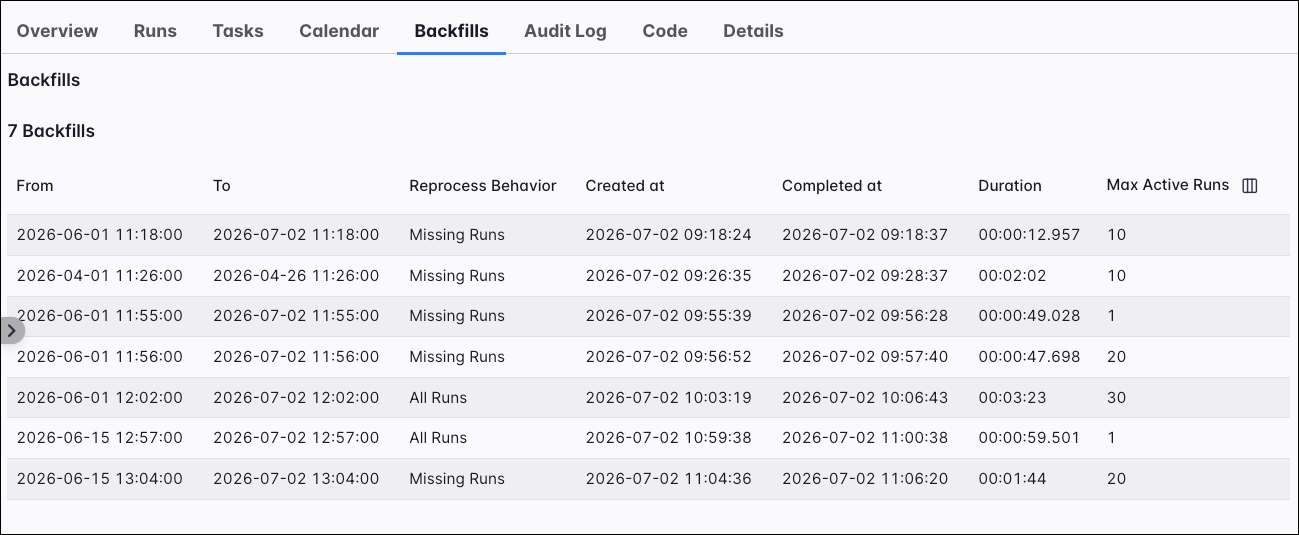
Backfills
Under the Backfills tab, you can see detailed information about the backfills that were run on the Dag. This includes information on when it was run from/to, the reprocessing behavior, when it was created and completed, the duration, and the max active runs.
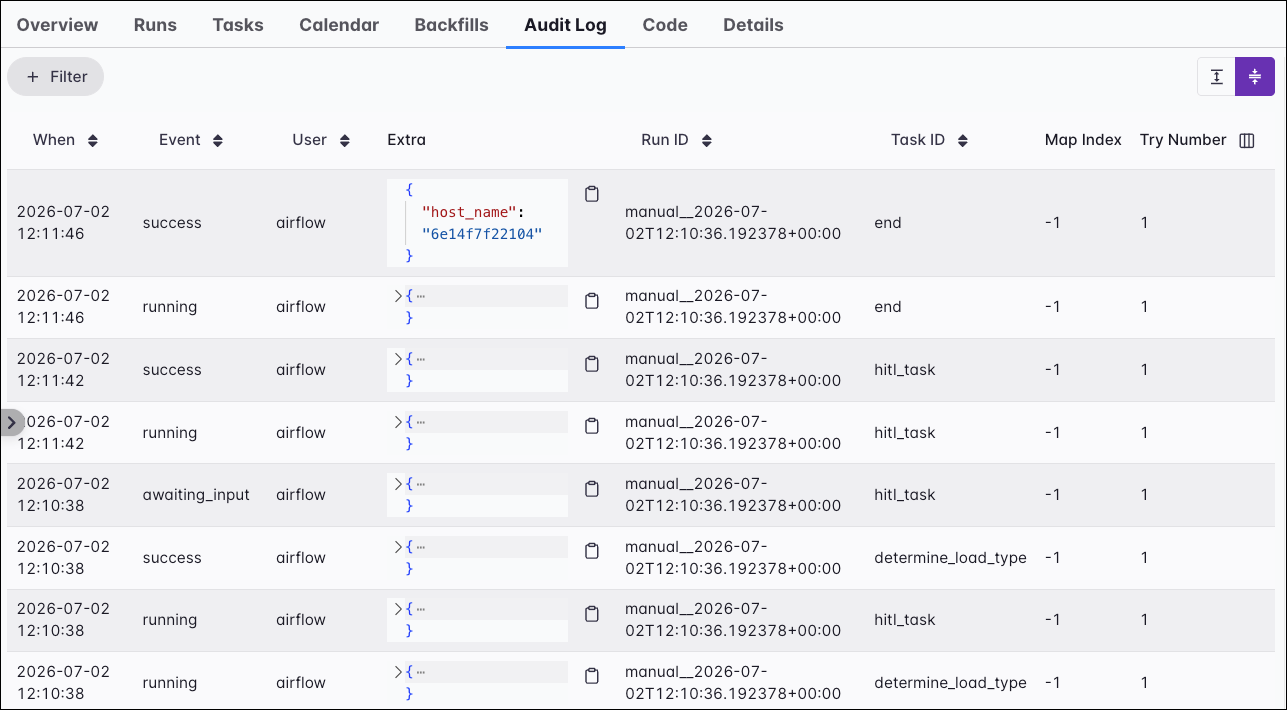
Audit Log
The Audit Log tab shows a list of events that have occurred in your Airflow environment related to the Dag, Dag run, or task instance you have selected.
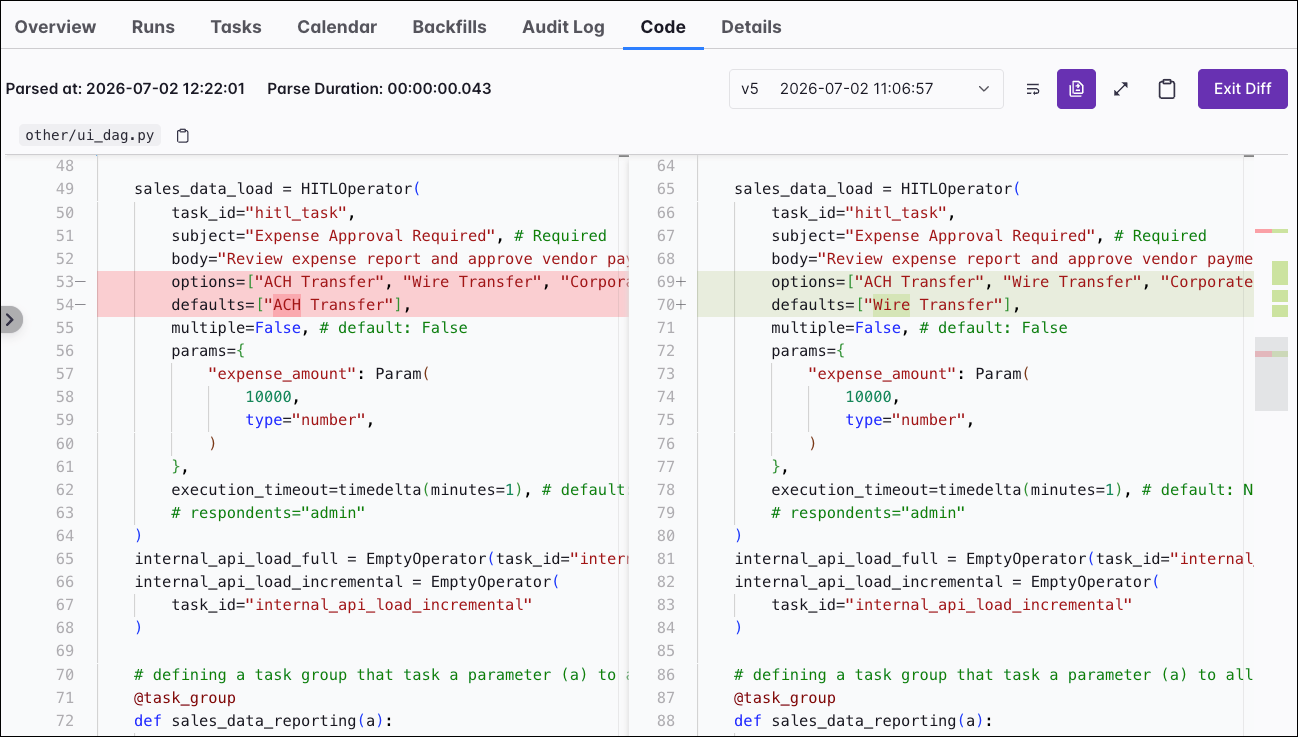
Code
The Code tab allows you to inspect the code for the Dag itself. It also shows the date and time of the last parse. You can copy the code, select which Dag version you want to see, and even compare the Diff between different Dag versions.
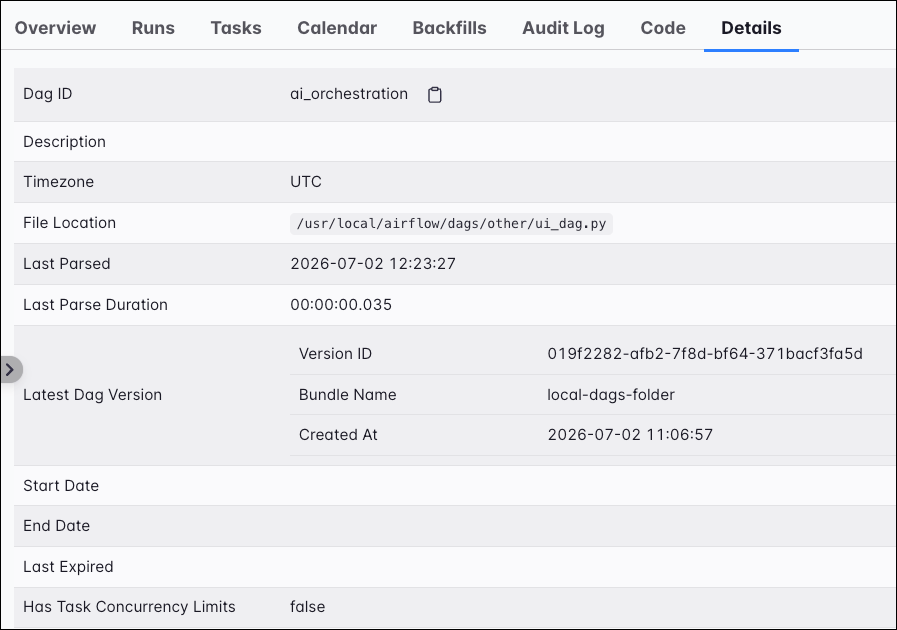
Details
The Details tab displays detailed information about the Dag. This includes information such as the Dag ID, description, timezone, file location, last parsed time, latest version information, and start time. You can also see Dag configuration information such as the concurrency number, max active runs/tasks, if catchup is enabled, and any params.
Dag run
The Dag run view represents a single Dag run. It offers similar tabs to those in the Dag view:
- Task Instances: Shows metadata for every task instance within this specific Dag run. Clicking on a task ID brings you to the details of the instance, including the logs and XComs.
- Asset Events: Displays the source asset events with their details.
- Audit Log: Provides a detailed audit trail related specifically to this Dag run.
- Code: Shows the exact version of the Dag code that was executed for this run, which is critical for debugging historical runs.
- Details: Displays metadata specific to this run.
The Dag run view also offers an important set of functions for operational management, including responding to any pending required actions, adding a note to the Dag run, clearing the Dag run, marking it as successful (Checkmark) or failed (X), or deleting the Dag run entirely.
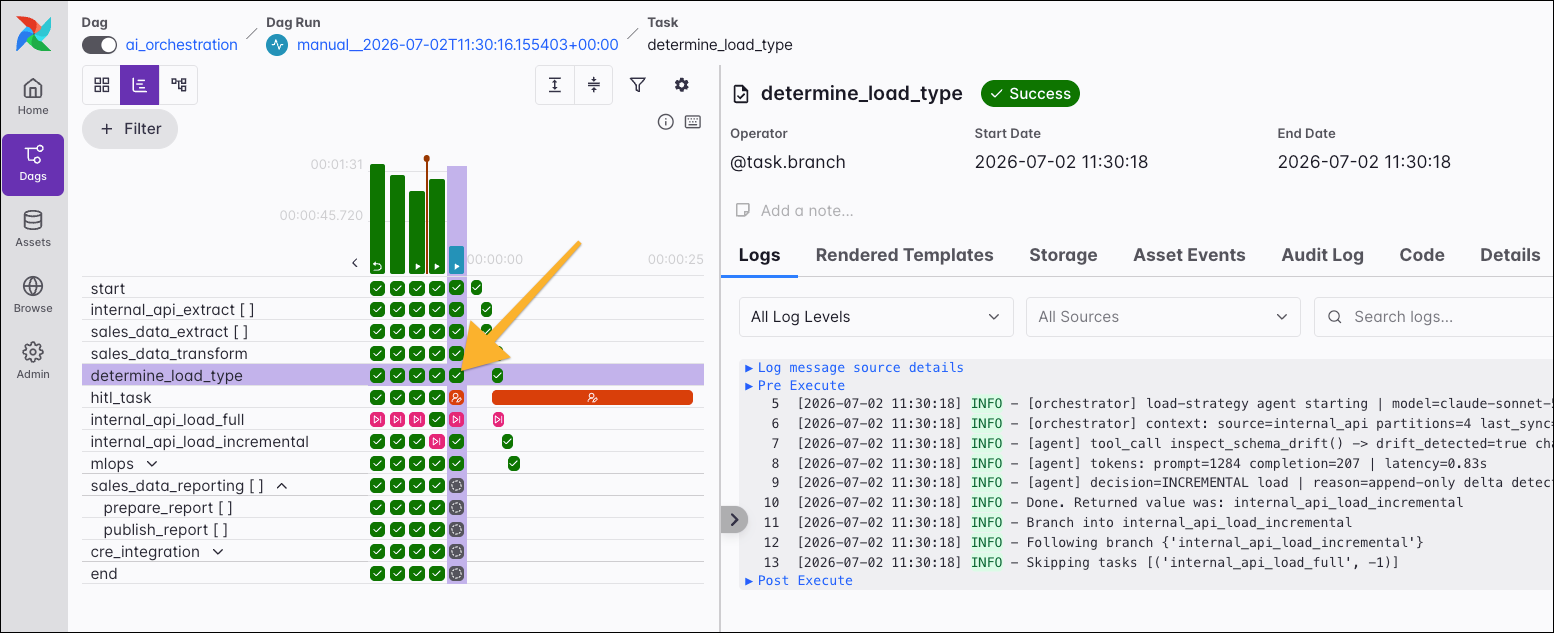
Task Instance
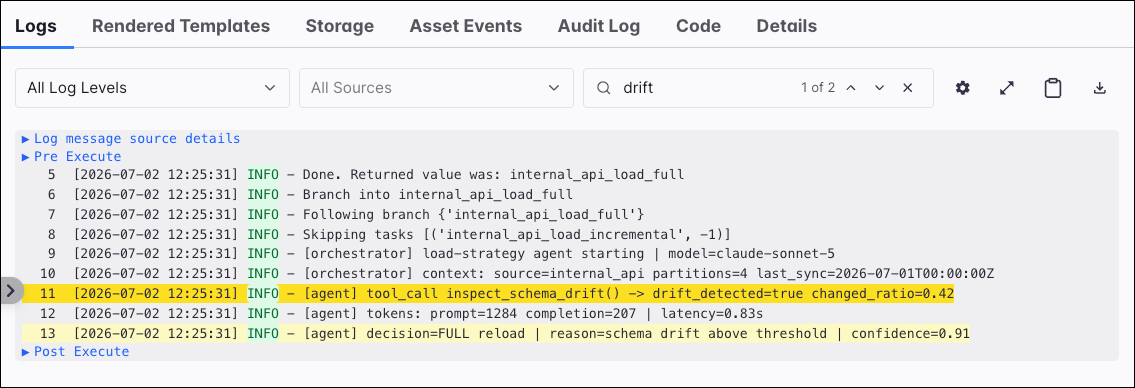
Drilling down one level further, selecting an entry from the Task Instances tab opens the individual Task Instance view. This is the most granular interface for debugging in Airflow, focusing on a single execution of a single task.
The centerpiece of this view is the Logs tab, which provides direct access to the log output for that specific task run. For easier debugging, the logs are syntax-highlighted, you can filter them by log level to quickly isolate important messages, and use the Search field to run a freetext search. In addition to logs, other tabs offer further information about your task instance, for example, the data it pushed to XCom.
Assets
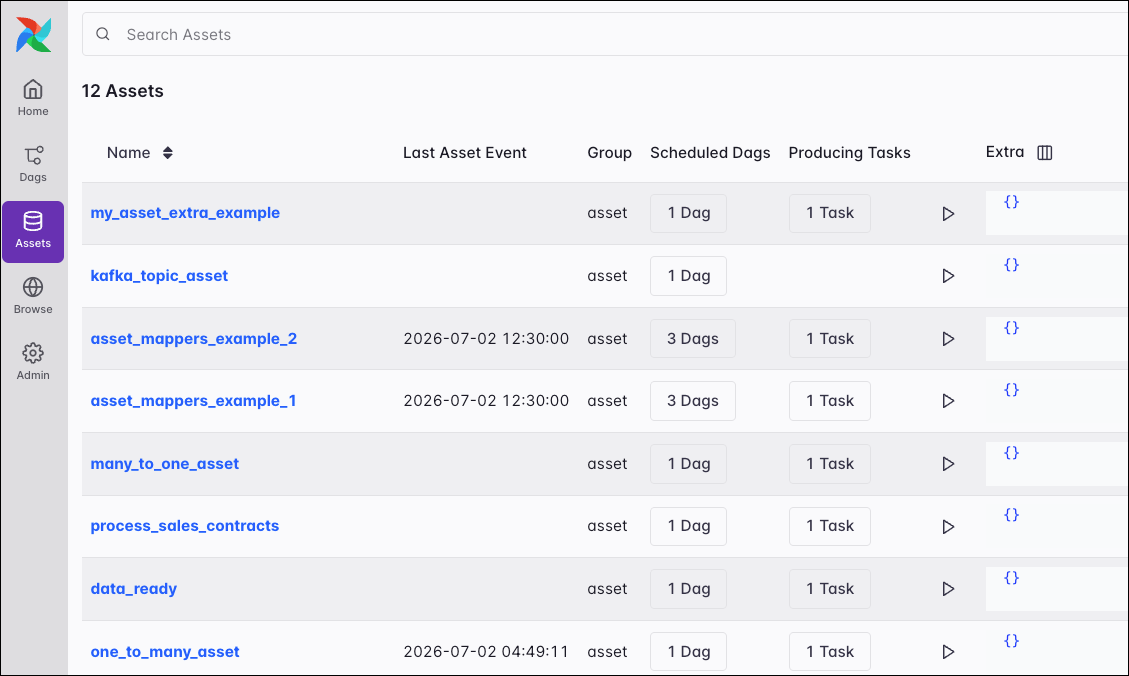
The Assets tab allows you to see a list of the assets associated with your Airflow instance.
By default, assets are shown in a list that displays key information for each one:
- Last Asset Event: The date of the most recent asset event, indicating data freshness.
- Group: The asset group it belongs to.
- Scheduled Dags: Which Dags have schedules that include the asset.
- Producing Tasks: The specific tasks that updated the asset.
From this view, you can also use the play button to manually generate an asset event for testing or to kick off a data-aware workflow including one or more Dags.
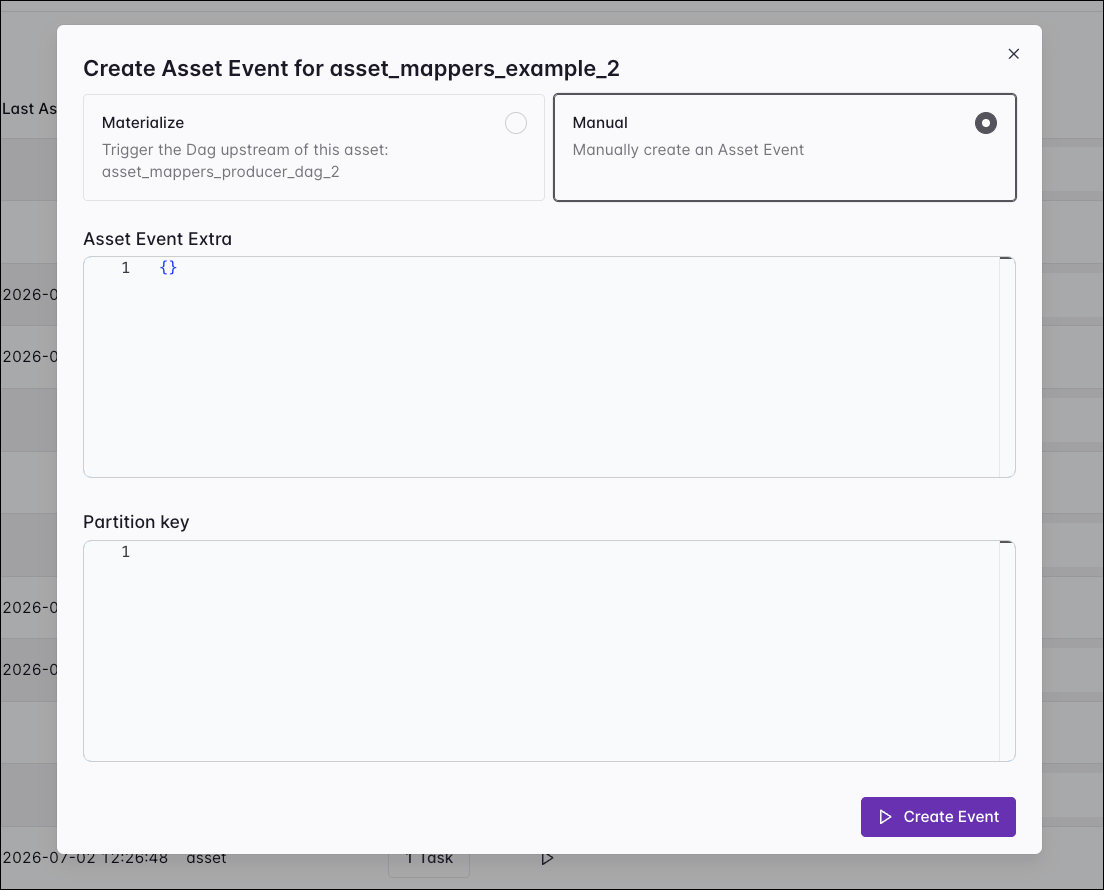
There are two ways to create an asset event:
- Materialize: Trigger the underlying producing task of this asset.
- Manual: Directly create the asset event, without running the producing task. Allows you to optionally attach extra information and/or a partition key to the asset event.
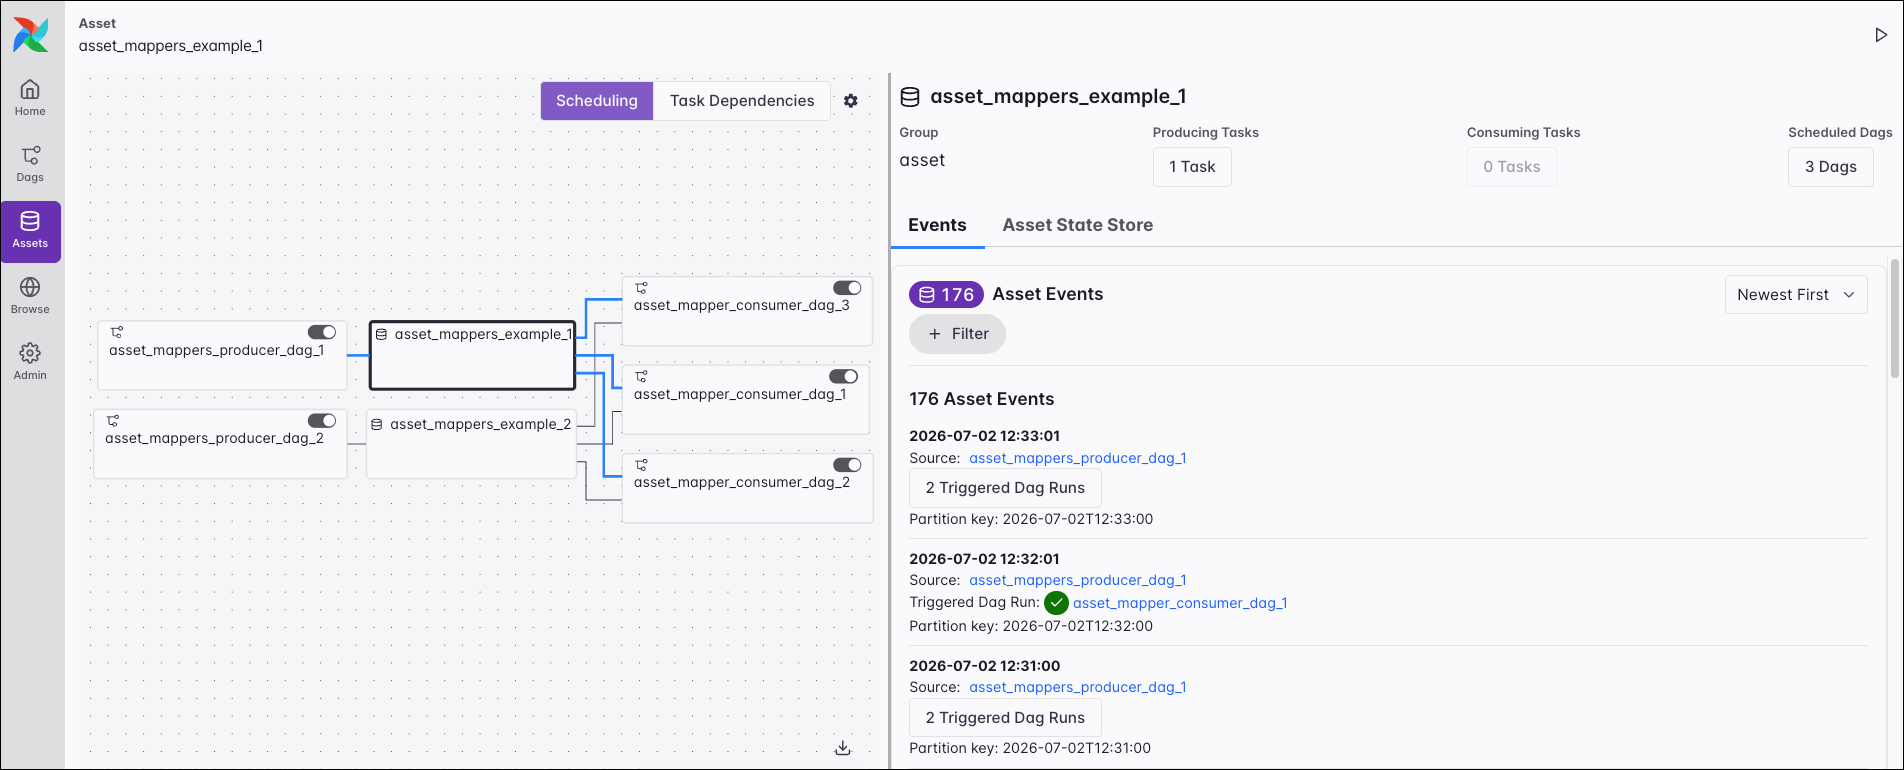
By clicking an individual asset, you can switch to the asset graph, which visualizes the dependencies between assets and Dags, providing an overview of how your Dags and your data depend on each other. On the right side of an asset graph, you can see more details about the related asset events, as well as the Asset State Store.
You can also generate an asset event from this view by using the play button in the top right corner.
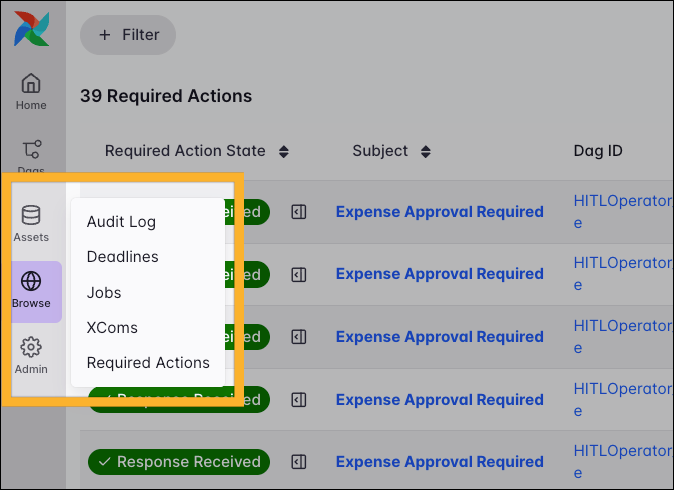
Browse
The Browse tab provides detailed information from your Audit Log, Deadlines, Airflow Jobs, required human-in-the-loop actions, and your XComs.
The Audit Log lists all your logged events. This includes information such as when an event occurred, which user is associated with the event, and extra information about the associated Dag and task.
The Deadlines view contains a list of all deadline alerts alongside their Dag run, deadline time and status.
The Jobs view shows a list of all Airflow Jobs currently running in your environment. An Airflow Job is a Python process for an internal Airflow component, such as a SchedulerJob or a TriggererJob. These jobs record heartbeats and track the lifecycle of those components.
The XComs view provides a centralized location to inspect all XComs pushed by tasks across your Airflow environment. It is an essential tool for debugging data-passing issues between tasks. The view displays a filterable list where each entry shows the XCom’s key, its value, and the exact task instance that pushed it, identified by its Dag ID, run ID, task ID, and map index.
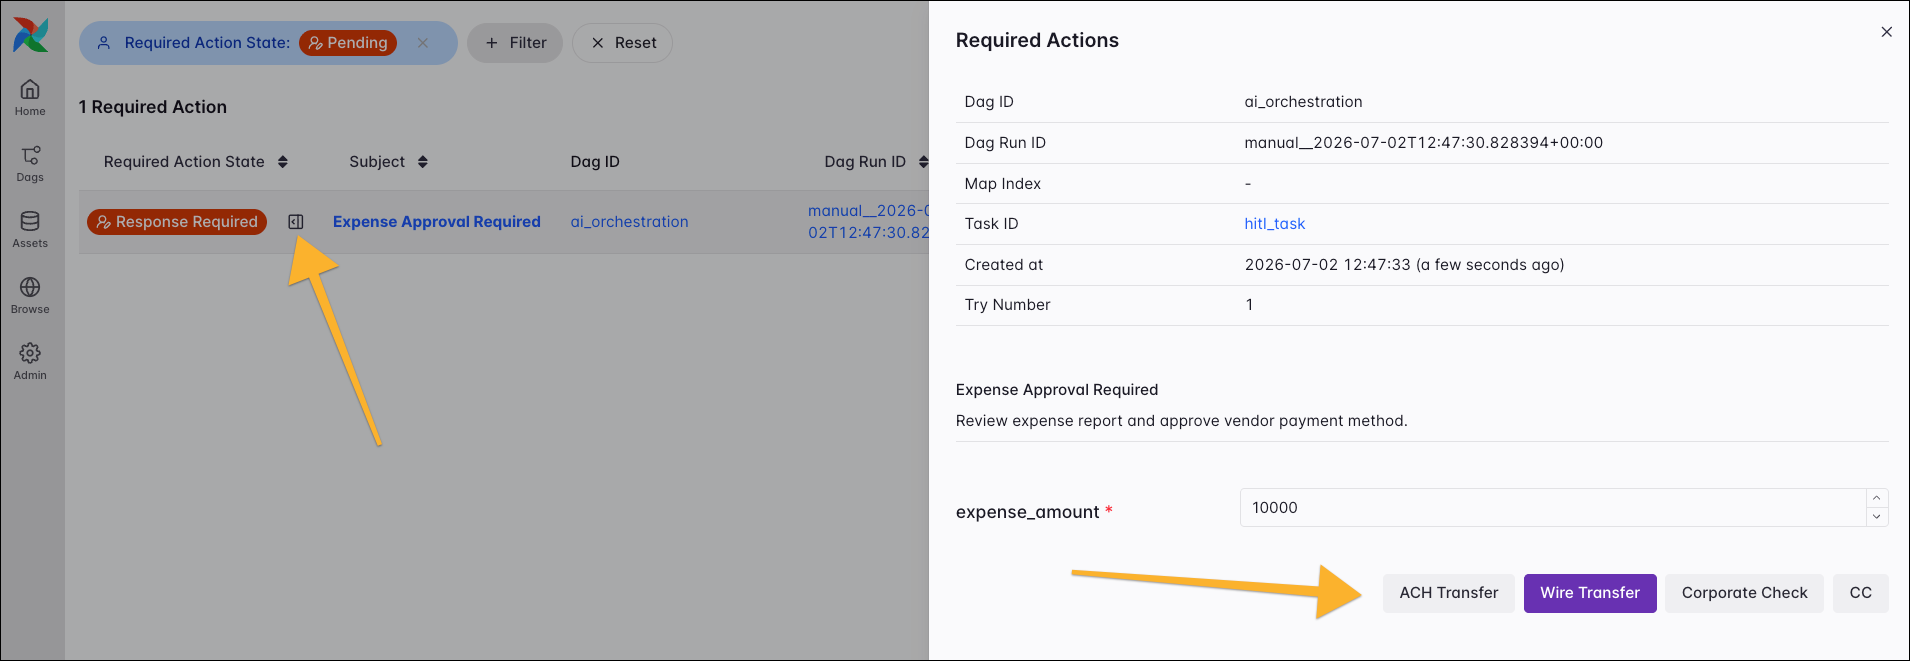
Under Required Actions, you can find the global list for managing all human-in-the-loop tasks across your entire Airflow instance, including all task instances that are either pending user input or have been previously reviewed. You can filter the list to focus on a specific required action state.
To take action on a pending task, simply click the Open review drawer icon next to the action’s state and respond in the drawer to the right.
Admin
The Admin tab provides you with tools for operational management not specific to any particular Dag. You can use them to view and modify your Airflow environment.
- Variables: View and manage Airflow variables.
- Pools: View and manage Airflow pools.
- Providers: View all installed Provider packages in your environment.
- Plugins: View any Airflow plugins defined in your environment.
- Connections: View and manage Airflow connections.
- Config: View the contents of your
airflow.cfgfile.
Note that the Config view is often disabled for security reasons. You can control this behavior by setting the api.expose_config configuration.
Docs
The Docs tab provides links to external Airflow resources, such as the official Airflow documentation, the GitHub repository, and the Airflow REST API reference.
Timezone
The Timezone tab lets you change the time zone used for time displays in the Airflow UI. Note that this setting doesn’t influence your Dag schedules.
User
The bottom-most icon on the navigation is the User tab. This allows you to:
- Select your preferred language
- Toggle Light/Dark Mode
- Default to Graph View
- Generate an API or CLI JWT token.
- Log out
On Astro you don’t need to generate a JWT token to programmatically interact with your Airflow environment. For CLI access use the Astro CLI and authenticate with astro login. See Using the Airflow REST API with Astro for information on how to get API access to Airflow environments running on Astro.
Conclusion
This guide provided a basic overview of some of the most commonly used features of the Airflow UI. The UI has become much easier and more intuitive from 2.x to 3.x.
Airflow plugins are external features that can be added to customize your Airflow installation. In this guide, you learn how to extend the functionality of the Airflow UI using plugins.
The Airflow UI is a dynamic and evolving part of Airflow, with the open-source community continuously working to improve the user experience and add new functionality. To take full advantage of these enhancements, make sure to upgrade your Airflow environment frequently.
If you have ideas for improving the UI or want to help build its next generation of features, the Apache Airflow community welcomes your contributions.