Orchestration, or How to Become a Data-Driven Company
24 min read |
Orchestration at StarPower
Consider the following scenario, of a company that coordinates its data orchestration in a way that allows multiple teams to work independently but collaboratively. It’s a provider of cloud-based software — let’s call it StarPower, Inc. Anyone at StarPower who works with data can come up with an idea in the morning and have it become an operational metric or model by the afternoon. And that metric or model will automatically be embedded in the organization’s network of data pipelines — all running on auto-scaling infrastructure, all documented, tested, and reproducible, with lineage traced from end to end.
Airflow is at the center of all of this, but almost invisibly. Analysts across the organization can take advantage of these capabilities with almost no training, and minimal maintenance is required from StarPower’s operations team.
If all this sounds too good to be true, bear with me. We’ll get to what makes it possible — and, increasingly, a reality — for many companies. But first, let’s take a closer look at how this story plays out at a place like StarPower.
A data consumer gets to the source of truth
Zac, the head of IT at StarPower, is running a report that shows how long it takes the Customer Success team to onboard a new customer. He’s curious about how this metric is defined, and he’s able to drill down from the field in the report directly into the company’s data dictionary, where he reads that it’s computed from a set of dates that are manually entered into the customer success database. “Computed how, exactly?” he wonders. So he drills further down, into a visual map of StarPower’s lineage, a graph of the relationships between every single dataset that the company produces and consumes.
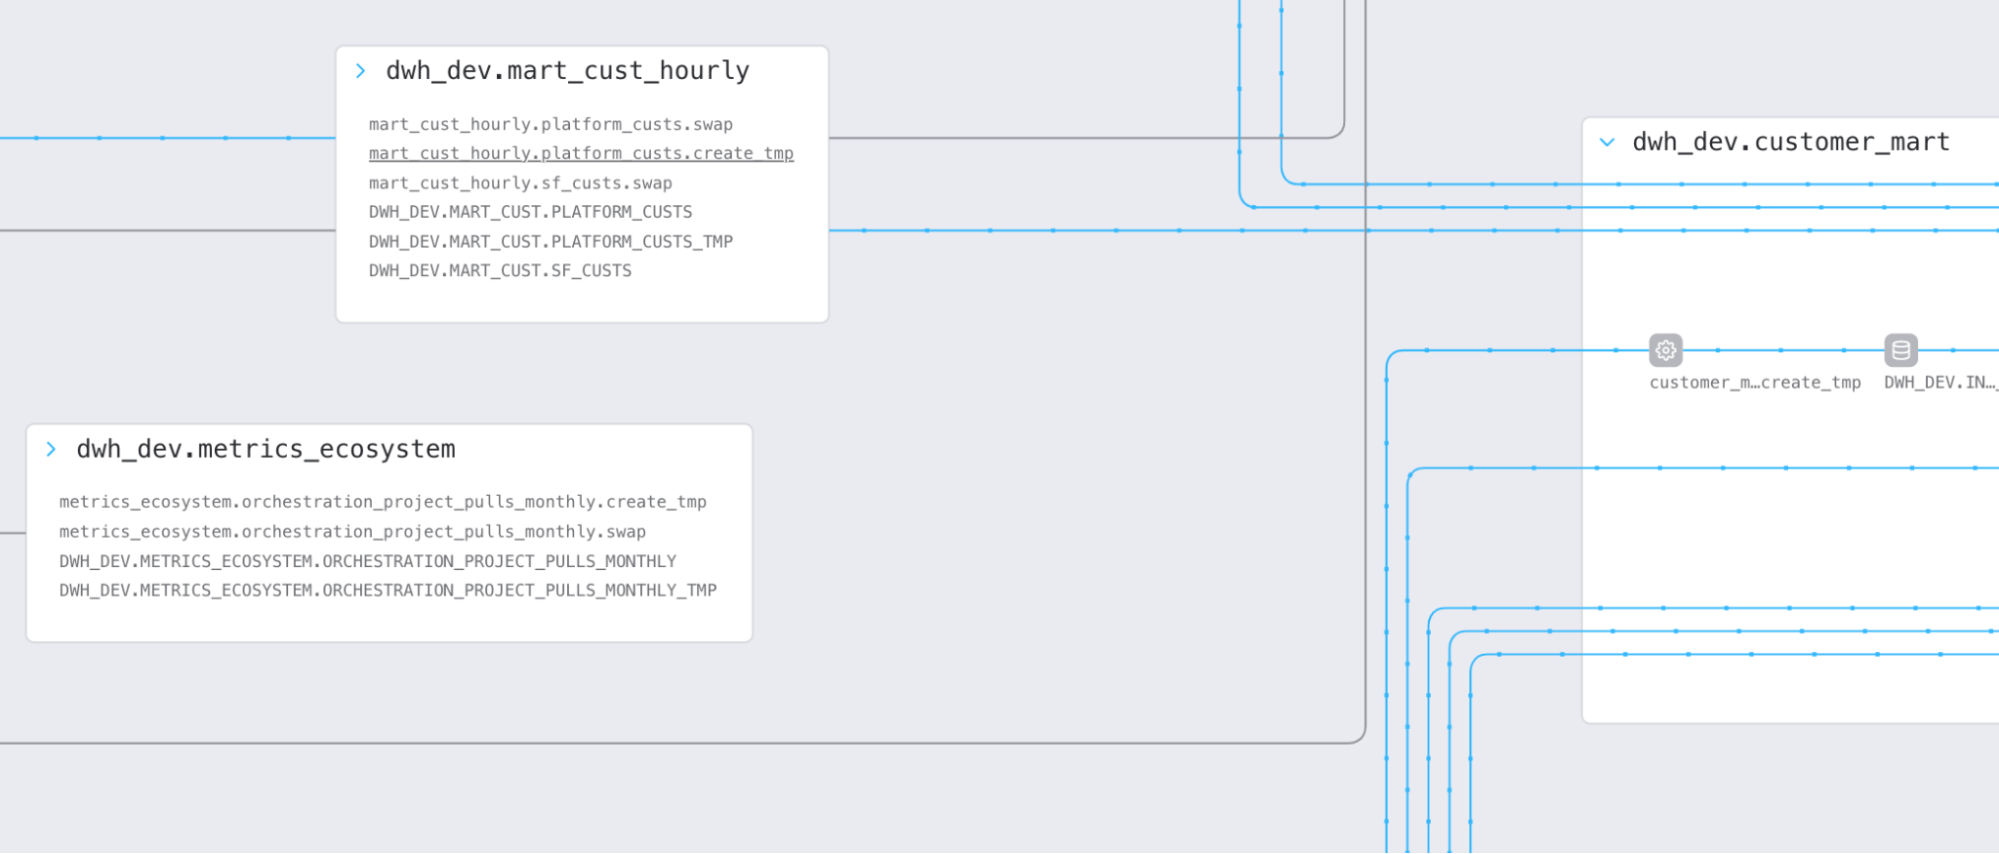
The graph shows him the SQL and the upstream datasets that produce the field in the report, and from those, he’s able to determine who owns the original Airflow pipeline that does most of the work to run the computation. He’s got an idea about another way to measure onboarding efficiency, so he contacts the owner of that pipeline to request adding an alternative metric to the calculations performed in the data warehouse.
Customer Success creates its own data pipelines and operational reports
StarPower has a central data team that does a lot of its analytics and data processing, but the pipeline owner, Carlos, is not a member of that team — he leads Customer Success. He’s not an expert in analytics, but he has built a collection of operational reports that are approved for use by people throughout the company. How? He starts from a set of fully documented and approved datasets in the Snowflake data warehouse. To compute his onboarding metrics, or to add Zac’s new metric, he simply provisions a new notebook on the company’s data portal, where he’s supplied with a connection to the warehouse. In a series of SQL cells, he joins and aggregates metrics from the approved customer data model. He can also search a private registry of commonly used functions that the central data team provides, to help him build up his queries and incorporate tests.
Once he’s happy with the output, he chooses to run the computations whenever the customer model is updated (daily, as it happens), and then deploys the notebook (as an Airflow DAG, unbeknownst to him) directly into the development environment. After the central data team does a quick review of his code, his new metrics and report are running in production.
Assuming the SQL isn’t too complicated, the whole process — from Zac’s request to operational metrics — takes a few hours.
Teams coordinate their data pipelines
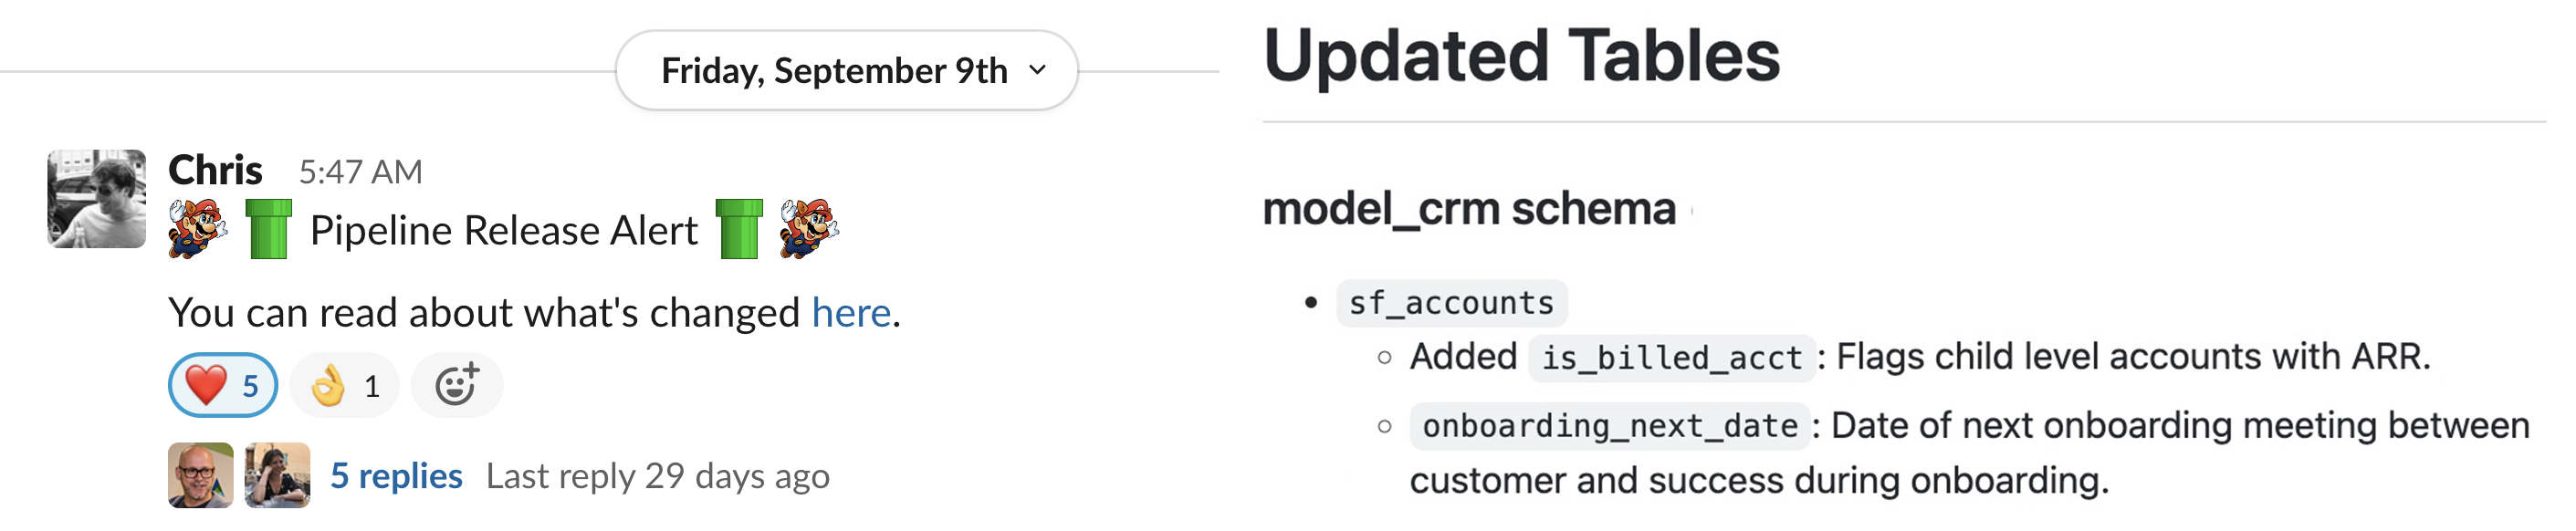
One of StarPower’s data scientists, Marion, notices the new metric when an announcement about the updated dataset is automatically posted on Slack. It’s exactly what she needs for her new funnel report, which traces the journey from sale to onboarding to customer success. Happy that she doesn’t need to reinvent the wheel, she incorporates the metric in her own pipeline. She checks the funnel pipeline into github, where it’s picked up and automatically configured to run directly after Carlos’s onboarding pipeline.
ML Engineers deploy notebooks with scalable compute
Meanwhile, Patty, an intern on the ML team, has been building some NLP models to dig into transcripts of conversations between account teams and customers. She’s investigating a hypothesis that certain topics of conversation lead to more efficient onboarding and happier outcomes, so she’s built a notebook that tags each account with topic flags. Like Carlos, she can just click on a button and her notebook is converted into an operational pipeline. Her Python code needs a little more compute power, but she’s easily able to select the “ML-Tasks” queue, which can scale up to meet the demands of her Python tasks and then shut itself down later.
Again, Marion is happy to pick up the new data, add it into her funnel analysis, and start to produce some objective measurements of what conversations lead to customer success.
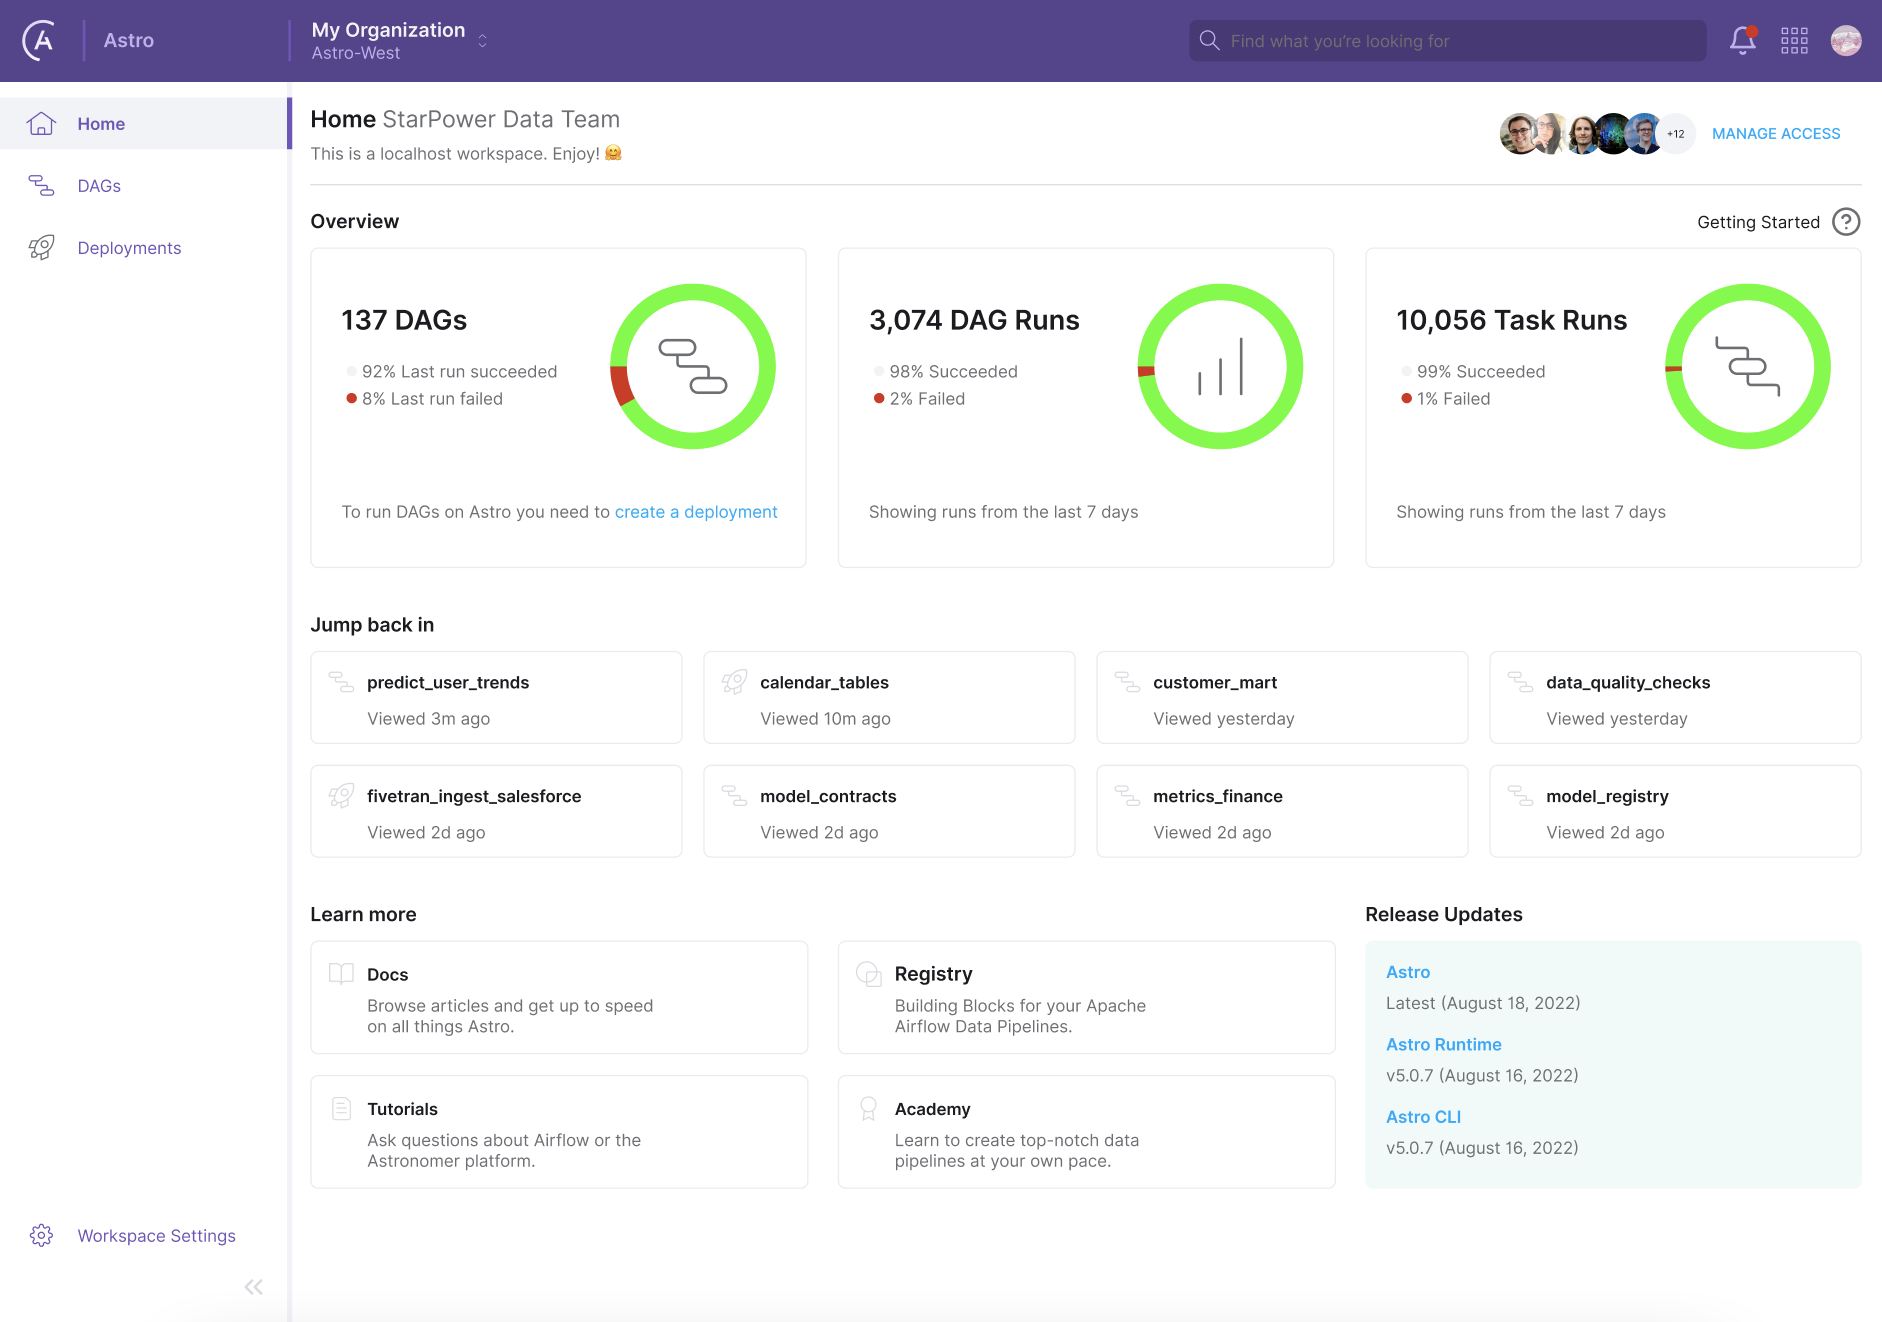
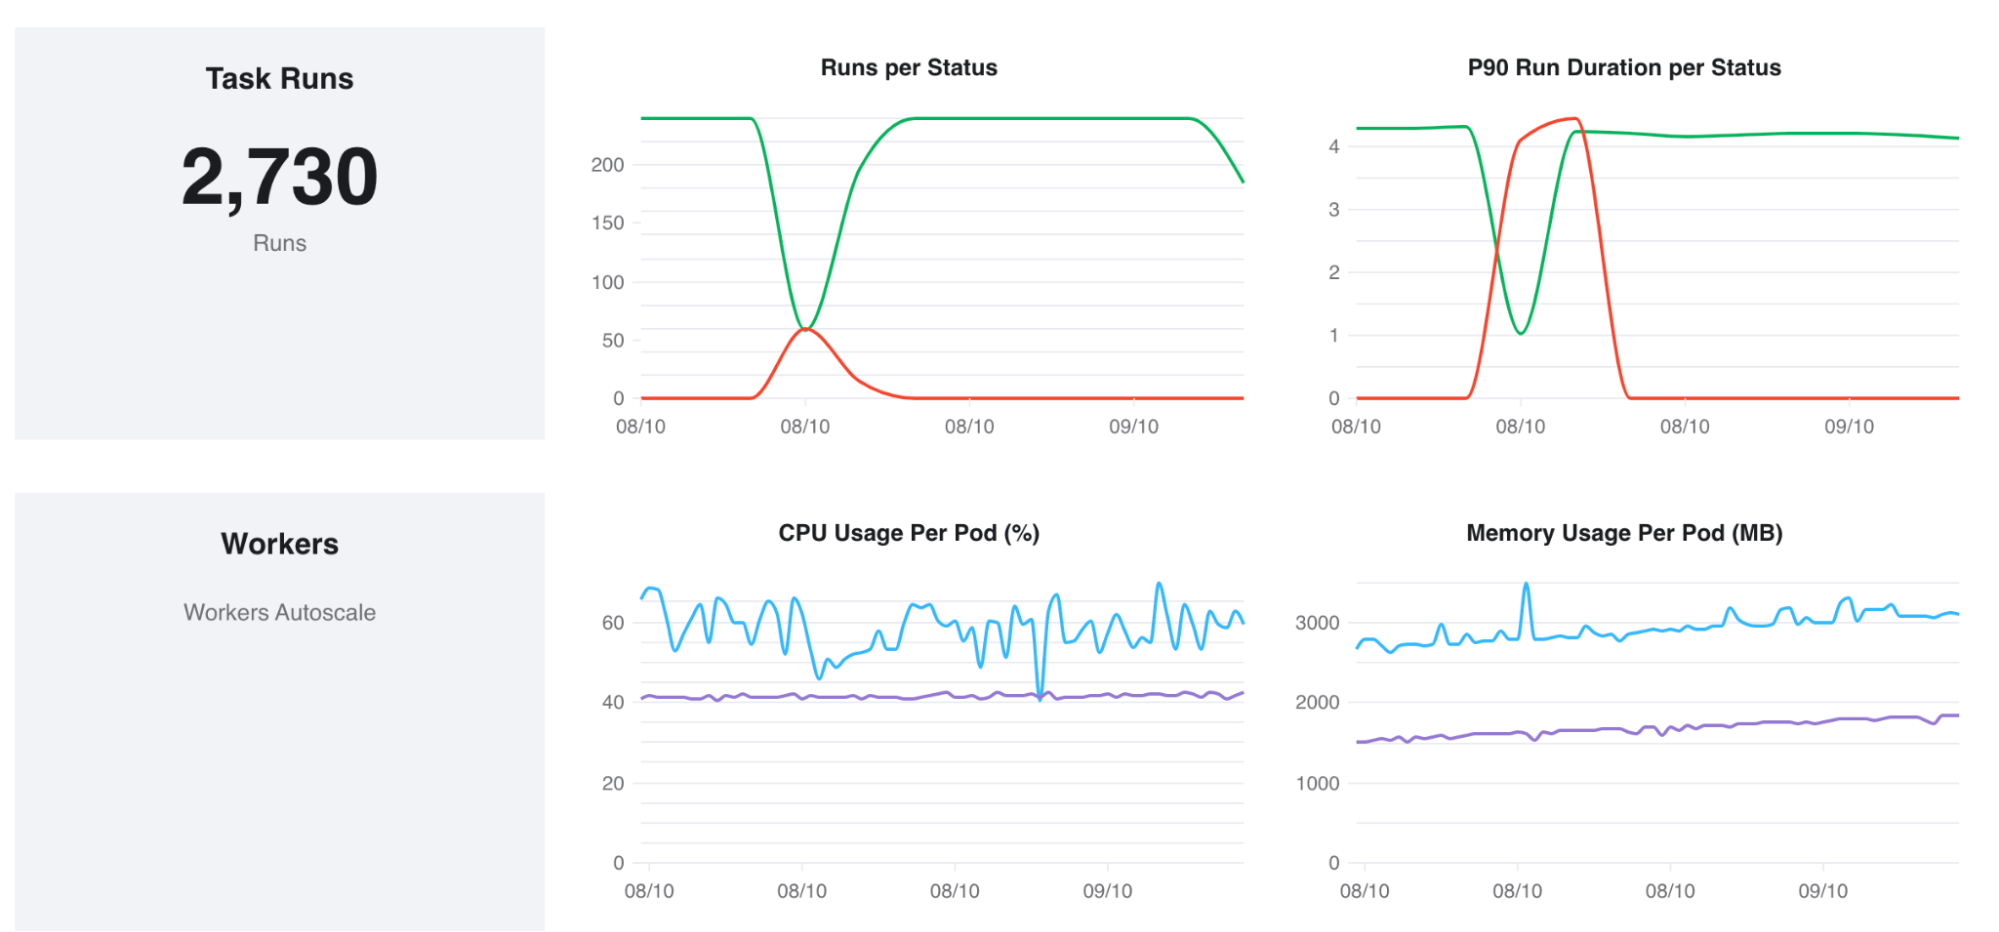
Team leads observe pipelines from a control plane
None of these people spends much time worrying about how these pipelines run. When it’s needed, there’s a section of the data team’s web portal that shows the status of all the pipelines that the organization runs, and a set of fancy-looking gauges that measure the performance of the underlying infrastructure. But it’s like a car dashboard — apart from glancing at how fast you’re going, you only really look at it when you get an alert that something’s gone wrong.
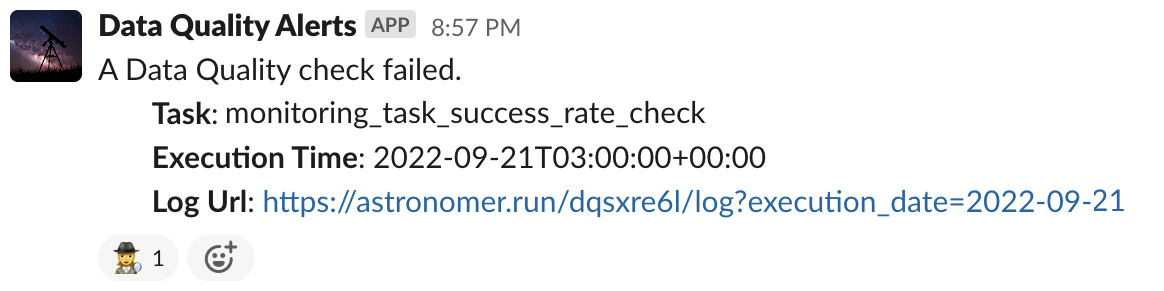
Data engineers get alerts to find and fix pipeline errors
One day, a data engineer, Tamara, gets an alert that a key metric has suddenly decreased outside the usual variation that the metric owner expected to see from day to day. It’s a count of heartbeats that StarPower receives by monitoring every one of its customer environments, and very low heartbeats are rarely a good thing. But just as Zac was able to trace the lineage of the onboarding metrics, Tamara is able to dig down to the root of the problem with a lineage graph, and discovers a minor bug in StarPower’s monitoring system, which she submits to the support team.
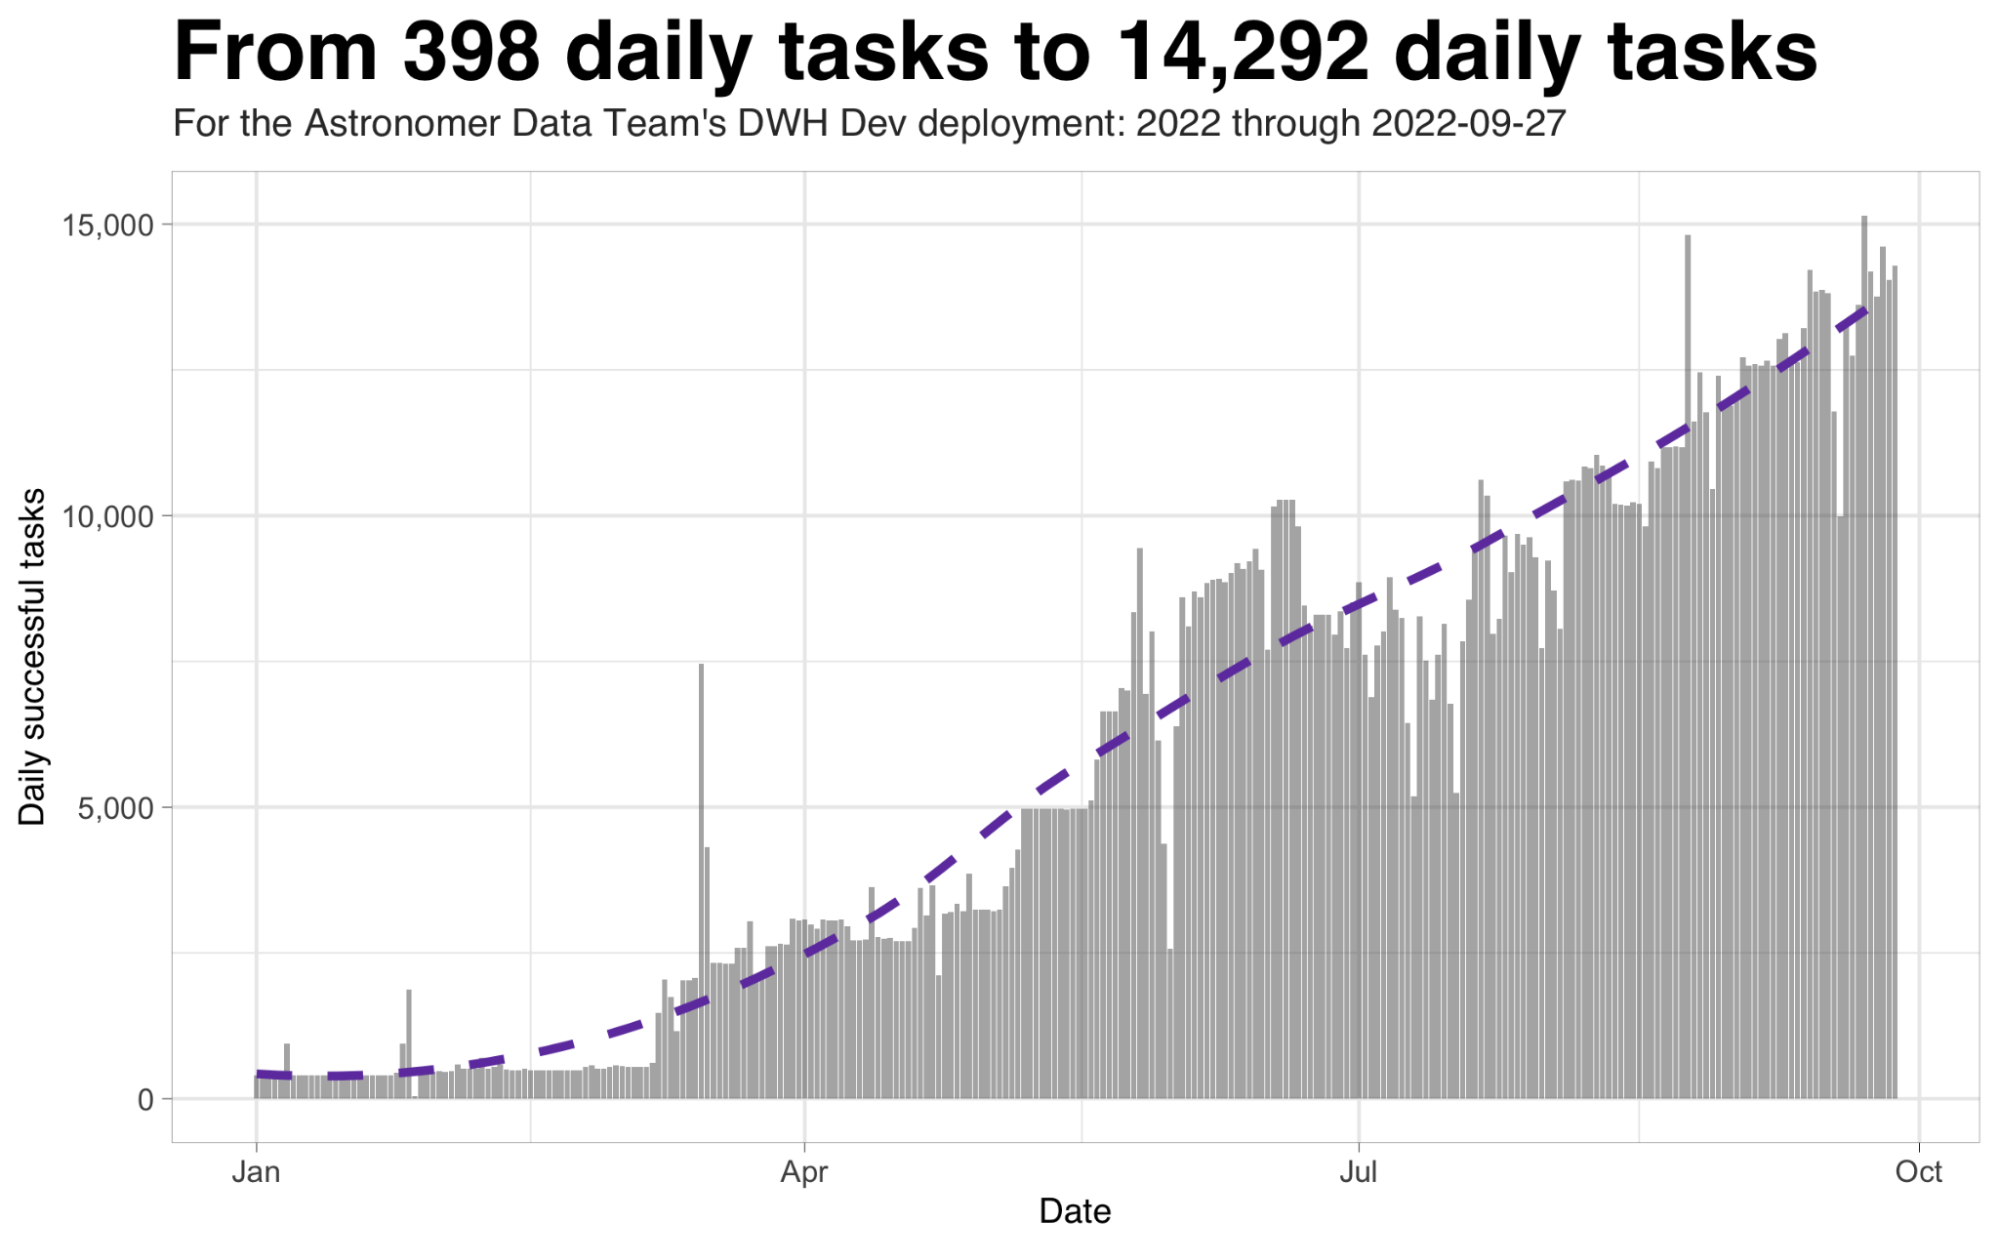
Operations are automated as much as possible
All of this happens without much intervention from the StarPower data team. The company runs hundreds of Airflow pipelines and tens of thousands of tasks a day, but most of the employees are entirely unaware of what’s at work behind the scenes, of clusters or clouds or DAGs or Docker. Besides business requirements, and the code that meets those requirements, the only things they need to worry about are documentation and testing — much of which also happens behind the scenes, with docs built into the development environment and tests auto-generated wherever possible. They do care very much about datasets, and the dependencies between them, but all the lineage is taken care of automatically and presented back to them as a real-time map of the production system.
The Power of Data Orchestration
Clearly, this situation is not too good to be true. Scenarios like the one above are not uncommon at the largest data companies in Silicon Valley, and the home-grown infrastructure that enables them is well documented by teams at Uber, Netflix, LinkedIn, and Facebook.
But at Astronomer, we’ve noticed stories like these emerging at Airflow-powered organizations, too, like VTEX and Société Générale. I want to explain how these companies got to this point, using one of them, StarPower, as my example, since I happen to know it very well.
That’s because, as you may have guessed, StarPower, Inc. is actually Astronomer. Learning from our customers, studying and imitating their best practices in aggregate, and making full use of our own Airflow-based orchestration platform, we’ve built a data ecosystem and used it to turn ourselves into a data-driven company.
Now, to be fair, my portrait of StarPower is just a little too good to be representative, in that a couple of the features used by my colleagues in the vignettes above are not yet publicly available — though they soon will be, as I’ll discuss below. But the portrait is accurate: The data team really does run tens of thousands of tasks a day — alongside other environments running millions — and the magic of Airflow is happily taken for granted, running powerfully but silently within our orchestration platform, Astro.
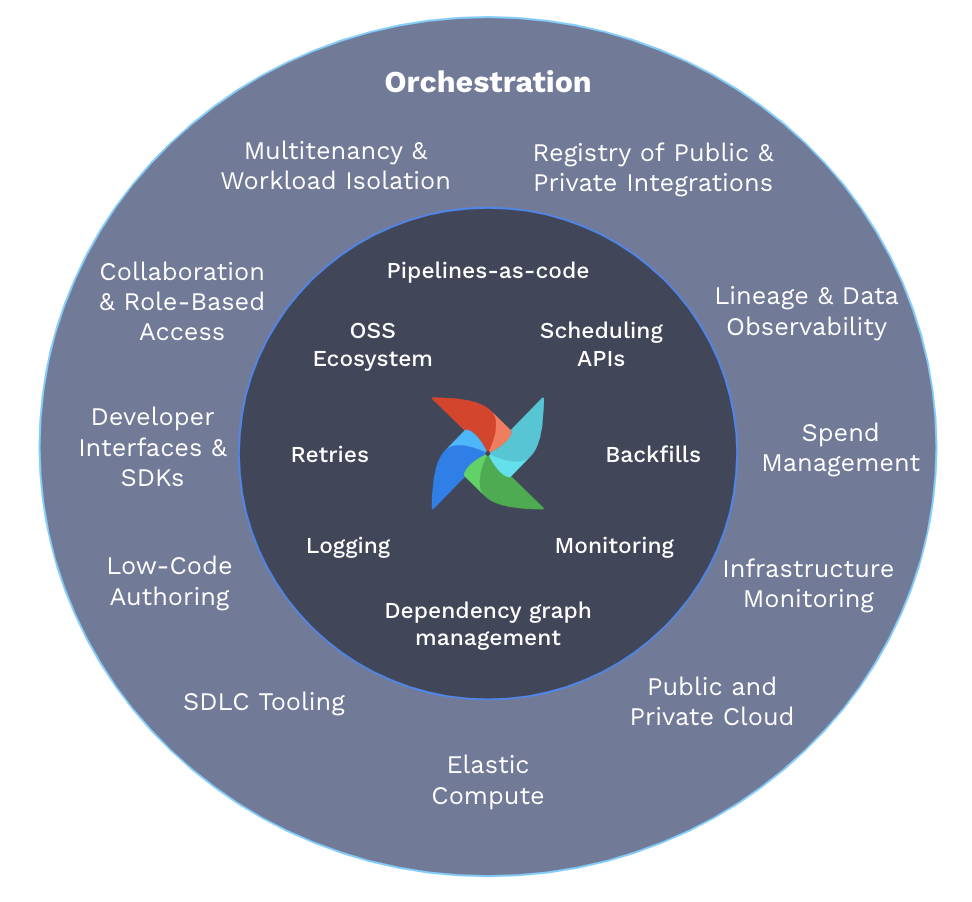
This, then, is what we mean by “orchestration”: Not just job scheduling, but a coordinated ecosystem of data pipelines, running consistently and reliably, accessible from the native tooling of the developer community, with minimal overhead between development and ops, and with full control, visibility, and governance of the resulting data orchestration.
Job scheduling is a core component of orchestration of course, but it’s far from sufficient, just as musicians and their instruments are critical to a performance but useless without a score, a conductor, and a concert hall. When I think of data orchestration, I hear the tap-tap-tap of the conductor’s baton, and the transition from chaotic noise to the opening chords of a symphony.
The Limits of Airflow
When I joined Astronomer about two years ago, I was excited for the potential of Airflow as the foundation of a new platform for doing data orchestration and ML Ops. But I was also realistic about the challenges. I’d heard about the love-hate relationship that many data engineers had with the technology, and my own early experiences backed that up. It took me a week to write my first Airflow workflow (or DAG). The lack of any notion of datasets was shocking in a system that was supposed to be all about data. The connections UI made me wonder what decade I was in. And why was it so difficult to test anything?
Still, I had confidence that the Apache project — and the OSS team at Astronomer who are so clearly devoted to it, and the 2000+ other Airflow contributors — were well on their way to fixing these things. Even in the short time since I joined, we’ve seen multiple enhancements that push Airflow in the direction of more Pythonic, dataset-oriented task authoring, including the Taskflow API, the Astro Python SDK, and data-driven scheduling. And we’ve seen an explosion in guides, integrations, and community involvement.
So yes, I’ve had full confidence in Airflow from the start. For me, what’s been much more challenging, and interesting, has been helping to build an orchestration platform around Airflow, going far beyond scheduling and workflow management to solve the fundamental problems of building a fully coordinated data ecosystem.
I’ve been running data science projects for about 20 years. Time and again, I’ve seen data teams, even those happily running Airflow, entirely cut off from one another, generating duplicate metrics with inconsistent definitions and operating with no standardization or governance, no re-use of common libraries or techniques, and minimal documentation and testing. It’s even worse with analytics and machine learning projects. Most of the teams working on those never even encounter such problems, because their work so rarely makes it into production. And when it does, it’s with jury-rigged automation, or manual conversion of hand-crafted notebooks.
Let’s take one major US bank as a representative example. Even though it had largely standardized on Airflow, distributing work across a hundred or so Airflow deployments, there was no centralized coordination of data pipelines. Machine learning was “the wild west,”, done ad hoc by individual teams. This bank came to Astronomer looking for a way to coordinate all of this, with a core set of requirements that included (1) easier ways for non-experts to author and deploy Airflow DAGs, (2) complete visibility of execution status and dependencies across all Airflow deployments, (3) mechanisms for training and validating predictive models in a clean-room setting, (4) reproducibility of all data and ML pipelines, and, across all of this, (5) transparency and governance and (6) lights-out management of infrastructure.
In many cases, when organizations turn to Astronomer for help, it’s because they’ve run up against the limits of Airflow, and they want us to help them manage it more effectively. What was different about this bank, and several other large organizations like them, is that they viewed their hundred Airflow deployments not as a problem but as an opportunity — as the pillars of a new architecture for managing their data ecosystem.
Introducing Orchestration
That’s how we think about what we’re building — a data orchestration platform, with Airflow at the center, that makes everything more manageable, accessible, and reliable.
Airflow at the center, because you can’t manage a data ecosystem, you can’t do orchestration, without controlling the execution of the data pipelines. That’s why the key ingredient is a mature, popular, full-featured job scheduler and workflow manager — and why we're deeply invested in open-source Airflow's future.
But the real power is in what can be done with this control. That’s what motivates the idea of orchestration at Astronomer.
We’ve begun by centralizing the control, so that instead of trying to handle a hundred Airflow deployments one by one, you are now able to steer data orchestration through a control plane. It’s a simple but critical time-saving change: one UI with which to bulk-manage all your data pipelines — overseeing the health of every data project through one dashboard, spinning up new deployments on auto-sizing cloud-based infrastructure, supervising role-based access to new users, viewing and diagnosing errors from one control tower.
With a control plane in place, we’re now in a position to offer a set of services that support the modern data organization. The most obvious, and perhaps the most impactful, is data lineage. I’ve always been rather skeptical about lineage, not because I doubted its utility (note all the ways lineage is used in the “StarPower” scenario above), but because it seemed like some sort of unattainable holy grail. How could any single technology possibly get its hands on every flow of data in a large and complex organization? At the lowest level, databases can easily track lineage within their own boundaries, but no further. At the highest level, BI applications have a much broader purview, but can’t go deep enough to extract full lineage graphs.
In building Astro, we’ve understood that it’s only in the middle, in the execution of data jobs themselves, that you have a chance of getting the metadata you need, and keeping it constantly up-to-date. (We also know that it’s important for an orchestration platform like Astro to take advantage of open standards so that it can peer more deeply into other schedulers for which it’s the controller. That’s why Astro adopted OpenLineage, which is also supported by technologies and platforms like dbt, Spark, Snowflake, Azure, and more, via direct integrations that take advantage of the open standard.)
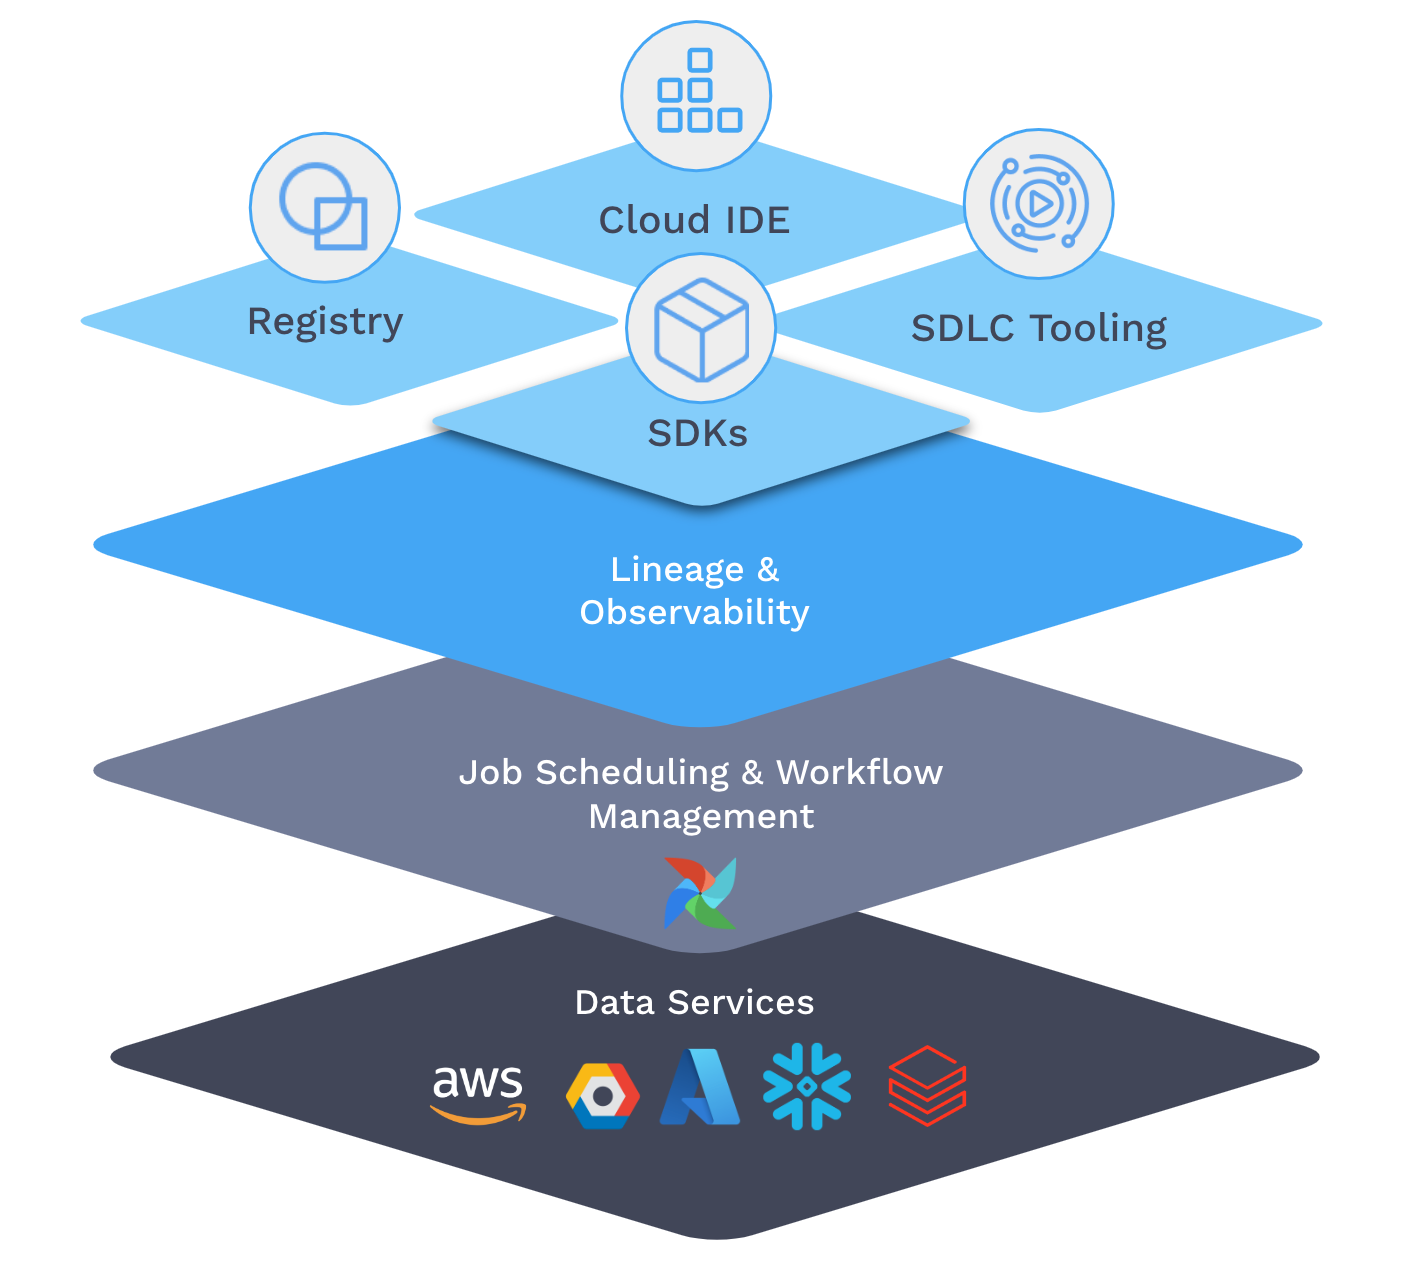
All this control and observability is great, but of limited value until you get enough people using the platform. So at the top layer of the orchestration stack, we’re providing a set of capabilities to help data practitioners easily create and schedule data pipelines, whatever their technical preferences. These include SDKs intended for specific personas, like data engineers who enjoy working with Python or analysts who prefer SQL; a notebook interface for data scientists who construct their analyses cell by cell; and a Registry — a library of utilities and integrations — available both publicly, as a collection of certified modules sourced from the community, and privately, as a way for teams to share DAGs and operators and utilities.
When an orchestration platform makes it this easy to author and manage pipelines, it becomes a natural meeting place for data teams, and the benefits of a shared ecosystem begin to emerge, not least of which are common standards for documentation and testing.
Orchestration at Astronomer
Today at StarPower…er, Astronomer…over half of the company creates and runs reports with Astro. There are more data scientists and analysts developing data pipelines outside of the core data team than within it. We have hundreds of pipelines running daily, and millions of tasks a month.
Besides all this, and the documentation, testing, lineage, and visibility that I described above, there are other, more intangible benefits to our collective reliance on Astro. By standardizing on a common platform, we get to share common utilities and functions, so that our bus factor is high. It’s as easy to create operational ETL pipelines as Python notebooks, and consequently there’s a blurred line between the work of the data scientist and the data engineer — which means that data engineers are freed up to spend more time developing high-leverage tools. Auditing and reproducibility come for free. The orchestration layer becomes a common rallying point, so teams of all kinds are less tempted to create silos of data. Debugging is much easier — “you can do the plumbing without wearing rubber gloves,” as someone said to me recently. And administrative costs are low: My team actually just donated our system administrator to another group, because, as another colleague put it, “we can manage the infrastructure in our spare time.”
In short, it’s a pleasure to work with data again.
All this has happened in less than a year. How did we do it so fast, and what are the elements of orchestration that have supported us along the way?
It helps if teams throughout an organization have already begun to standardize on Airflow. (In our case, it also didn’t hurt that we’re a relatively small company, but we’ve seen similar ramp-ups at larger organizations who’ve started with an existing set of Airflow deployments.) In any case, though, Astro’s cloud platform makes it easy to install and manage Airflow instances, and that alone increases velocity enormously, especially when infrastructure is just not a factor.
Here are 10 key aspects of Astro that together explain how we’ve achieved the smooth-running data orchestration described above in such a short time. (We’ll cover the other half of the story — how we do MLOps — in a later article. This story is long enough already!)
Cloud-based infrastructure
Astro provides a central control plane from which it’s possible to configure new Airflow deployments, and to handle upgrades and maintenance easily. That’s why I was able to move one of my headcount to another team. It’s also why we generally see a reduction in administrative costs of around $1 million for every hundred Airflow deployments, based on reductions in hourly work on cluster management, upgrades, worker queue scaling, support, troubleshooting, and training.
Collaborative workspaces
Airflow instances are managed within project workspaces, so that teams can work independently but with visibility across the organization. That’s how Carlos in Customer Success has been able to iterate rapidly on his customer success reports, but then merge them into Marion’s funnel report later.
System-Wide Observability
Our data orchestration runs mostly lights-out. We get an alert when something fails, and then the Astro homepage provides an easy way to drill into a failing pipeline, and to see a summary of the health of the cluster and the status of components like the scheduler and worker queues. When quality tests failed, it was straightforward for Tamara, the data engineer, to trace back the dependencies and understand the root cause.
Standards and Best Practices
Before opening the Astro platform up to the rest of the organization, it was important for our core data science team to have an agreed-upon set of standards for data models, DAG code, documentation, and testing. We’ve created the “Big Book of Data”, which has evolved over the year to become a rulebook for how we operationalize our analytics. These standards aren’t a feature of Astro, per se, but having a single orchestration platform makes it a lot easier to encode best practices, because there’s a common set of concepts and a common technical language.
Shared Utilities
Furthermore, an orchestration platform provides a common layer for sharing utilities that helps to enforce those standards and best practices almost automatically. For example, we have a custom Airflow “CreateTable” task group for creating new tables in our data warehouse. It requires that you specify column-level documentation, as well as a set of assertions that encode quality tests for any data that populates the table. The tests themselves come from a common set of utilities that the team has built up over time. It was one of those tests that Tamara in data engineering used to monitor numerical variance in the heartbeat metrics she was collecting. And it’s this custom task group that enables very high coverage in our data dictionary, which Zac from IT can use to dig into the meaning of the fields in the report that he ran.
Simplified Authoring
With all of this in place, the data team felt ready to invite others to work in and contribute through Astro. But not everyone is a trained Airflow developer, even at Astronomer. So one of our priorities was to create new interfaces for building DAGs.
First came the Astro Python SDK, a collection of decorated Python functions that makes it much easier to convert everyday Python and SQL into Airflow DAGs, with minimal exposure to Airflow-specific constructs. It’s also one of the features that makes it easier to handle datasets in Airflow now — to share them among tasks and DAGs, and, increasingly, to abstract away the entire notion of a dataset (dataframes, tables, files, etc.) as compute platforms become commodified. (Just by changing a connection, we can switch from one warehouse to another, or even rebuild the entire warehouse overnight.)
In many cases, developers just want to check Python or SQL files into github, and stay clear of Airflow. A common pattern has emerged, with teams creating frameworks for assembling Airflow DAGs from collections of code files. At Astronomer we’ve used gusty, and there’s also dag-factory, and of course Airflow is frequently used in conjunction with dbt.
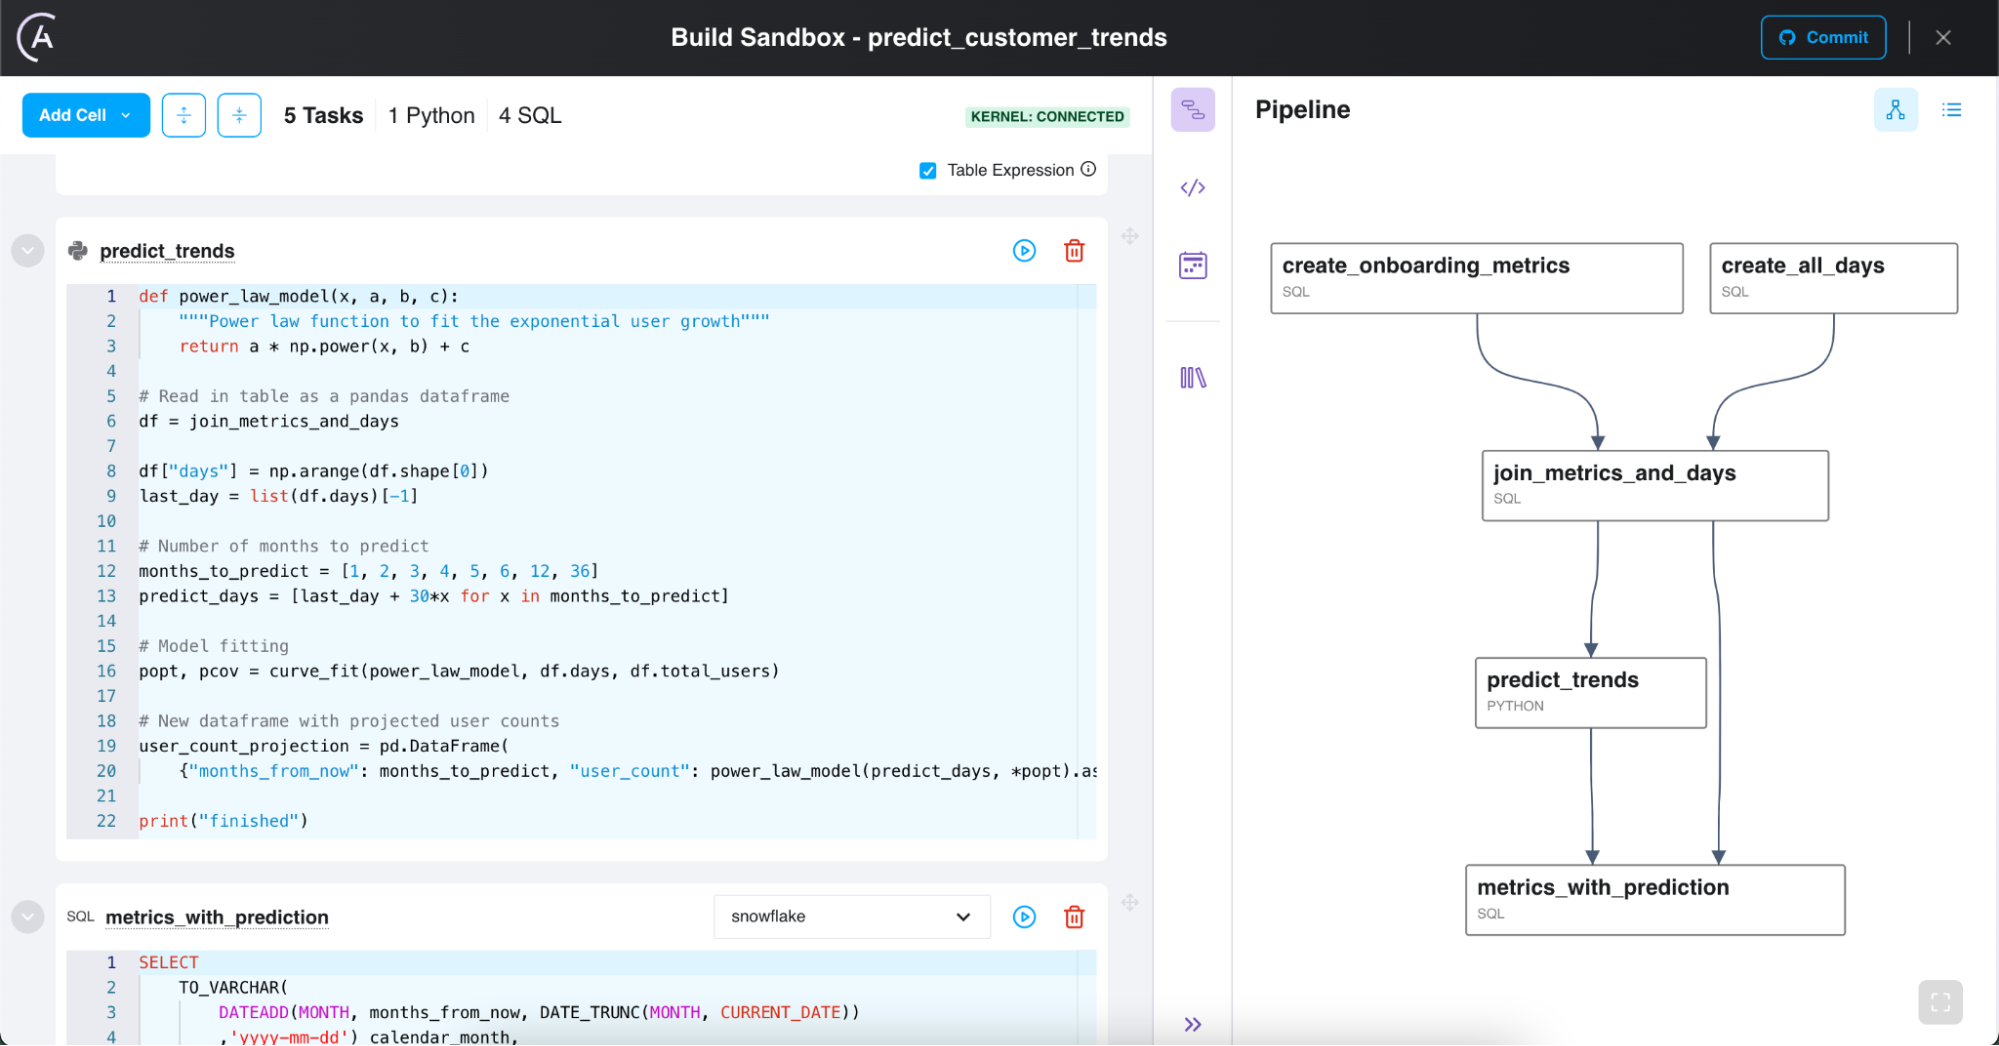
Many analysts and data scientists are more comfortable working in a notebook environment, coding and executing small chunks of Python and SQL code with rapid feedback, and with no local setup required. Hence Astro’s Cloud IDE, a notebook-inspired interface for creating pipelines scheduled for release this fall, which I like to think of as a hand-off point between the data scientist and the data orchestration team. The Cloud IDE has the structure of a web-based notebook, but it encourages the statelessness that’s important in an operational pipeline by maintaining a level of isolation between cells — while still permitting the passing of datasets. And the IDE supports SQL as well as Python, within the same notebook, so Python cells can refer to the output of SQL cells, and tables magically become dataframes, and vice versa. Moreover, the IDE will share the database connections used by the Airflow deployment, which really streamlines the handover process.
For us, the gap between dev and ops is getting very narrow. The frameworks above are the fundamental reason we’ve been able to build out a large number of pipelines and reports very quickly, and to incorporate work from Carlos and from other teams. The paradox is that we’ve reduced the role that hands-on engagement with Airflow plays in our development, even while ramping up the amount of work it does by two orders of magnitude.
Software Development Lifecycle (SDLC) Tooling
Whichever method our data folks use to develop their pipelines, it’s integrated into our CI/CD pipeline, which deploys DAGs to development and production instances of Airflow. Whether you’re checking code into github directly, or committing pipelines developed in the Cloud IDE, the CI/CD scripts effectively handle the mapping between feature branches and Airflow deployments (including their associated connections). That means that the process of promoting pipelines from development into test or production is automated. As soon as developers get their calculations approved and their code reviewed, it’s all moved into the production environment (production Airflow, production warehouse) without further effort.
Registry
Connecting to third-party systems is made a lot easier by using trusted providers. For most elements of the modern data stack, there’s usually an integration with Airflow, and a sample DAG to show how it works, thanks to the community of Airflow developers. So to run our queries on Snowflake — or any other database — we only need to find the right provider and add it to the list of requirements. Same for creating Tamara’s Slack notifications, ingesting new data for Customer Success with Fivetran, and so on.
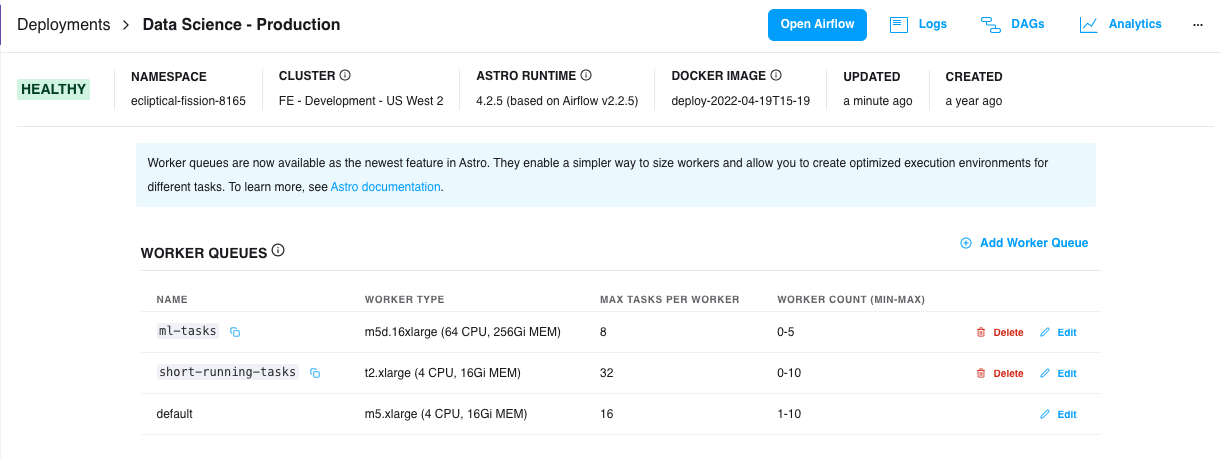
Optimized compute
With worker queues, a new feature in Astro this year, you can create optimized execution environments for different types of tasks, which is how Patty has been able to run her NLP jobs with extra memory. For a given worker queue, our admins configure the size and type of its workers to determine how much CPU and memory tasks can consume and to manage auto-scaling. With that, Patty can simply direct her tasks to the appropriate queue.
Data Lineage
Integrating with OpenLineage was a big deal for Airflow and Astronomer, but until recently my team didn’t have a ton of time to set it up. But as our pipelines and ecosystem grew in size and complexity, it became an obvious omission. For the sort of troubleshooting that Zac and Tamara are doing, it’s essential. So I gave my team a deadline of the end of the year for getting lineage enabled for all our datasets. As it turned out, it took no time at all — someone flipped the switch, and when I refreshed the graph the next morning, I saw that glorious star-map of our data constellations.
The point is that the Lineage component of Astro is able to listen in on existing tasks and queries, and knit the graph together in the background. It can also index the names and comments attached to tables and fields so that, combined with the utilities I mentioned above for documentation, the graph becomes a living data dictionary, sourced from the ground truth that is the code itself.
Summary
To be sure, there’s more work for us to do. The private version of our Registry is still under development. Astro’s Cloud IDE is still a few weeks out from reaching public preview. But the core components of our orchestration platform — all the details in the last section, and the features described there — are in place right now.
What we’re aiming for at Astronomer, for ourselves and our customers, is a platform for orchestrating data pipelines that is so easy to work with, it becomes magnetic. As a data team, we get to offer an easy quid pro quo to our colleagues: Hey, just plug your scripts in here, follow these simple rules, and in return we'll provide you with the connections, the compute, the scheduling, error handling, quality controls, and, above all, access to data.
The price of admission is low, and the benefits are clear. An orchestration platform transforms Airflow into an asset that your entire company uses, to publish and consume data that drives the critical decisions your business makes. And as everyone joins in, there is literally a network effect — a discoverable, well-managed network of data that binds a business together.

Get started free.
OR
By proceeding you agree to our Privacy Policy, our Website Terms and to receive emails from Astronomer.