How to Keep Data Quality in Check with Airflow
17 min read |
How do you know when you can trust your data? Your dashboards? The predictions from your machine learning (ML) models? Data confidence starts with data quality checks running continuously.
As you might expect, at Astronomer we use Airflow — powered by Astro — as the heart of our data platform. A growing number of Airflow DAGs orchestrate the movement of our data from ingestion sources through our Snowflake warehouse to, ultimately, dashboards that serve the whole organization, providing the basis for customer insights and other key metrics about our business.
In a recent blog post, we described the elements of a data-driven company — a thinly disguised Astronomer — including the need for data engineers to receive timely alerts when data errors occur. Data quality is an essential element of our development cycle, with checks running within and alongside our pipelines every day. In this article, we’ll dive deeper into our current data quality setup, sharing the journey we’ve taken as an example for implementing your own data quality checks using Airflow.
Why We Care about Data Quality
Bad data is generated by all sorts of events, from innocuous schema changes to outages of external tools.
At Astronomer, we realized: The question is not if bad data will make it into our pipeline, it’s when.
Without data quality checks in place, data quality issues will either surface downstream, for example in a dashboard, or worse, they’ll go unnoticed and adversely impact decision making!
Let’s look at a real-life example.
One day, before data quality checks were implemented at Astronomer, we noticed a significant drop in unique users and daily sessions on the Astronomer Registry when reviewing an internal dashboard.
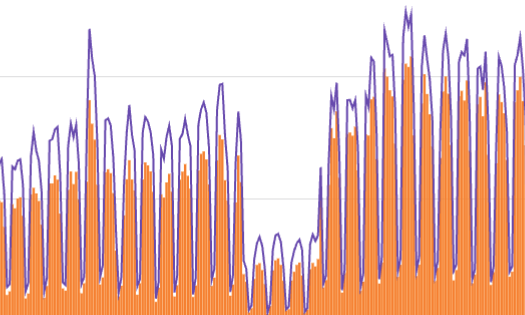
Figure 1: Screenshot from a dashboard showing daily web traffic with a significant drop and then a return to normal after four weeks.
After investigating, we found the cause: the tool we used to track web traffic had changed its output. Once we switched to a different tool, the dashboard went back to showing actual sessions and users.
A data quality check for an unusually high drop in unique users per week would have allowed us to catch the change earlier and alert stakeholders that the dashboard no longer showed accurate information.
Many data practitioners have encountered charts like this, or received that dreaded email from a stakeholder about a broken data product. Data quality is the key to reducing these kinds of downstream failures, and it’s also something you can start implementing in your own Airflow setup today.
How We Think About Data Quality
At Astronomer, we believe that data quality doesn’t come from just writing good tests, it comes from the right development process. While a data quality journey is highly individual and iterative for each organization, getting to the right development process always includes answering a few core questions:
- How will we architect the data quality implementation?
- What rules will determine which checks get written?
- Which data quality tools are the best fit for our data quality needs?
- How do we want to be alerted of potential data quality issues?
- Which data quality checks should halt the pipeline upon failure?
- What requirements must our data meet to be deemed of good quality?
After careful consideration and discussion of these questions, the Astronomer data team arrived at a set of requirements that our internal data quality architecture had to fulfill:
- All notifications about data not meeting its quality criteria should be accessible to the whole data team in a central place.
- Data quality checks should run once every day on tables that are updated daily.
- It should be possible to add data quality checks, especially experimental ones, without changing existing DAGs.
- Data quality checks that have proven their usefulness in an experimental context should be turned into templates that can easily be used on any table. These check templates should be integrated into our own custom table-creation framework, to be used on both existing and new tables by all members of the data team.
Using these requirements, we implemented an architecture with two components:
Component 1: Standalone Data-Quality DAG
The first part of the architecture is a standalone data-quality DAG containing checks running on a high-impact pipeline. These checks are dependent on the upstream operations that, once per day, update the Snowflake tables that are being checked; therefore they run once per day after the Snowflake tables have been updated, as per requirement No. 2 of our architecture (above). Failed checks produce alert messages in Slack, addressing requirement No. 1.
The dependencies between the checks are created to mirror the dependencies of the tables in the database. This allows selective rerunning of a set of downstream checks. For example, if a data issue is found in an ingestion table and subsequently fixed, the checks running on data derived from this table can be manually rerun.
Starting the data quality journey with a standalone DAG allows for adding data quality checks and observing their behavior over time, since existing DAGs do not have to be changed, fulfilling requirement No. 3 of our architecture. The standalone DAG can easily be turned on and off as a whole in the development and production environment, to troubleshoot experimental data quality checks. Using this DAG, it’s also possible to define data quality checks that need information from several tables.
Component 2: Integrated Checks During Table Creation
Integrated data quality checks are included in the table-creation step of our existing pipelines. Checks that are possible to define using the SQLColumnCheckOperator and the SQLTableCheckOperator, and that had proven their usefulness while implemented in the standalone data quality DAG, were templated and moved to the table-creation step, as laid out in requirement No. 4 of our architecture.
We decided that only a few core checks ensuring the integrity of primary keys should automatically halt the pipeline. A failure of one of those checks would indicate that our data was seriously compromised and should not move forward to downstream processes.
When deciding if a specific data quality check should halt the pipeline, we asked the question: Would the data product be worse if it were updated with bad data, or would it be worse if it were not updated at all?
All other data quality checks in both components of our implementation were set up to not stop the pipeline, but rather to alert the data team using Airflow’s callback functionality to send messages to a Slack channel.
Designing Data Quality Checks
With a clear plan for our data quality architecture, we were ready to choose a data quality tool and design our checks.
We implement most of our checks using the SQLColumnCheckOperator and SQLTableCheckOperator from the Common SQL provider, which had its initial release in July 2022. These two operators cover almost all checks we need, don’t require installation of any other tool, and provide full lineage support in OpenLineage.
In the rare cases when we need custom checks not fitting the above operators, like checks involving several tables, we use the Airflow-native SQLCheckOperator.
Our data quality checks fall into two categories:
Integrity Checks
These are straightforward checks on the basic integrity of our data. A failed check in this category shows a data quality issue obvious to any data professional. These checks ensure:
- No NULL values occurred in certain columns. For example, it wouldn’t make sense to have a NULL value in an is_active_deployment column.
- Timestamps were in logical bounds. For example, no logged run of a customer’s DAG can have a timestamp in the future.
- Counts – such as the number of tasks run on a day – were never negative.
Checks Informed by Domain Knowledge
Other data quality checks require domain knowledge or are based on previously discovered data quality issues. For example:
- Knowing that in the past an ingestion bug had caused inactive customers to show active deployments listed in our database, we created a check to make sure that if a customer is marked as inactive, all their deployments are as well.
- Knowing the minimum and maximum settings for schedulers and workers on the Astro platform, we created minimum and maximum bounds for these values in our data.
With the list of data quality checks ready to go, it was time to put it all together.
Data Quality Checks with a Dedicated Data Quality DAG
As noted above, we defined many of our data quality checks within a standalone DAG. To ensure that the checks in this DAG would run only after the tables had been updated, we scheduled it using the Datasets feature introduced in Airflow 2.4.
It quickly became obvious that structuring the DAG to group the individual data quality checks would greatly improve the readability of both the DAG graph and code. This is a great use case for nested task groups, which allow us to visually group tasks, both at the table level and schema level, in the Airflow UI.
Our DAG is structured with an outer loop creating one TaskGroup per Snowflake schema and an inner loop creating another TaskGroup for every table within that schema. Dependencies are set using a custom set_dependencies() function that’s explained in more detail below.
At a high level, this resulted in the following structure:
 with DAG(...):
  for schema in schemas:
   with TaskGroup(...) as schema_tg:
    table_objects = {}
    for table in tables:
     with TaskGroup(...) as table_tg:
      [check definitions]
     table_objects[table] = table_tg
    set_dependencies(...)
Check Definitions
The tasks defining data quality checks are created in two nested loops. The outer loop contains the outer TaskGroup, which gets instantiated with the group_id of the schema name and retrieves the tables object from the schema object imported from the /includes folder. The table_objects dictionary that will collect the table-level TaskGroup objects is created here as well.
for schema in schemas:

    with TaskGroup(
        group_id=schema
    ) as schema_tg:

        tables = schemas[schema]["tables"]
        table_objects = {}
Within that schema-level TaskGroup, the inner loop creates the table-level TaskGroup with a group_id of the table name. We are able to use the default_args parameter of this TaskGroup to pass the connection ID to our Snowflake database and the trigger rule all_done to all checks within, making sure all checks always run, even if upstream checks failed.
        for table in tables:

            with TaskGroup(
                group_id=table,
                default_args={
                    "conn_id": "snowflake_conn",
                    "trigger_rule": "all_done"
                }
            ) as table_tg:
Within the inner TaskGroup, both integrity checks and checks requiring domain knowledge were defined by instantiating a varied number of tasks using the SQLColumnCheckOperator, the SQLTableCheckOperator, and the SQLCheckOperator.
While the specific checks varied for every table, the general order of the checks was as follows:
- A
SQLCheckOperatorto make sure the schema has not changed, using a custom check calledTABLE_SCHEMA_CHECK. If the schema does change, the table’s checks might need an update and a manual re-run afterwards, which is made easy by having this upstream schema check in place. - A
SQLColumnCheckOperatorcontaining all individual column checks on that table and aSQLTableCheckOperatorcontaining all table-level checks on that table. - Additional checks requiring domain knowledge that were not possible to define using the operators from the Common SQL provider package were added with one or more
SQLCheckOperators.
                # check if there were any changes to the table schema
                schema_change_check = SQLCheckOperator(
                    task_id="schema_change_check",
                    sql=TABLE_SCHEMA_CHECK,
                    params={
                        "db_to_query": db_to_query,
                        "schema": schema,
                        "table": table,
                        "col_list": tables[table]["col_list"]
                    }
                )

                # run a list of checks on individual columns
                column_checks = SQLColumnCheckOperator(
                    task_id="column_checks",
                    table=f"{db_to_query}.{schema}.{table}",
                    column_mapping=tables[table]["column_mapping"]
                )

                # run a list of checks on the whole SQL table
                table_checks = SQLTableCheckOperator(
                    task_id="table_checks",
                    table=f"{db_to_query}.{schema}.{table}",
                    checks=tables[table]["table_checks"]
                )

                # set dependencies of the checks
                schema_change_check >> [column_checks, table_checks]

                # if defined create custom checks
                if tables[table]["custom_checks"]:
                    custom_checks = tables[table]["custom_checks"]
                    for custom_check in custom_checks:
                        custom_check_task = SQLCheckOperator(
                            task_id="custom_check_task",
                            sql=custom_checks[custom_check]["sql"],
                            params=custom_checks[custom_check]["params"]
                        )

                        schema_change_check >> custom_check_task

                table_objects[table] = table_tg
The table-level configurations, including checks written in dictionary format (SQLColumnCheckOperator and SQLTableCheckOperator) or SQL (SQLCheckOperator), are stored in a Python module that we import from a file in the /include directory.
Check definitions passed to the SQLColumnCheckOperator and the SQLTableCheckOperator are defined as dictionaries. For example, for a small table containing upgrade counts for deployments, table[column_mapping] contained three checks on the UPGRADE_COUNT column. Two checks were integrity checks making sure the count was never negative or zero, while the maximum count of 50 was informed by domain knowledge. The dictionary passed to the column_mapping parameter was the following:
 {
  "UPGRADE_COUNT": {
   "min": {"geq_to": 0},
   "max": {"leq_to": 50},
   "null_check": {"equal_to": 0}
  }
 }
By looping over this template, we fully covered one of our target high-impact pipelines using four schemas containing 40 tables in the first iteration. We also laid the groundwork for adding checks for additional tables and improving on existing checks in the future.
Using a Custom Function to Set Dependencies between Table-Level Task Groups
We need to codify the dependencies in our data tables so that our data quality checks can be manually rerun on dependent tables, if the need arises. To accomplish this we created a custom set_dependencies() function. This function takes in a dictionary of all table-level TaskGroup objects (each containing data quality checks relating to one table) and a dictionary defining the dependencies between those task groups for each schema.
The dictionary defining the dependencies is structured so that every table in the schema corresponds to a key. Each key-value pair maps an upstream table to its downstream tables.
definition_of_dependencies = {
 "table_1": ["table_2","table_3"],
 "table_2": [],
 "table_3": ["table_4"],
 "table_4": []
}
The set_dependencies() function is called at the end of each outer schema-level loop, and creates dependencies by using the information in the definition_of_dependencies dictionary to retrieve the table-level TaskGroup objects in the table_objects dictionary. The last line of the function uses bitshift operators (>>) to set the dependency between the task groups, which is syntax specific to Airflow:
def set_dependencies(table_objects, definition_of_dependencies):
 for up, down in definition_of_dependencies.items():
  if down:
   for downstream_table in down:
    table_objects[up] >> table_objects[downstream_table]
Below you can see how the table-level task groups within a single schema depend on each other.
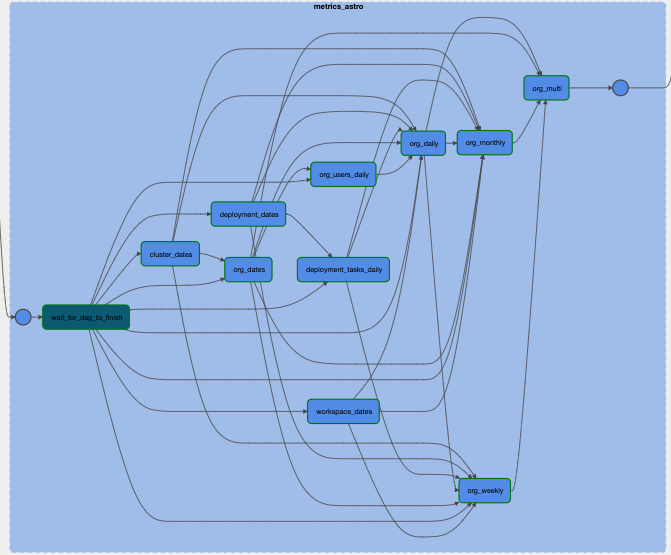
Figure 2: Airflow UI Graph view of one TaskGroup of the standalone data quality DAG. This TaskGroup contains all checks running on tables within one schema. Each node in the graph is another, nested TaskGroup containing checks running on one table in this schema.
Increased Data Quality Observability, Thanks to Data Lineage
The SQLColumnCheckOperator and SQLTableCheckOperator are designed to send lineage information to OpenLineage, which can be viewed in the Astro Lineage UI. On Astro, full observability into check failures is directly available from the lineage tab.
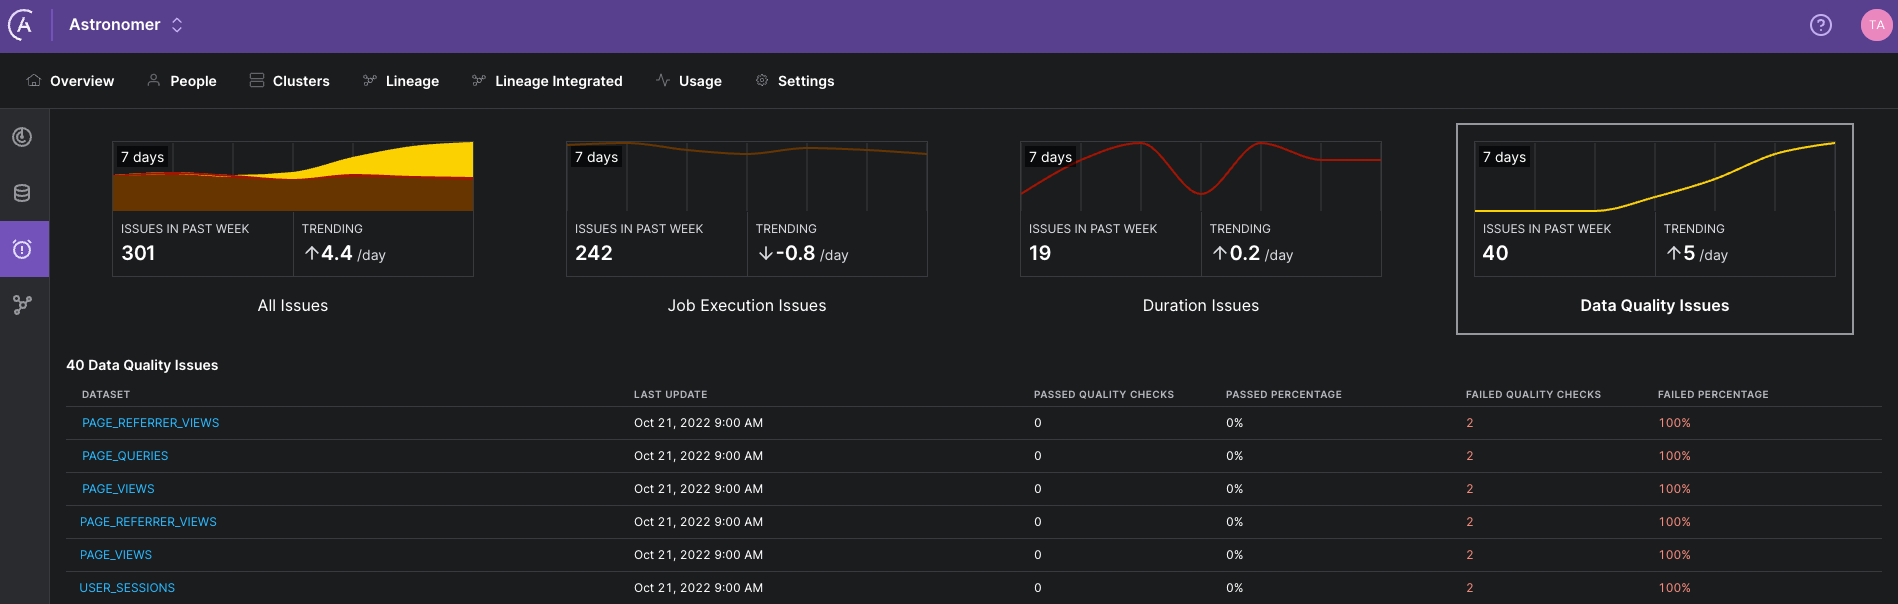
Figure 3: Astro UI Issues view of the lineage tab in the Astro UI, showing the results of recent data quality checks. You can see which checks failed and investigate recent trends.
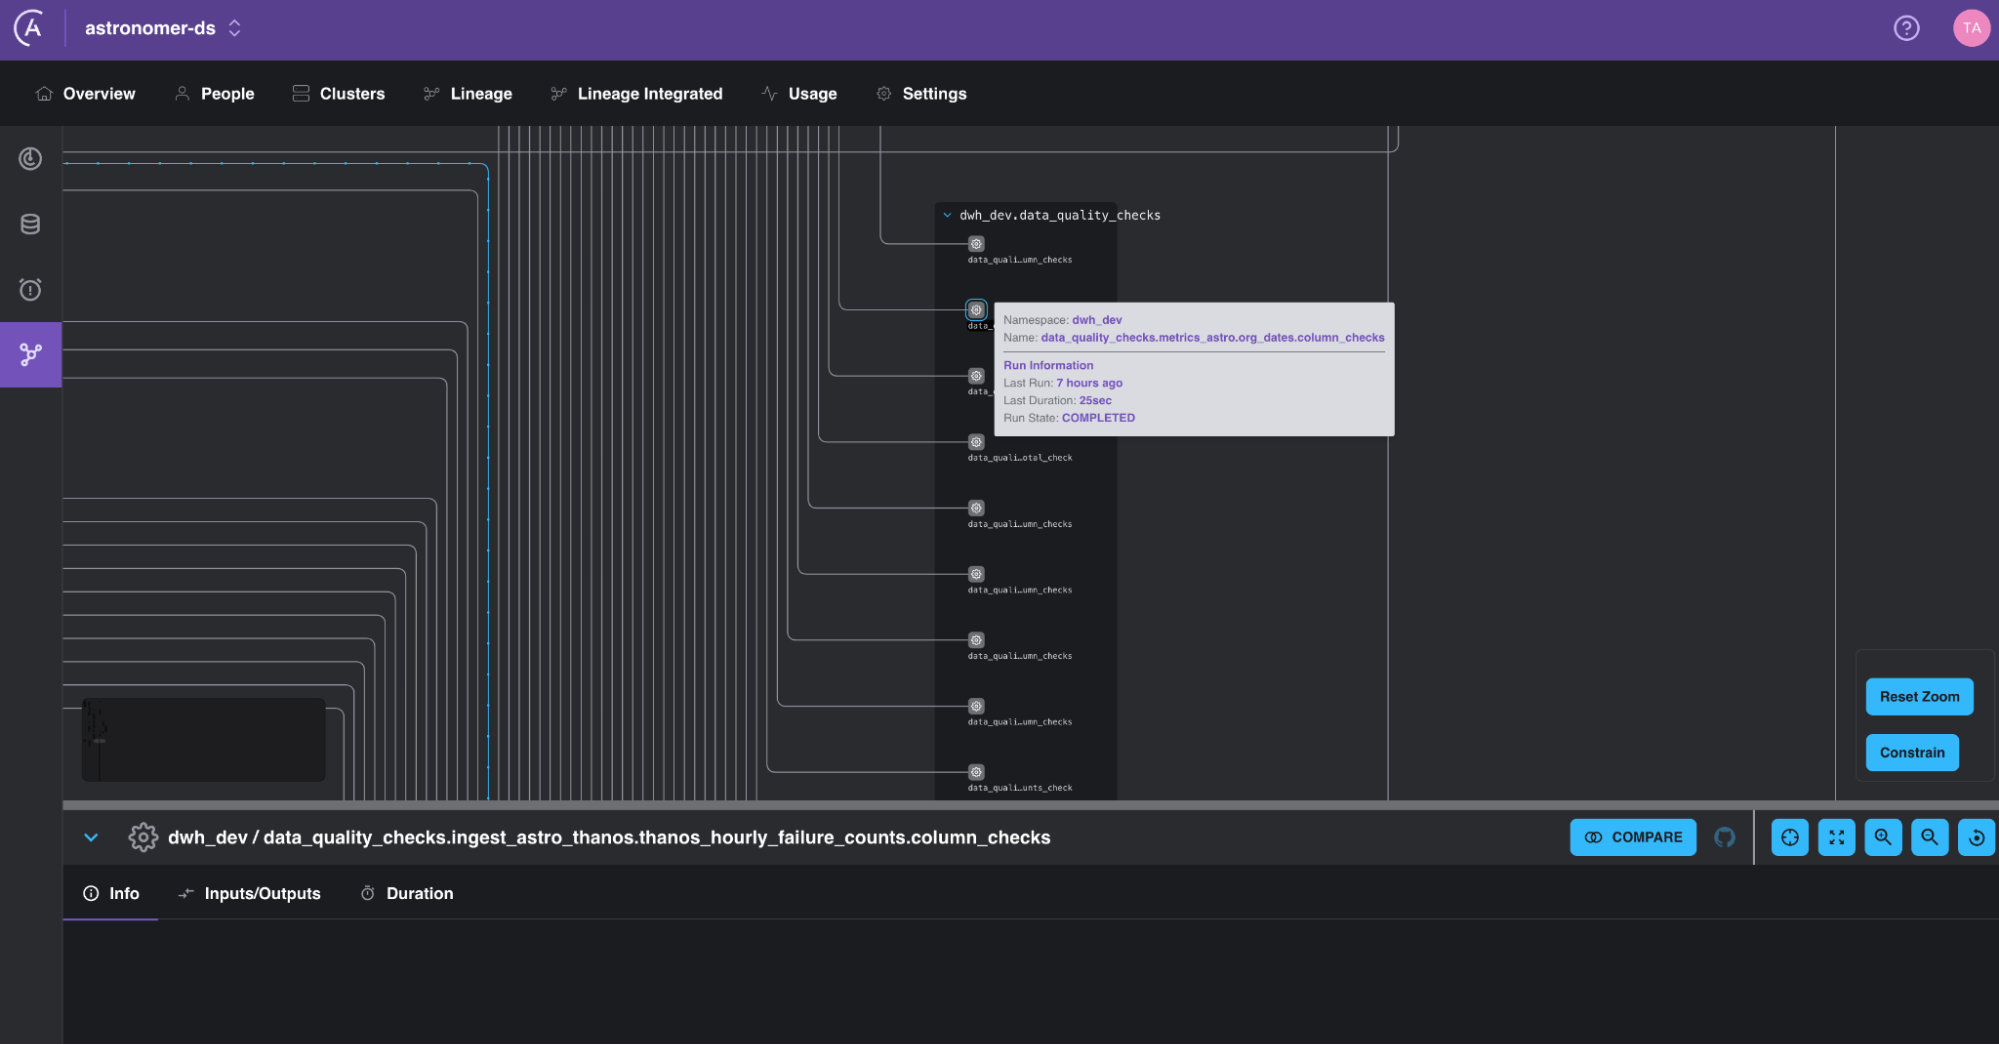
Figure 4: Small section of the lineage graph of Astronomer’s internal data showing how data quality checks using the SQLColumnCheckOperator and the SQLTableCheckOperator automatically appear in the lineage graph.
Integrated Data Quality Checks
After the data quality checks in the standalone DAG started to run — and successfully alerted us to several data quality issues — we knew we were ready to implement the second component of our data quality architecture: adding templated data quality checks to a custom TaskGroup.
We use a custom CreateTable TaskGroup to create new tables in our data warehouse that are fully documented and tested. Any member of the data team who wants to create a new table in a DAG can simply provide the table definition and a few extra configurations to the CreateTable TaskGroup, and it will take care of defining all the tasks shown in the screenshot below (Figure 5). It’s the ideal place to add integrated data quality checks!
Having proof-of-concept and proof-of-usefulness for our data quality checks, we created templates for common checks, designed to make it as easy as possible to add data quality checks to existing and newly defined tables.
The YAML configuration below is creating four data quality checks in a table containing information about our customers’ clusters. First, an integrity check is performed, making sure the CLUSTER_NAME and CREATED_TS columns are never NULL. Next, two checks requiring domain knowledge are defined: the TEMPLATE_VERSION_MAJOR column needs to be between 2 and 20, and the CLOUD_PROVIDER column can only contain the strings aws, gcp, or azure.
check_null:

 - CLUSTER_NAME
 - CREATED_TS
check_sql_cols:
 - TEMPLATE_VERSION_MAJOR: {min: {geq_to: 2}, max: {leq_to: 20}}
check_condition:
 - CLOUD_PROVIDER IN ('aws', 'gcp', 'azure')
Integrating checks directly into our pipelines this way allowed us to slim down the data quality DAG to eventually contain only checks that cannot be defined using the SQLColumnCheckOperator and the SQLTableCheckOperator.
In Figure 5 (below), you can see how our tables are created:
- The
create_tmptask creates a temporary table. - The
test_tmptask group contains checks that, if they fail, would halt the entire pipeline. In the example below, they all run using one SQLColumnCheckOperator. We mostly check for completeness and uniqueness of primary key columns in this task. - The
validatetask group contains all non-halting data quality checks running on the table that was created. In the example below, these checks are defined using one SQLColumnCheckOperator and one SQLTableCheckOperator. - The
sql_check_donetask is created using the EmptyOperator and set to always run even if its upstream tasks fail. Thanks to this task, data quality check failures in thetest_colsandtest_tabletasks within thevalidateTaskGroup do not cause the pipeline to halt.
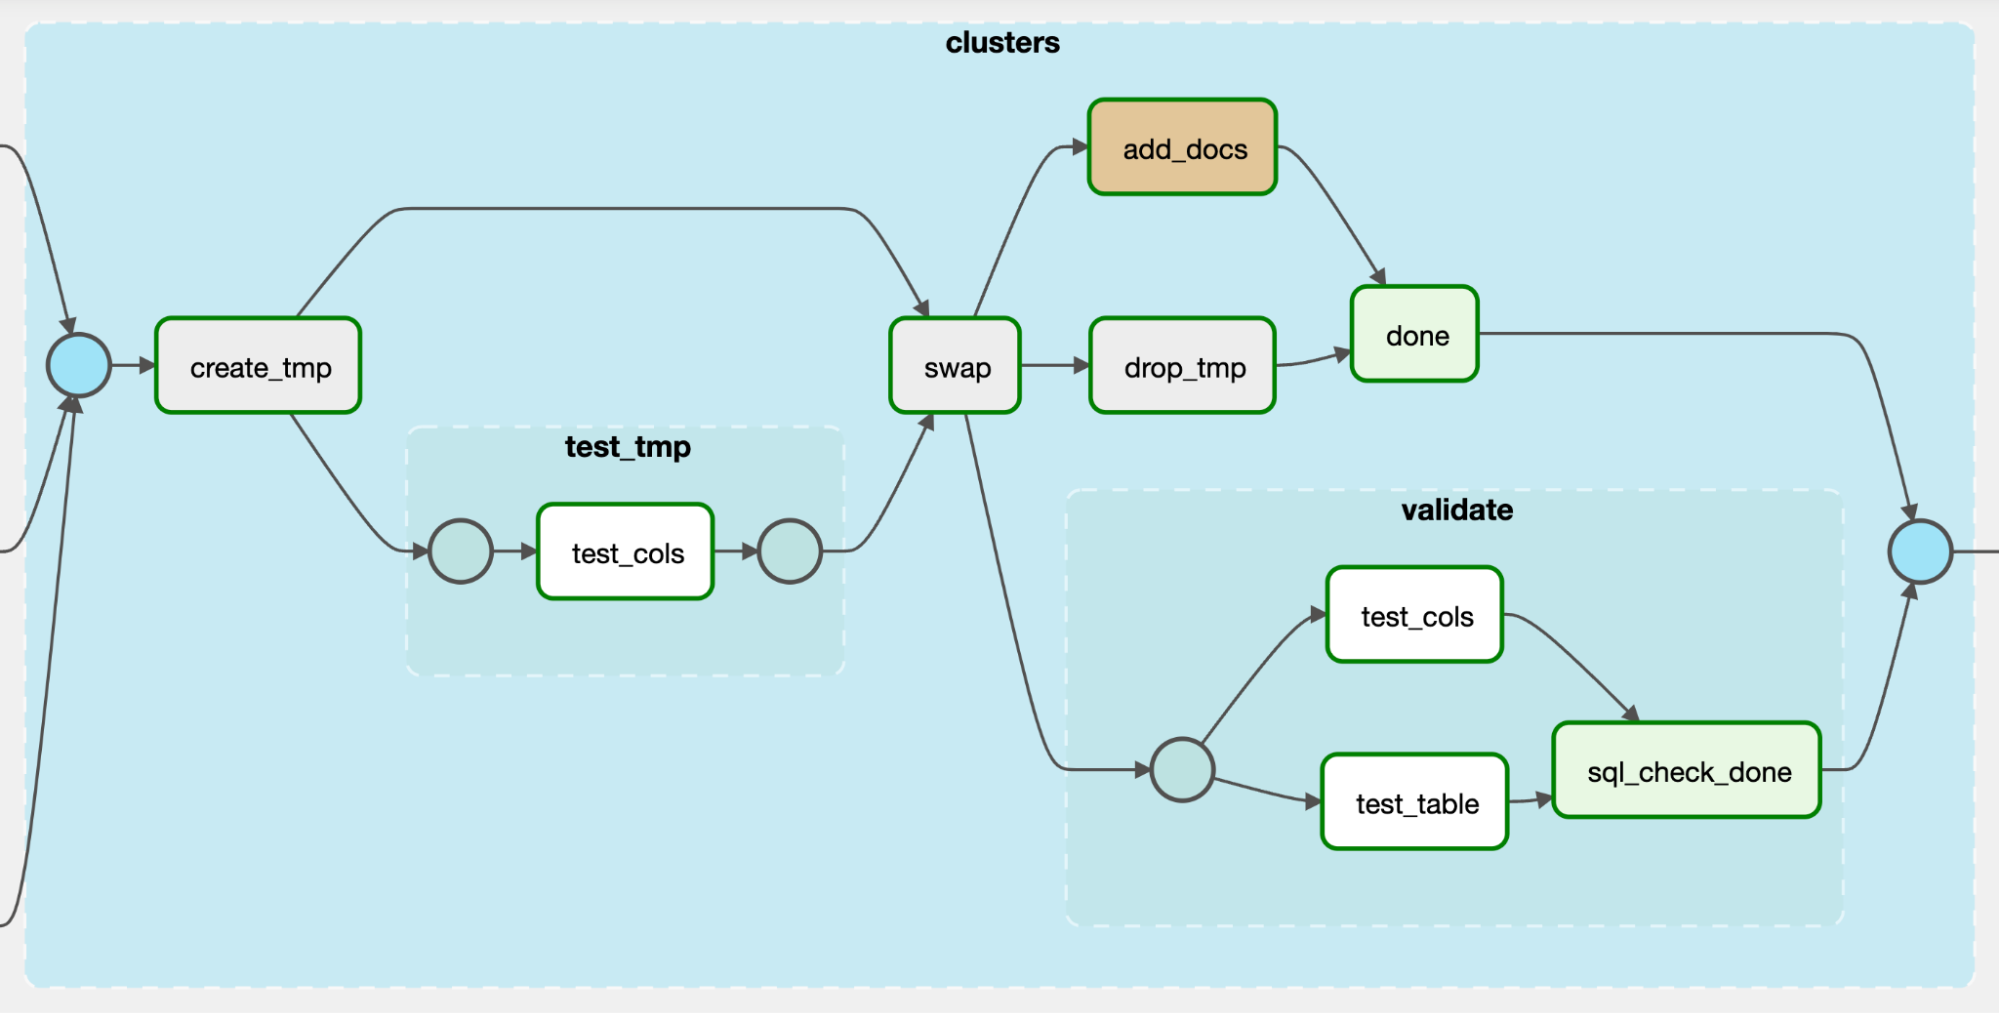
Figure 5: Graph view of the structure of our custom CreateTable TaskGroup.
Reusable task groups are a staple of Astronomer’s internal data architecture. You can learn more about how to set them up.
A Data Quality Issue Detected and Solved
With so many checks active, it was only a matter of time until one failed.
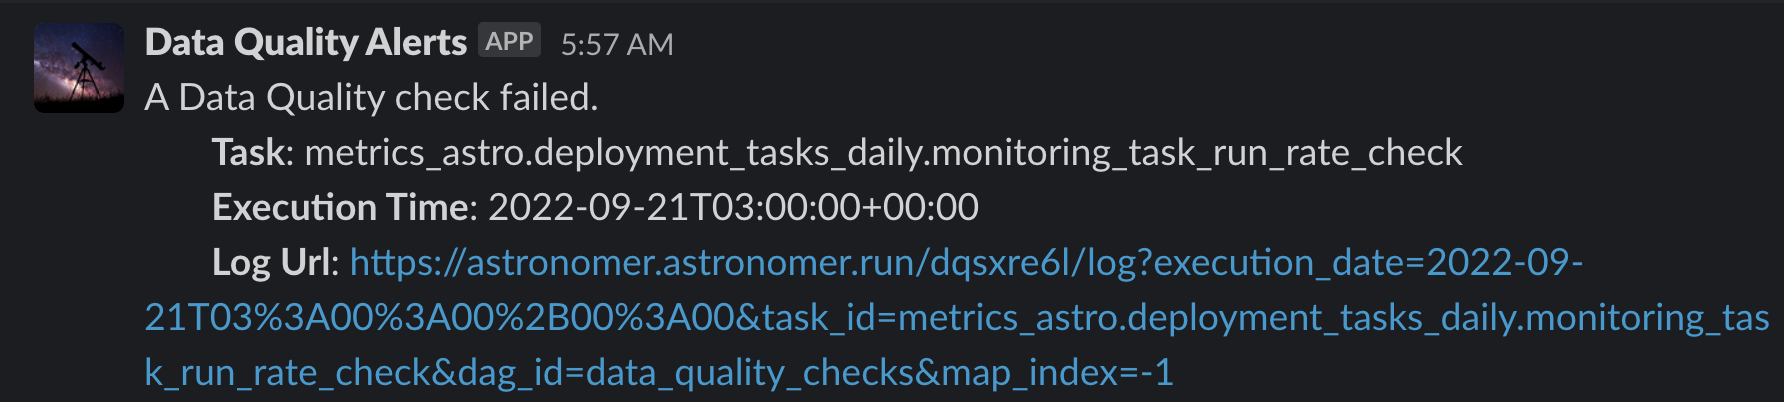
Figure 6: Screenshot of a Slack message alerting the data team that a data quality check failed. The alert includes the name of the checking task, the execution time, and a link to the check logs.
One morning we were greeted by three failed data quality checks, each related to monitoring task metrics. A bit of domain knowledge is needed to understand what happened here. On Astro, every active deployment runs a monitoring task every five minutes to confirm the health of the deployment. If the task runs every five minutes, the maximum number of daily monitoring tasks per deployment should be 288. The data quality checks alerted us that several deployments had exceeded that limit.
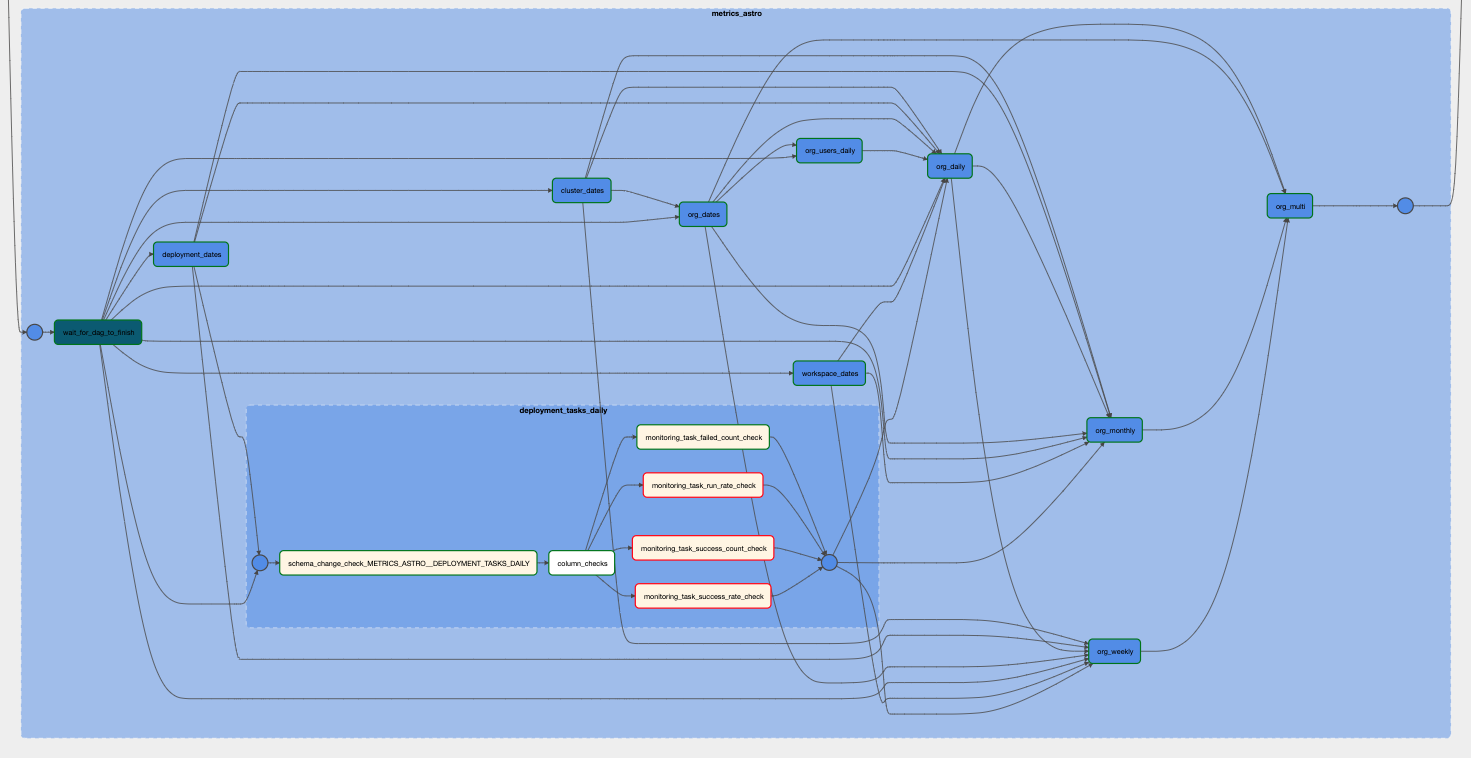
Figure 7: Graph view of part of the standalone data quality DAG with a nested TaskGroup containing checks on the deployment_tasks_daily table expanded. Within the nested TaskGroup, three checks are shown as failed.
What happened? A small change in the open source Airflow log format caused the ingestion framework used in our pipelines to miscount monitoring tasks. Fortunately, the issue was quickly resolved.
Having data quality checks in place allowed us to immediately be aware of the data quality issue, collaborate among several teams to find the root cause, and confirm that the issue was fixed.
Conclusion
To achieve effective data quality, your organization needs to iteratively integrate data quality processes into both your data architecture and your pipeline development cycle. Data quality checks should then consistently monitor your data pipelines and produce alerts your data team can act on. As we’ve learned here at Astronomer, implementing the right checks with the right process rewards you with trust in your models and dashboards.
We aim to be at the forefront of data quality innovation, and we’re excited to share our journey through upcoming content on data quality approaches and frameworks.

Get started free.
OR
By proceeding you agree to our Privacy Policy, our Website Terms and to receive emails from Astronomer.