How to use blueprint on Astro to write Apache Airflow® Dags in a no-code interface
How to use blueprint on Astro to write Apache Airflow® Dags in a no-code interface
Preview
The no-code UI for Blueprint on Astro is in Preview.Blueprint on Astro lets you build data pipelines from templates provided by your data engineering team. You browse the template library, configure each template using form fields, and connect them into a pipeline through a drag-and-drop interface in the Astro IDE.
This tutorial walks you through exploring the blueprint onboarding project and adding a new ETL pipeline consisting of three templates in order to aggregate moon-merch sales revenue. No knowledge of Airflow or Python is required.
Step 1a: Sign up for a free trial of Astro
If you don’t have an Astro account yet, sign up for a free trial of Astro, which gives access to the Astro IDE, including the blueprint interface. If you already have an Astro account, skip to Step 1b.
- In the onboarding flow, after giving your Organization and Workspace names, select Start with a template.
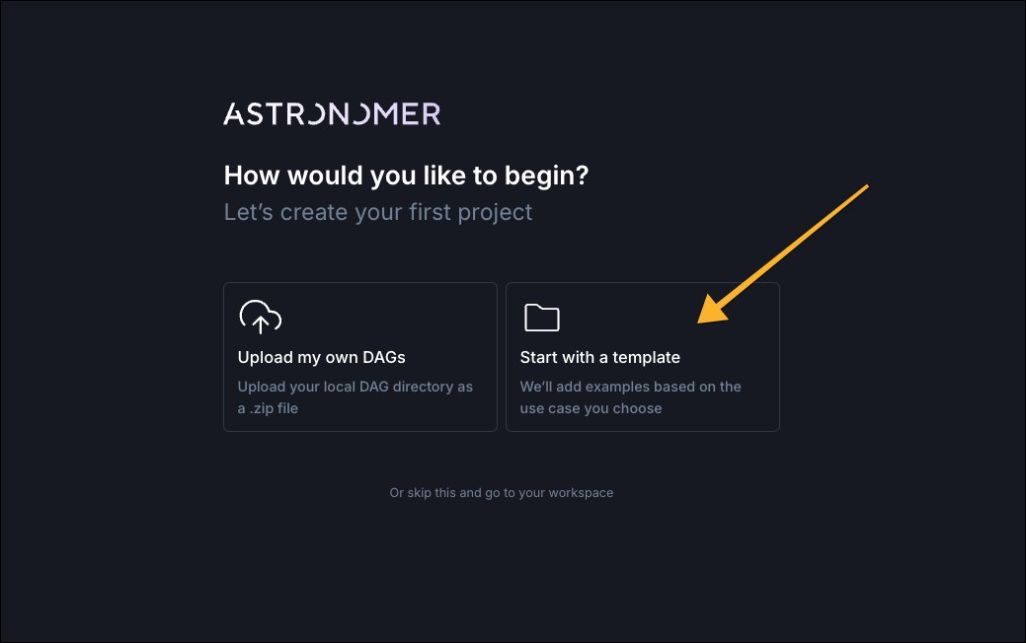
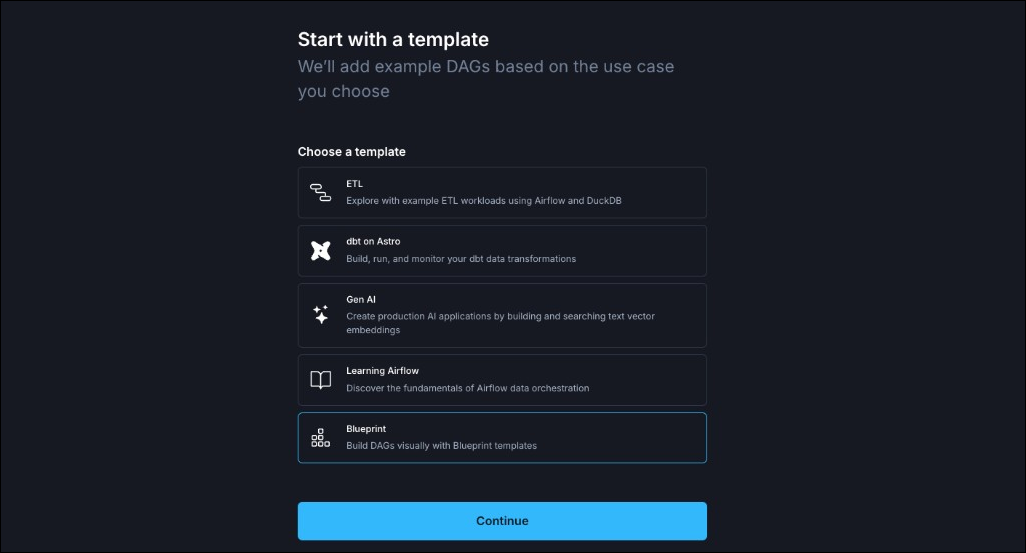
- Choose the Blueprint template and click Continue.
You enter the Astro IDE where the Blueprint tab opens the no-code interface to define your pipeline. Continue with Step 2.
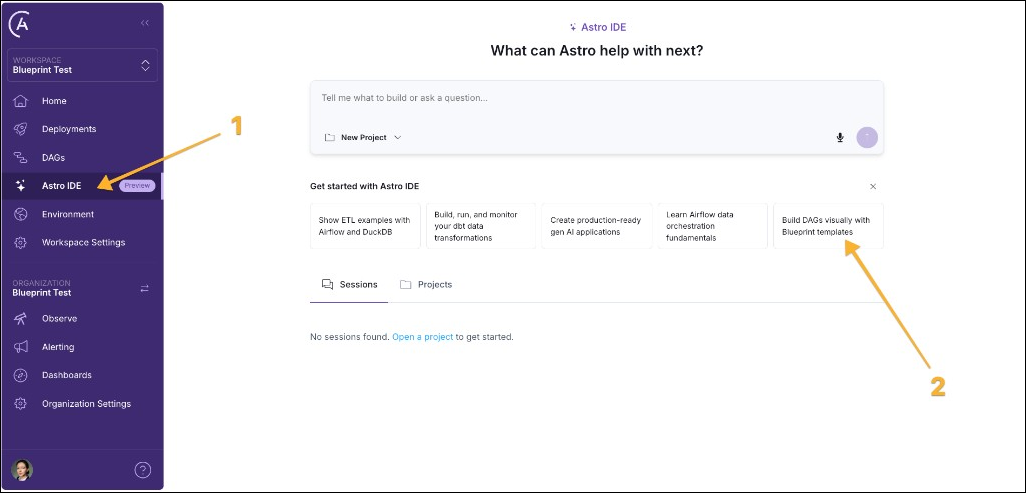
Step 1b: Add the tutorial project to the Astro IDE
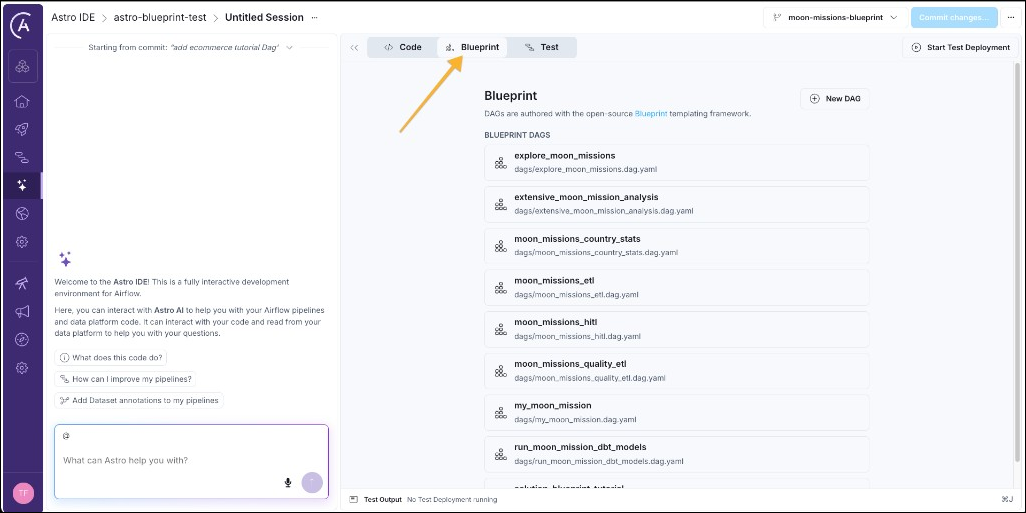
If you already have an Astro account, you can add the blueprint tutorial project by navigating to the Astro IDE (1) and then clicking Build DAGs visually with Blueprint templates.
Step 2: Explore an existing blueprint pipeline
There are eight pre-existing pipelines in the onboarding project, each using one or more of 11 blueprint templates to accomplish different data engineering tasks.
- Click one of the existing pipelines, for example
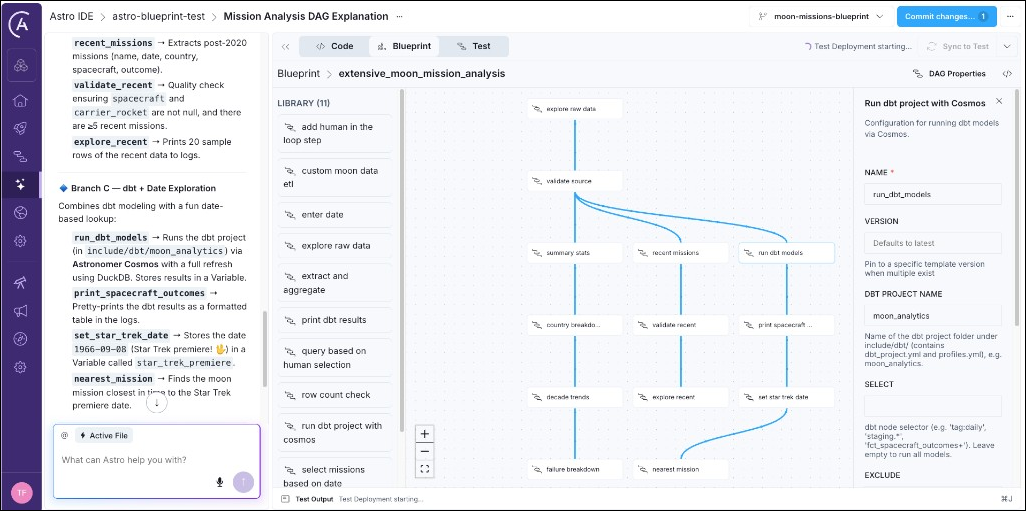
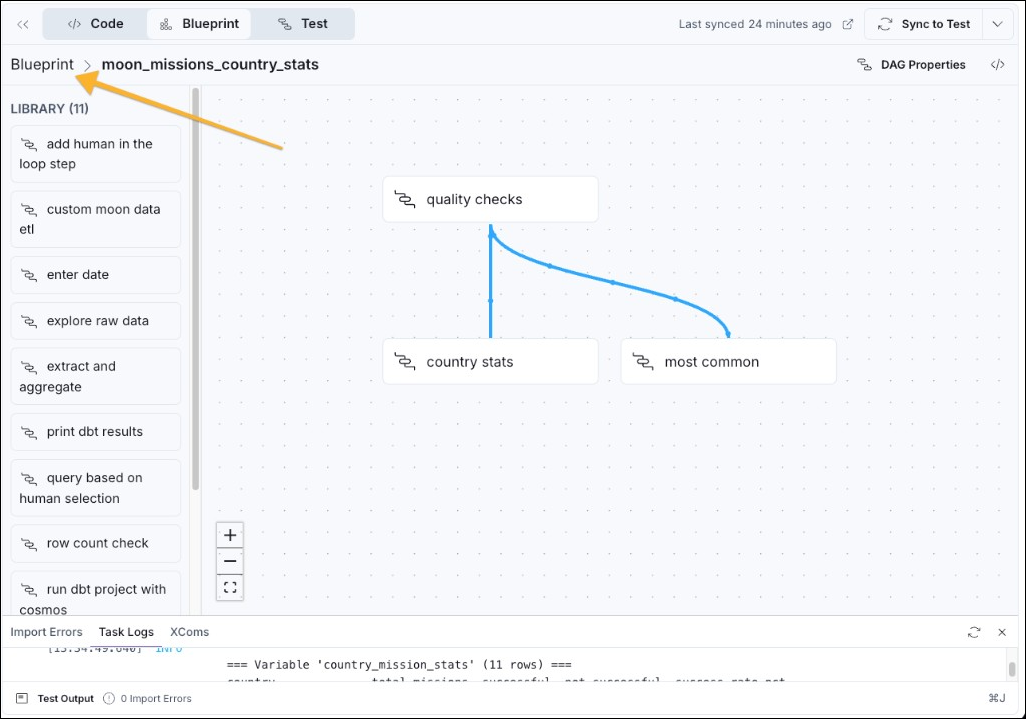
moon_missions_country_statsto open the drag-and-drop view, which shows you the library of blueprint templates (1), the workflow graph (2), and the DAG Properties button (3) to modify the schedule (4) on which the pipeline should run.
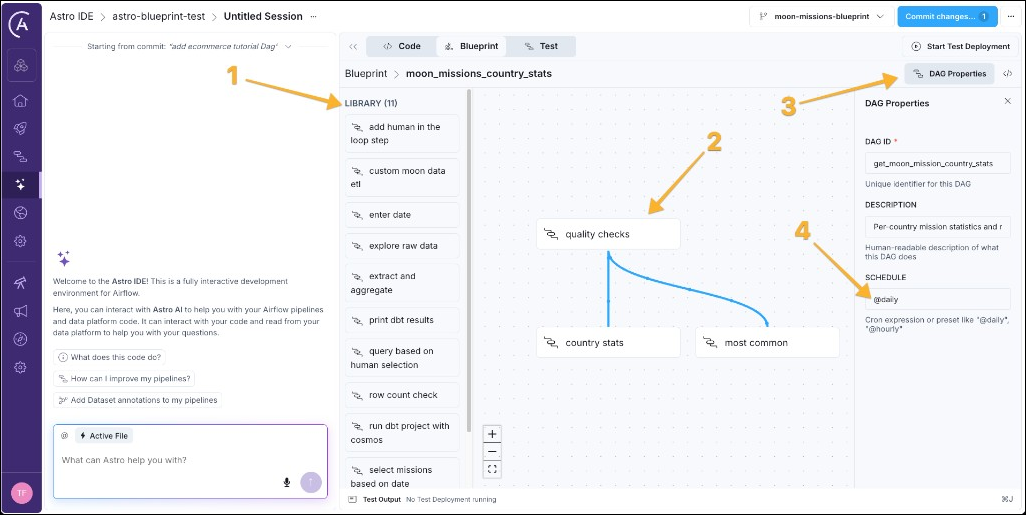
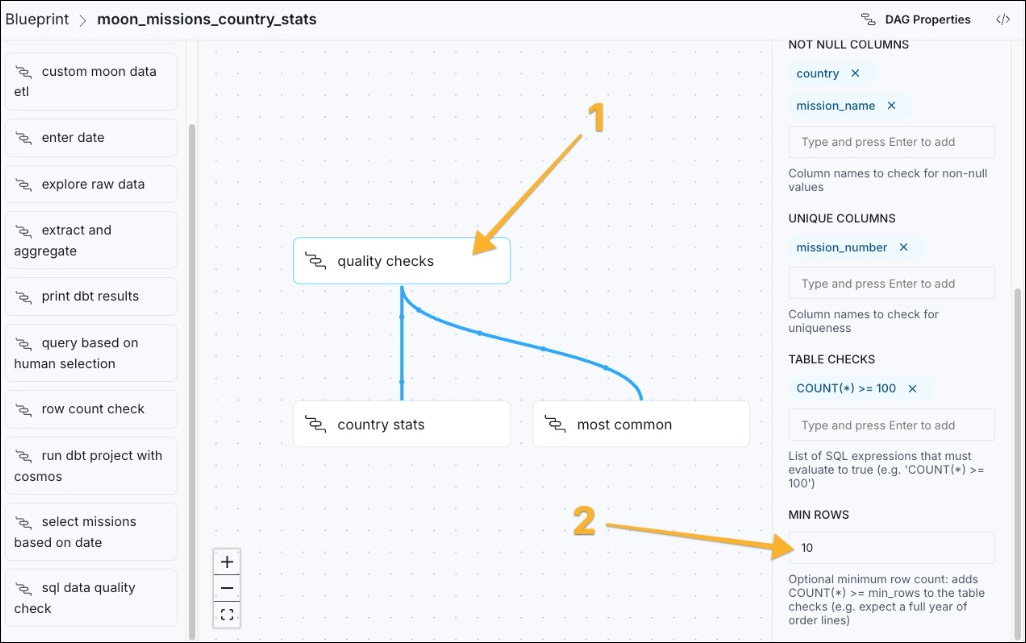
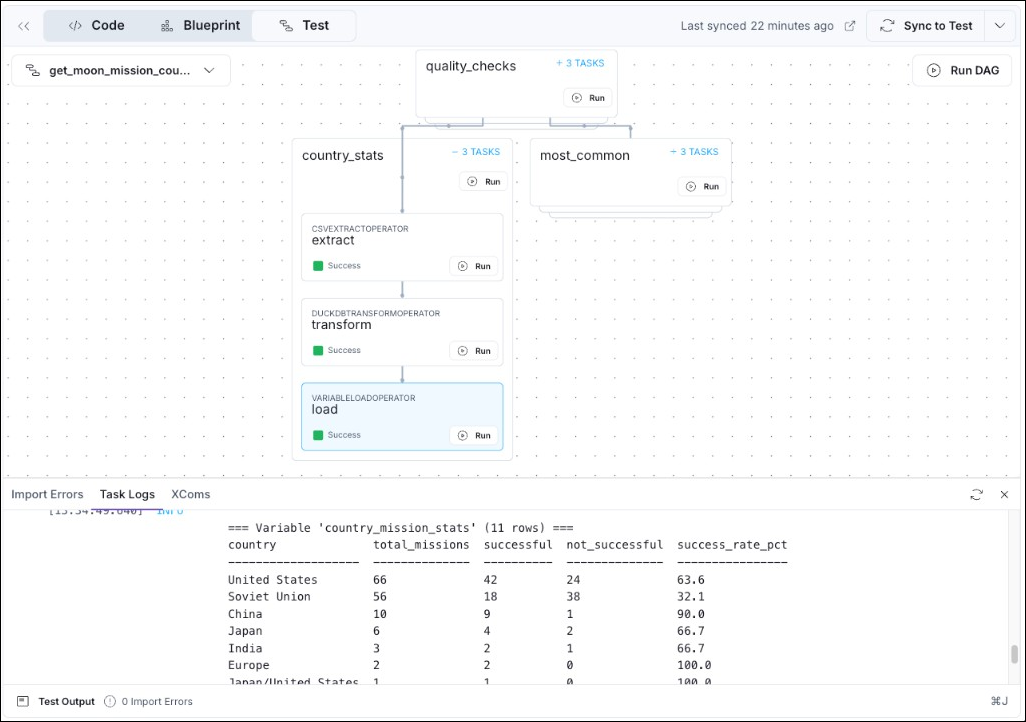
- If you click any nodes in the workflow graph, a panel opens on the right in which you can make changes to the configuration of the template. For example, you can change the
quality checkstask, which uses thesql data quality checkblueprint to make sure the source data has at least 10 rows.
Step 3: Run the pipeline
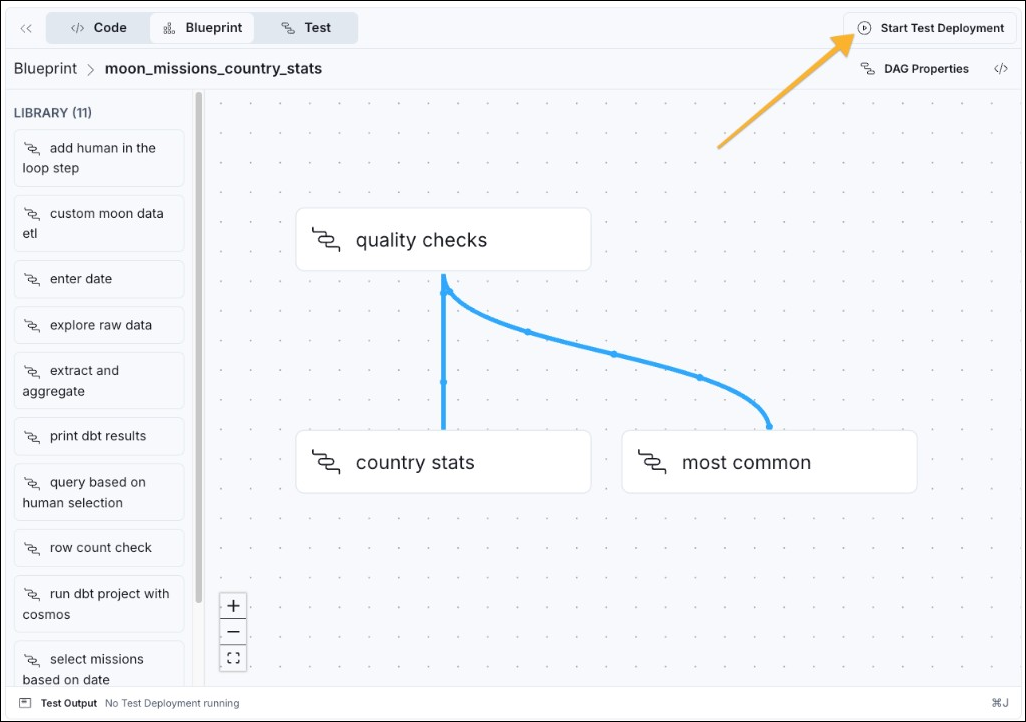
To be able to run any pipeline in the Astro IDE, you need to start a test Deployment.
- Click Start Test Deployment in the top right corner of the IDE. The test Deployment might take a few minutes to start.
- Once the test Deployment has spun up, you can run the Dag. Click the Test tab (1), select the Dag from the dropdown menu (2), and click Run DAG (3) to start a run.
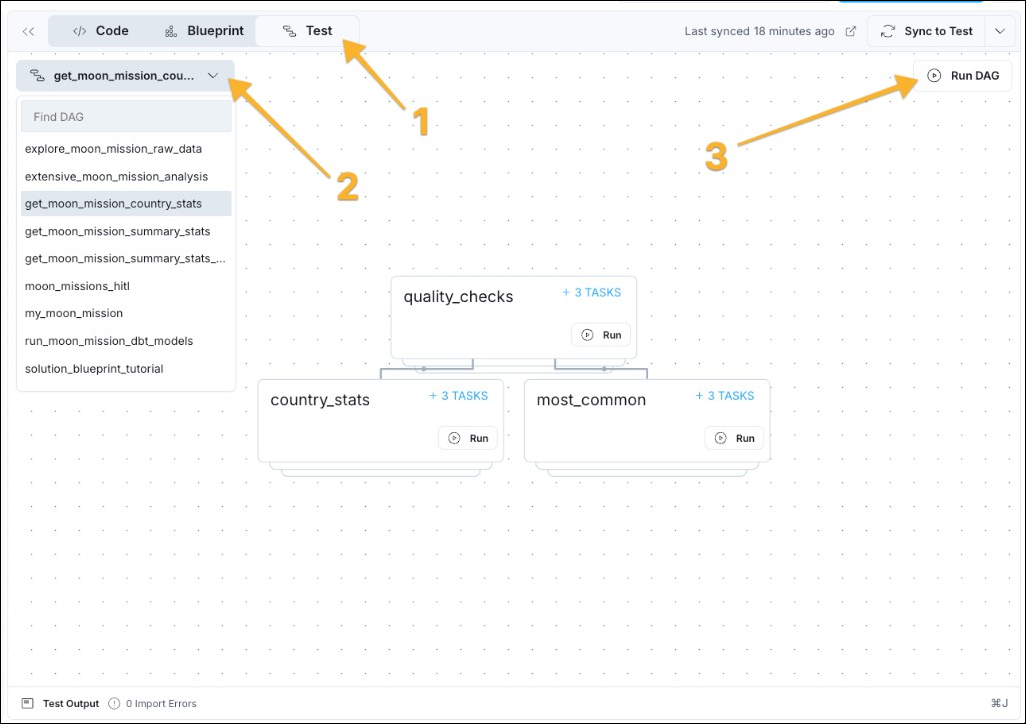
- Click + X TASKS on any blueprint node to see the individual Airflow tasks contained in a blueprint as they complete. You can see the output of the task by clicking on it and then on Task Logs on the bar at the bottom of the Astro IDE.
If you make any changes to a blueprint pipeline, you need to click Sync to Test to deploy your changes to the test Deployment before running the changed pipeline.
Step 4: Create a new pipeline
Now it is time to use Blueprint to build your own pipeline.
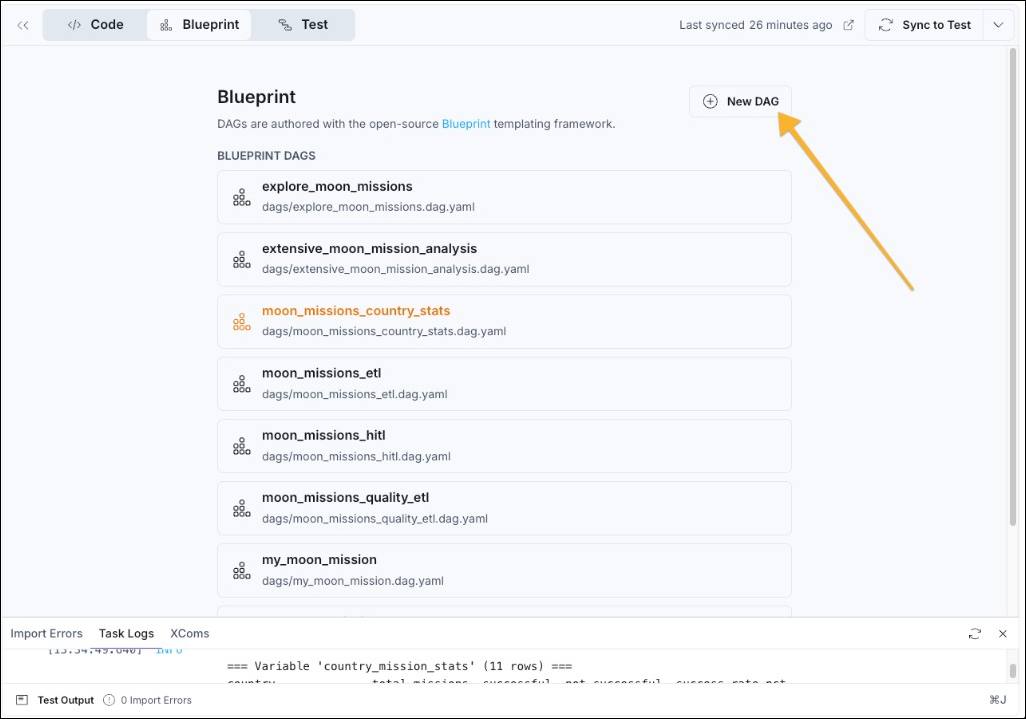
- Back on the Blueprint tab, click Blueprint in the breadcrumb to return to the overview of all Blueprint Dags in this project.
- Click + New DAG, give your Dag a name (an ID unique within the project, for example
my_first_blueprint_dag) and click Generate DAG.
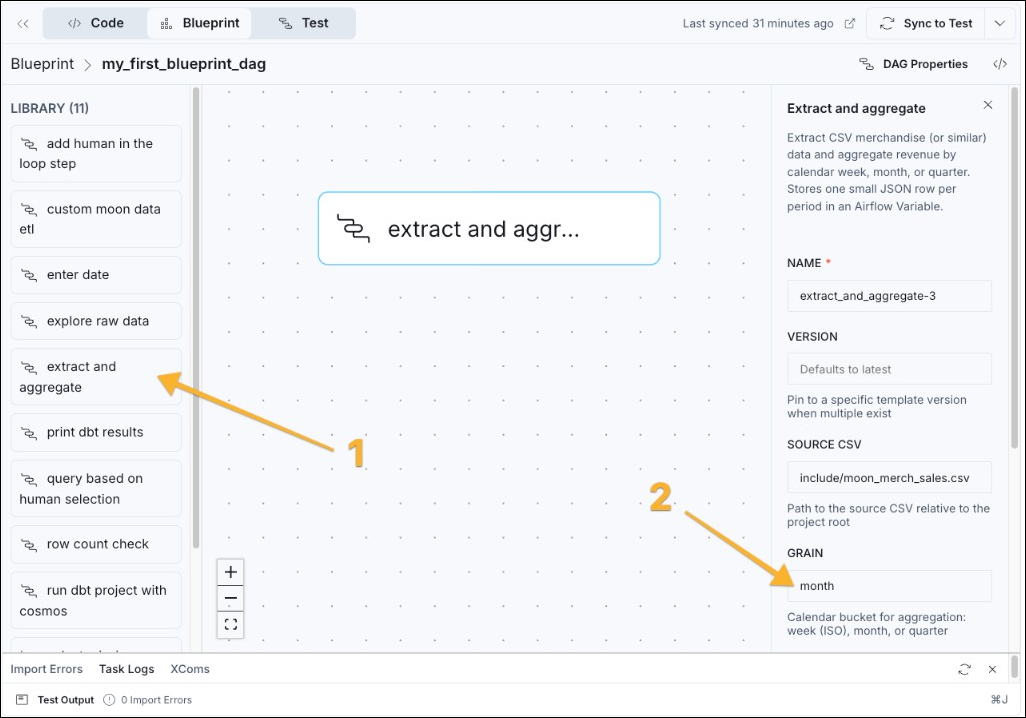
- Now you have an empty canvas. Add the first blueprint by dragging the extract and aggregate blueprint to the canvas and configure it in the form on the right. For example, you can change the
GRAINtoquarterinstead ofmonth, which changes how the blueprint aggregates moon merch sales.
If you want to change blueprints, either to change the form options, or get more blueprints entirely, see the write blueprint templates tutorial. Any action that can be defined in Python code can be part of a blueprint.
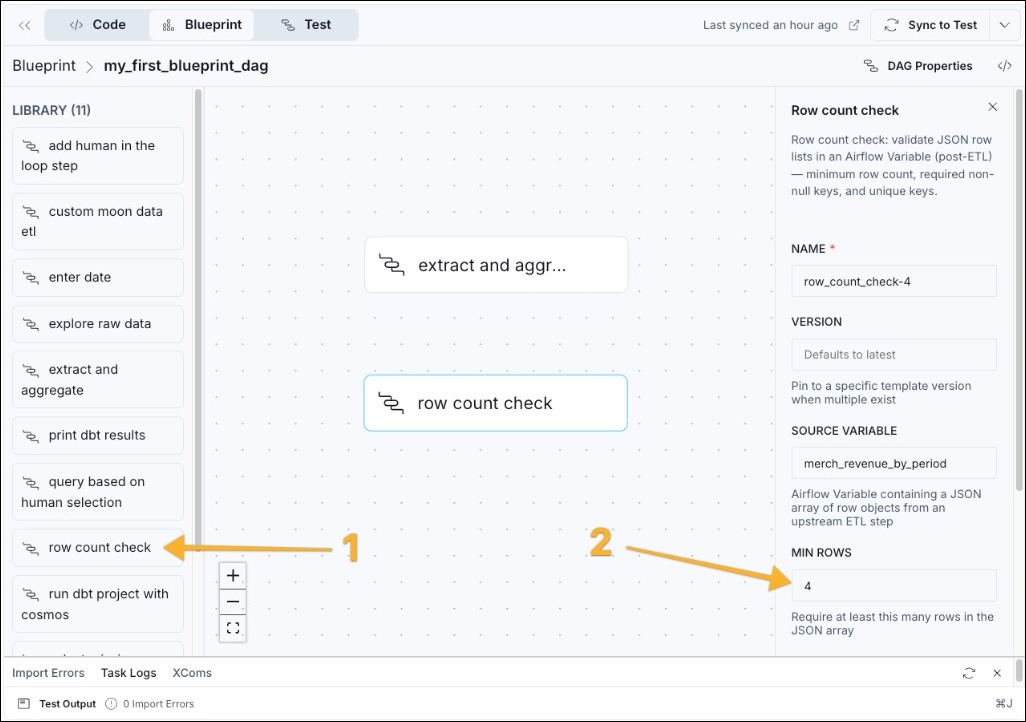
- Next, add a second blueprint to the pipeline to perform a data quality check. Drag the row count check blueprint from the library into the canvas and enter the minimum number of rows you are expecting. At a quarterly grain for one year of data, that would be 4.
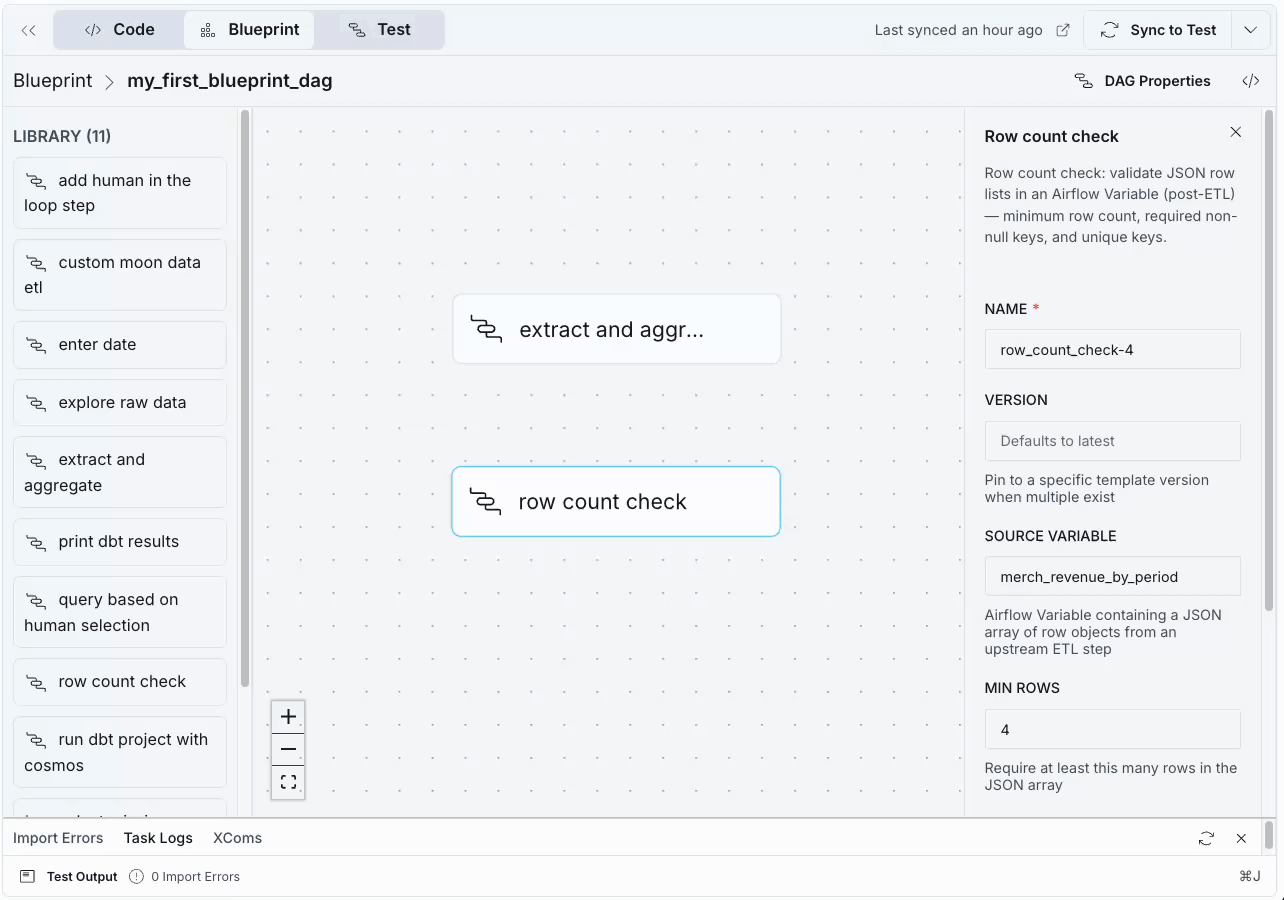
- You can set the dependency between the blueprints by hovering on the bottom edge of the extract and aggregate node, clicking and then dragging your cursor to the bottom edge of the row count check node. A blue line appears to indicate that the aggregation blueprint needs to run before the quality check.
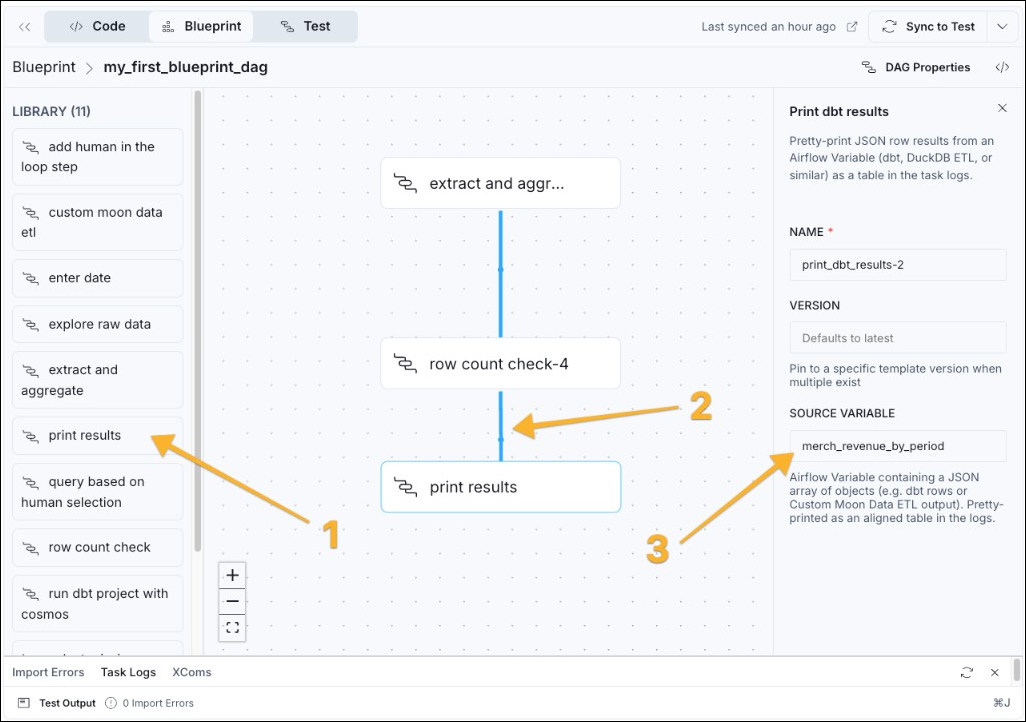
- Lastly, add a third blueprint that prints the results after the data quality check passes. Drag the print results blueprint from the library (1) into the canvas, add a dependency (2) and fill in the source variable field using
merch_revenue_by_period, the target variable of the first blueprint.
- Click Sync to Test to deploy your changes to the test Deployment. After the sync process has finished you can run your pipeline!
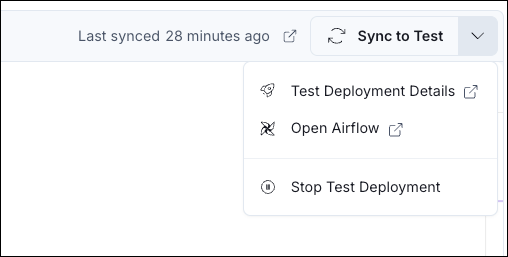
The test Deployment is a fully functional Airflow environment. You can access the regular Airflow UI of your Deployment by clicking on the dropdown arrow next to the Sync to Test button and selecting Open Airflow.
Conclusion
Congratulations! You created an Airflow Dag processing data, performing a data quality check, and printing the results, without writing any Python code! A good next step is to send the How to write blueprint templates tutorial to your data engineering team to write more blueprints for you to use.