Airflow Monitoring: Mastering SLAs, DAGs, & Observability
10 min read |
Airflow is an open-source platform to programmatically author, schedule, and monitor workflows. It is widely used to create and manage complex data pipelines with dependencies between tasks within or across DAGs.
The Airflow UI provides different views, like Grid view and reports in the Browse menu, as a good starting point to understand how your DAGs and Tasks are performing or behaving, to see your data dependencies, to track changes to the DAGs, and to view SLA misses, etc. Airflow also includes DAG and task-level notifications that you can use to be alerted the moment a task succeeds, fails, retries, or misses its SLA. These notifications can be integrated with external systems like email, PagerDuty, and Slack.
As your Airflow environments increase or become more complex, it becomes challenging to monitor the health of your DAGs and ensure the delivery SLAs (Service Level Agreements) are met. In such scenarios, based on your use-case and expertise, you have the option to either integrate a third-party observability tool with Airflow, or use Airflow REST API to extract the metrics from Airflow’s metadata database.
You can choose one or more of the different methods to monitor and track the health of your Airflow environment based on your use-case. Let’s discuss these in detail to help you understand.
The Airflow UI: good for getting started
Airflow comes with a built-in web interface that provides a UI to monitor and manage DAGs. The Airflow UI displays the status of DAGs and their individual tasks. It provides a grid and graph view of the DAG and allows you to trigger or retry DAG runs and individual tasks.
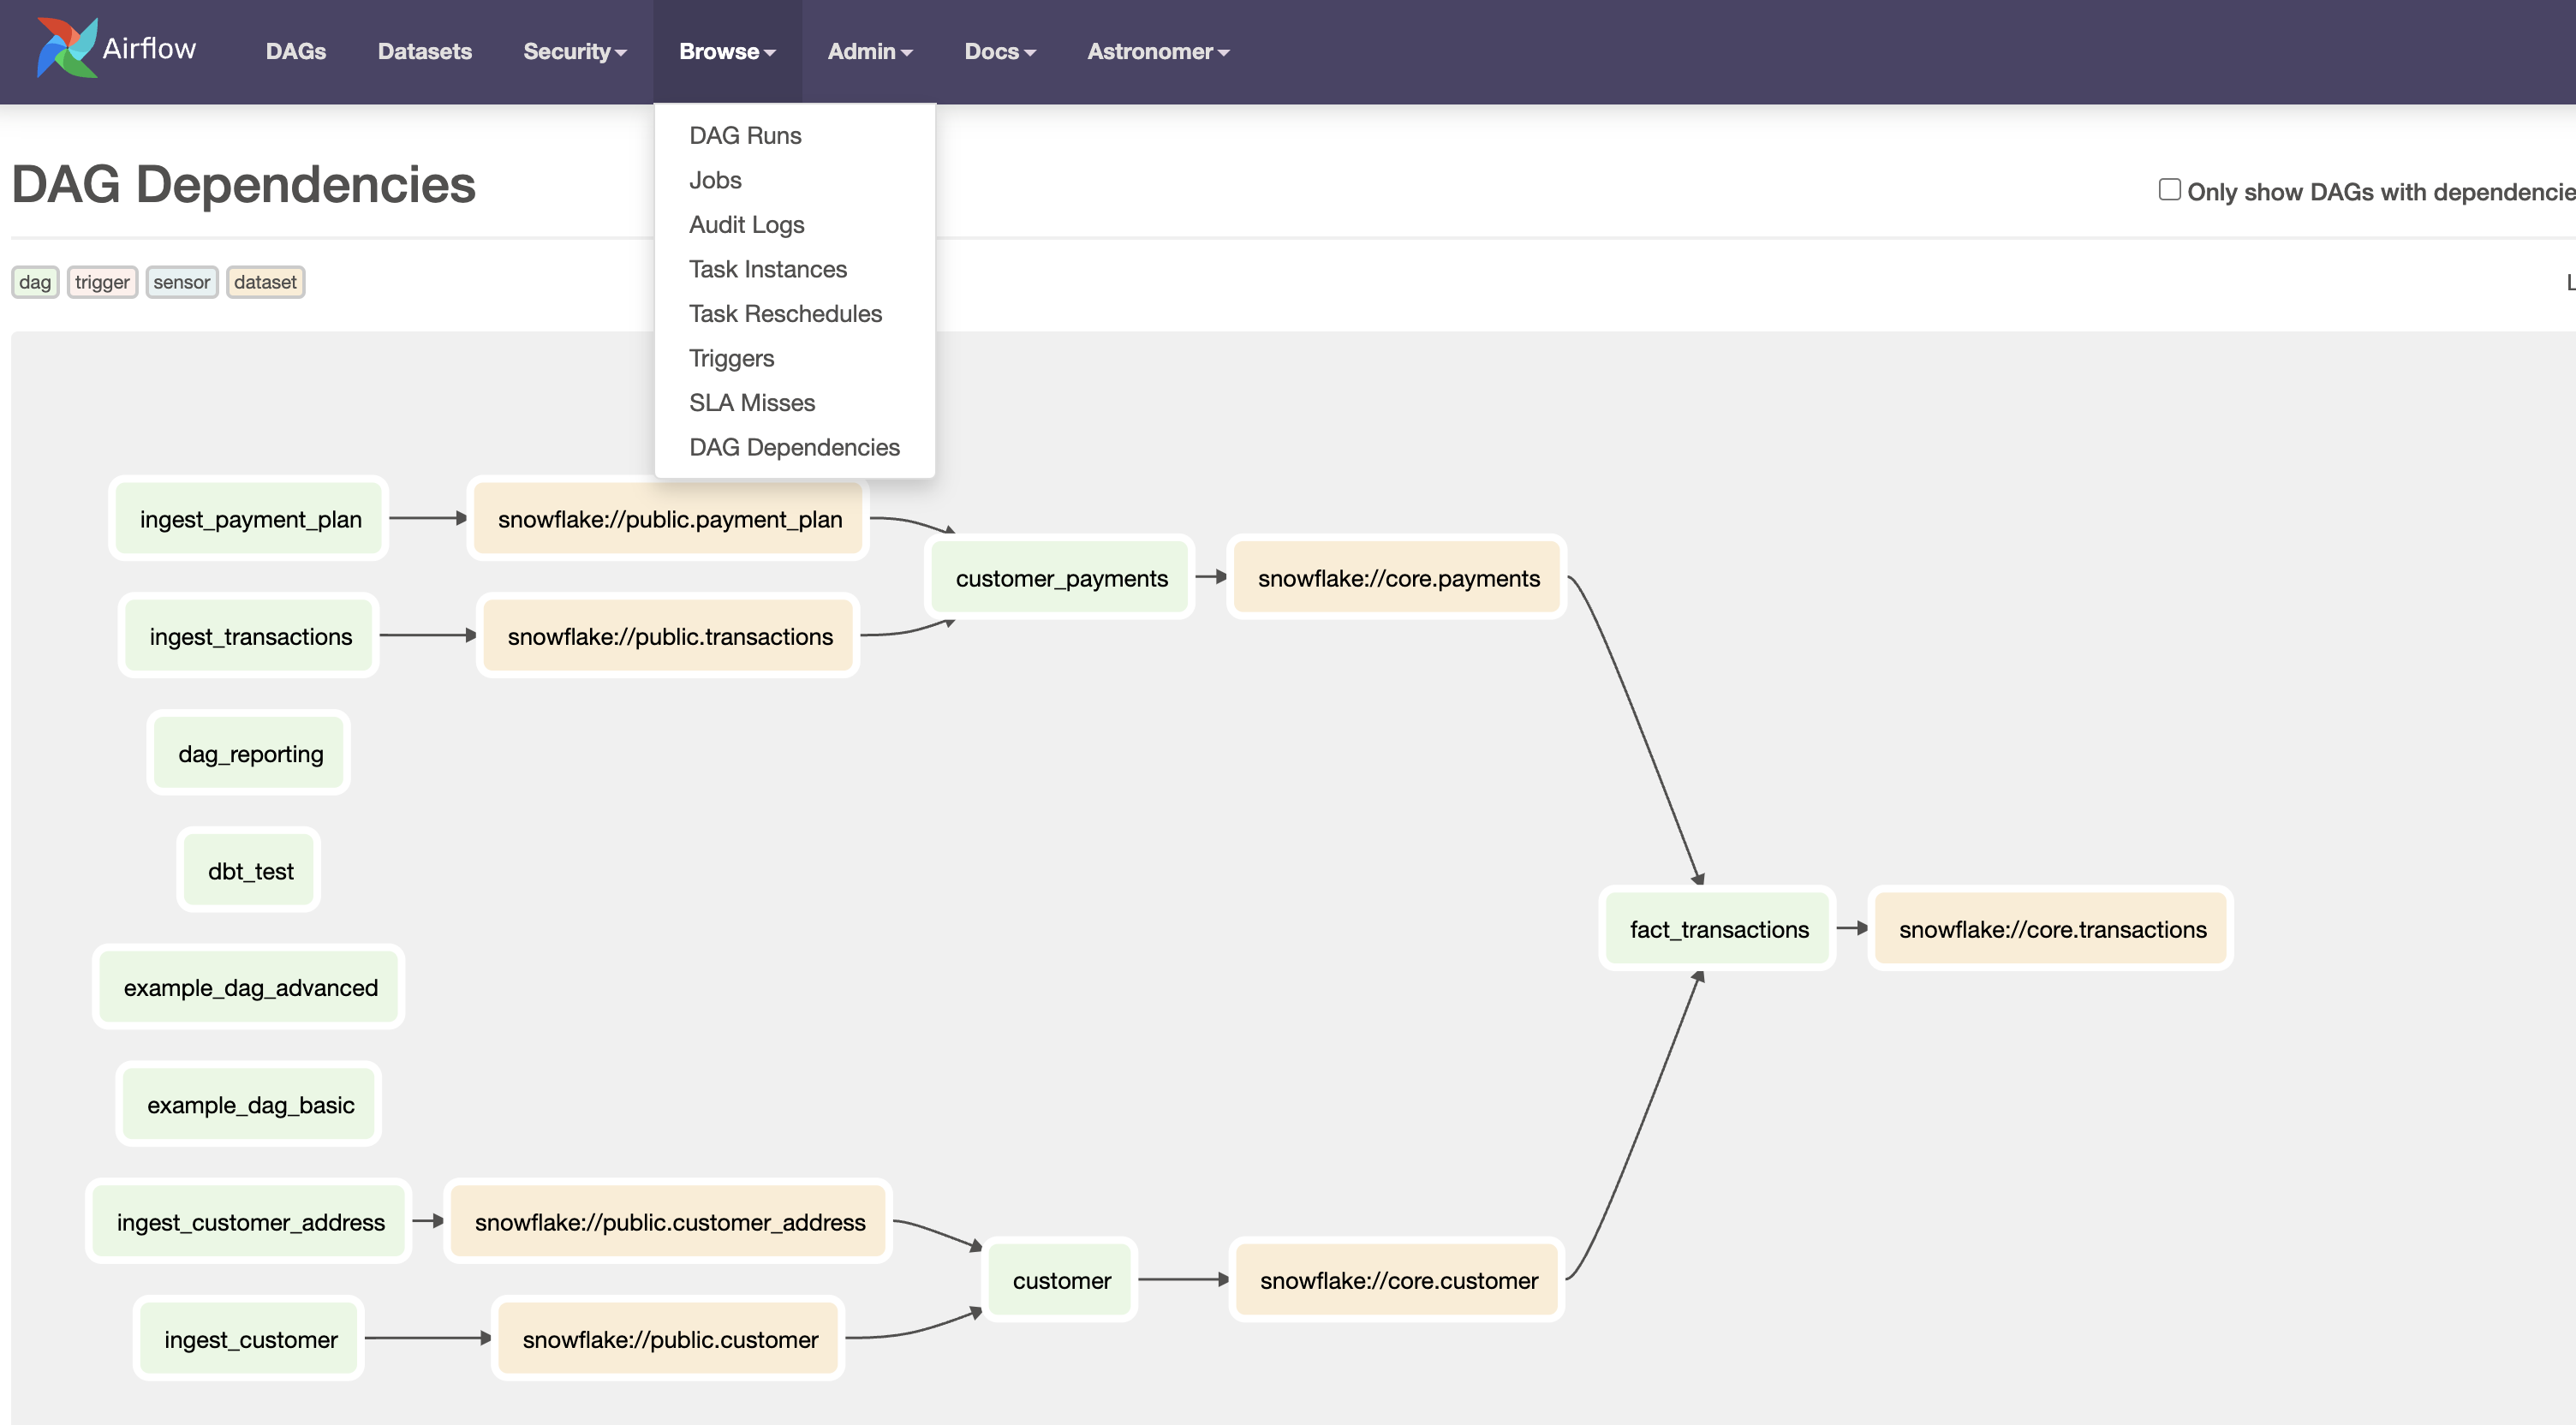
Airflow also provides several reports accessible from the Browse menu of your Airflow UI. These include, DAG Runs, Jobs, Audit Logs, Task Instances, Task Reschedules, Triggers, SLA Misses, and DAG Dependencies. You can easily search, filter, sort, and view these reports in a tabular format.
While this is sufficient for monitoring and tracking when you are just starting with Airflow or have just one Airflow environment to manage, but as your DAGs and their frequency increase, it becomes difficult to just rely on the Airflow UI alone. Additionally, the Airflow UI becomes an inefficient way of managing errors systematically, especially if certain failures need to be addressed promptly or by multiple team members.
Apache Airflow®’s built-in notifications
Airflow DAGs and tasks provide different types of notifications that can be easily set up based on your use-case. These include email notifications, callbacks, notifiers and SLAs, which can be configured at the DAG or task level. These notifications can trigger timely alerts to users via email, or to external systems like Slack, PagerDuty, or ServiceNow so that they can be handled promptly.
Using the Airflow UI and built-in notifications is one of the quickest and easiest way to setup an effective monitoring system for your Airflow DAGs.
Please note that Airflow alerts for SLA are tricky, as they work only for scheduled DAGs. This means that even a manual trigger of a scheduled DAG will not trigger SLA breach alerts. Also, an SLA defined for a task will consider the DAG start time to calculate the task duration and can give false positives for SLA breaches. Airflow on Astro comes with a special feature called Astro alerts, which allows users to receive alerts for DAG failures and task SLA breaches regardless of their DAG type, without having to change their DAG code.
An example of DAG-level email notifications in default_args which are applicable to all your tasks in the DAG:
default_args = {
    "email": ["noreply@astronomer.io"],
    "email_on_failure": True,
    "email_on_retry": True,
}

@dag(
    start_date=datetime(2023, 4, 25),
    schedule="@daily",
    catchup=None,
    default_args=default_args
)
You can also configure notifications in your task definition or override DAG-level configurations, for example:
@task(
    email=["noreply@astronomer.io", "noreply2@astronomer.io"],
    email_on_failure=True,
    email_on_retry=True
)
def t1():
    return "hello"
You can also use pre-built or custom Notifiers that allow you to standardize actions for task failures, ensuring consistency in handling such events. An example of pre-built SlackNotifier:
from airflow.providers.slack.notifications.slack_notifier import SlackNotifier
@task(
    on_success_callback=SlackNotifier(
        slack_conn_id=SLACK_CONNECTION_ID,
        text=SLACK_MESSAGE,
        channel=SLACK_CHANNEL,
    ),
)
def post_to_slack():
    return 10
Custom dashboards: for larger teams with complex environments
Organizations with cross-functional teams and multiple Airflow environments, running hundreds of DAGs with cross-DAG dependencies, find it challenging to manage their data landscape solely through monitoring and alerts. These organizations typically have separate support teams to monitor and track the health of their data pipelines. In such scenarios, dashboards with graphs and charts provide a visual representation of the state of your Airflow DAGs. These can help you quickly identify issues and take corrective actions. They are also easy to share and present to your team leadership.
Airflow’s metadata database captures various metrics about DAG runs, task runs, failures, retries, SLA misses, task duration, etc. Creating visualizations and charts from this data will open up a window into how your Airflow environment is functioning. There are many benefits, such as discovering which pipelines need attention, identifying outliers in terms of task duration, number of retries, or waiting time, and pinpointing the time when Airflow is the busiest or idle. These capabilities allow you to better manage your resources, both human and machine, thereby increasing your data team’s efficiency and productivity.
Integrating with external observability tools
Advanced users and teams can setup their own Observability tool like Grafana by integrating StatsD and Prometheus with Airflow. This is a complex setup, hence installing and maintaining a separate observability tool in a production-grade environment requires specific skills and time investment. There is also an added ongoing cost in maintaining these tools.
Visibility into DAG health with the Airflow REST API
Airflow REST API provides an effective and easy-to-use method to gather metrics about your DAGs from Airflow’s metadata database. For teams that do not want to setup an observability tool, can implement an in-house process for reporting on data pipelines that are running in Airflow. This involves exporting the data to an external database, and utilizing their Business Intelligence (BI) tool, such as Looker, Superset, or Tableau to create dashboards. Using this method, you don’t need to set up separate infrastructure to create visualizations and can rely on Airflow itself to gather metadata about your DAGs.
Astronomer recommends to use Airflow’s REST API to capture these metrics and not directly query or use Airflow’s metadata database. Querying the database directly can affect the performance of your database, and limit the connections available for use by your Airflow DAGs, adversely affecting their runtime.
Note that Managed Workflows for Apache Airflow® (MWAA) and Google Cloud Composer (GCC) do not offer access to the Airflow REST API.
Airflow’s REST API can only retrieve the metrics available in your metadata database but not related to the underlying infrastructure. Airflow on Astro provides observability metrics for your Airflow infrastructure in addition to DAGs and Airflow Deployment.
Building your own dashboard for Airflow DAG monitoring
Let’s walk through an example of how to authenticate to Airflow’s REST API and to extract the metadata.
- You can either use Python’s request library to access Airflow’s REST API or Airflow's Python client.
- Enable Basic Authentication by setting the following configuration in
airflow.cfg:
   [api]
   auth_backends = airflow.api.auth.backend.basic_auth
See details about other authentication methods in the Airflow OSS docs. Airflow on Astro uses more secure token-based authentication to access REST API.
- For basic authentication,
usernameandpasswordneeds to bebase64encoded and sent throughAuthorizationHTTP header as shown in the example in next step. - Following code snippet will send a GET request to retrieve a list of all your DAGs and write the output to a file.
   """
   This code snippet shows how you can use Airflow's REST API to retirieve a list of all DAGs in your Airflow environment.
   """
   import requests
   import base64
   import csv

   base_url = "http://host.docker.internal:8080/api/v1/"
   payload = {}

   user = 'my_user'
   password = 'my_password'

   # Airflow uses Base64 encoded header for Basic Authorization
   coded_secret = base64.b64encode(f'{user}:{password}'.encode())
   secret_api_auth_token = coded_secret.decode()

   headers = {
       'Content-type': 'application/json',
       'Accept': 'application/json',
       'Cache-Control': 'no-cache',
       'Authorization': 'Basic ' + secret_api_auth_token
   }

   """
   Prepare the URL for Airflow's DAGs endpoint to retrieve a list of all DAGs. This code will write the metadata about DAGs to an output file and return the dag_ids for further processing.
   """
   url = '/'.join([base_url, 'dags'])
   response = requests.request("GET", url, headers=headers, data = payload)

   # Raise an error if the request is not successful
   if response.status_code != 200:
       print(f"Error hitting API: {response.status_code} - {response.text}")
       raise ValueError(response.text)

   # Open the file in write mode and use a csv writer to write the data.
   data_file = open('/path/to/data/dags.csv', 'w', newline='\n')
   writer = csv.writer(data_file)
   dag_ids = []

   # Loop through all the rows returned and write
   for each_dag in response.json()['dags']:
       writer.writerow(each_dag.values())
       dag_ids.append(each_dag['dag_id'])

   return dag_ids
To test your REST API, you can also use API platforms like Postman or use thecurlcommand:curl --location 'http://localhost:8080/api/v1/dags' --header 'Accept: application/json;odata=verbose' --header 'Authorization: Basic '$(echo -n user:password | base64)
- You can then load the csv file to your database. For example, to load data in Postgres:
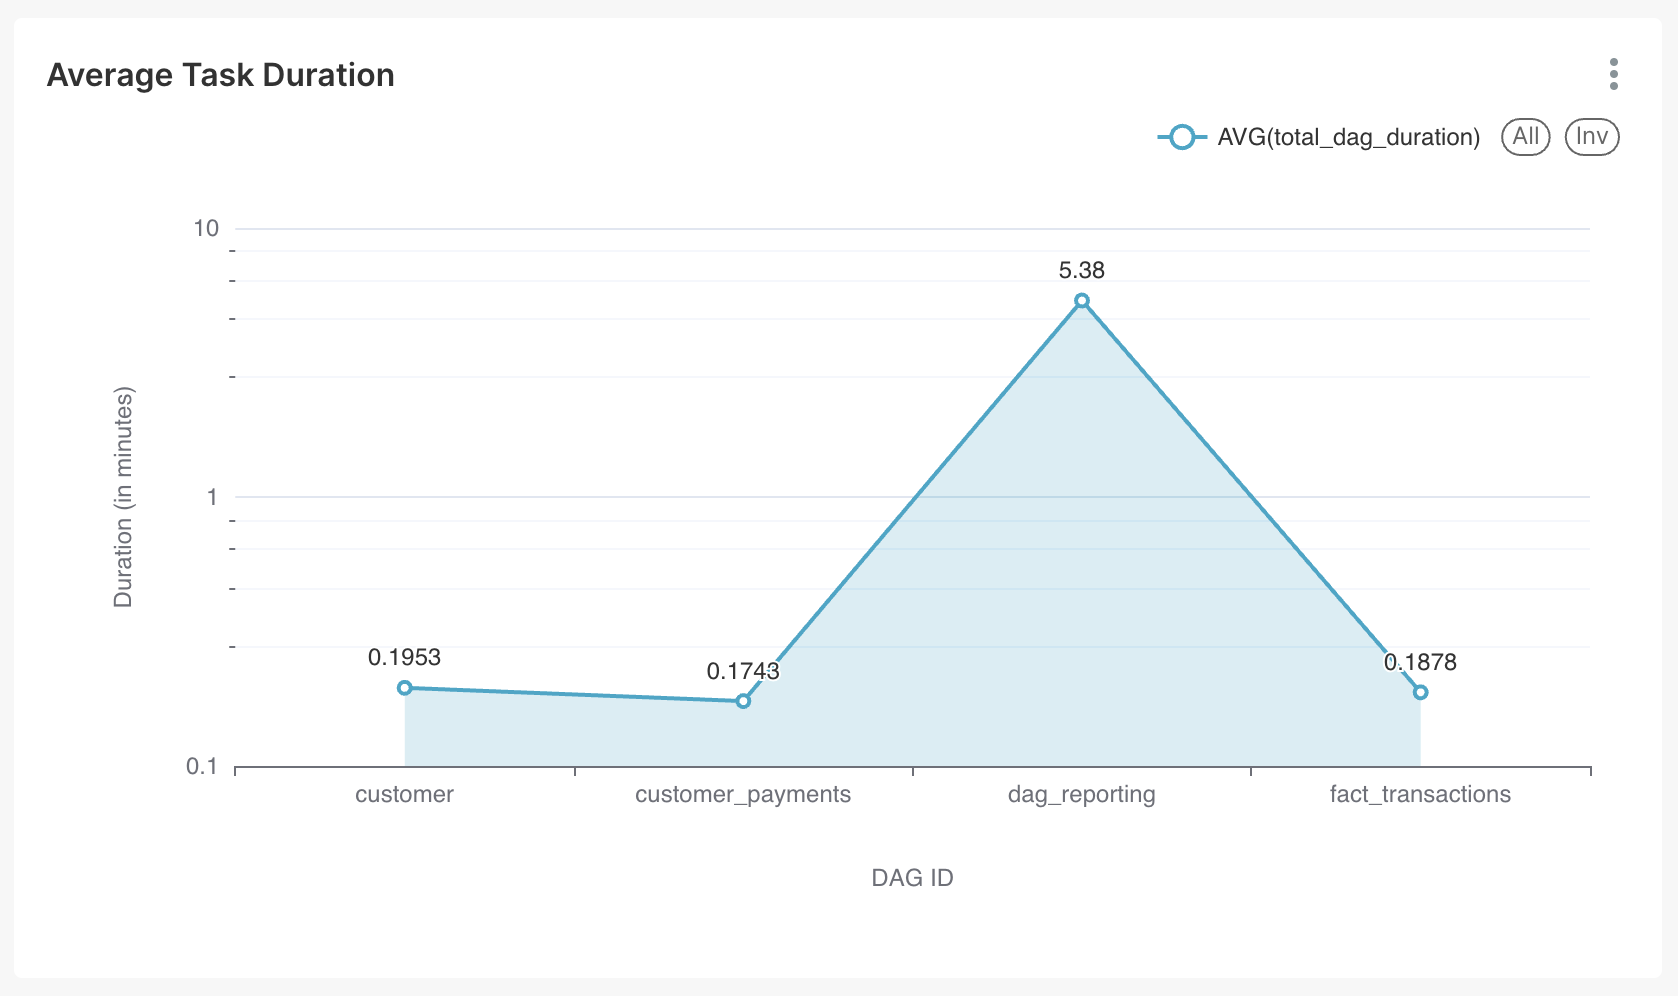
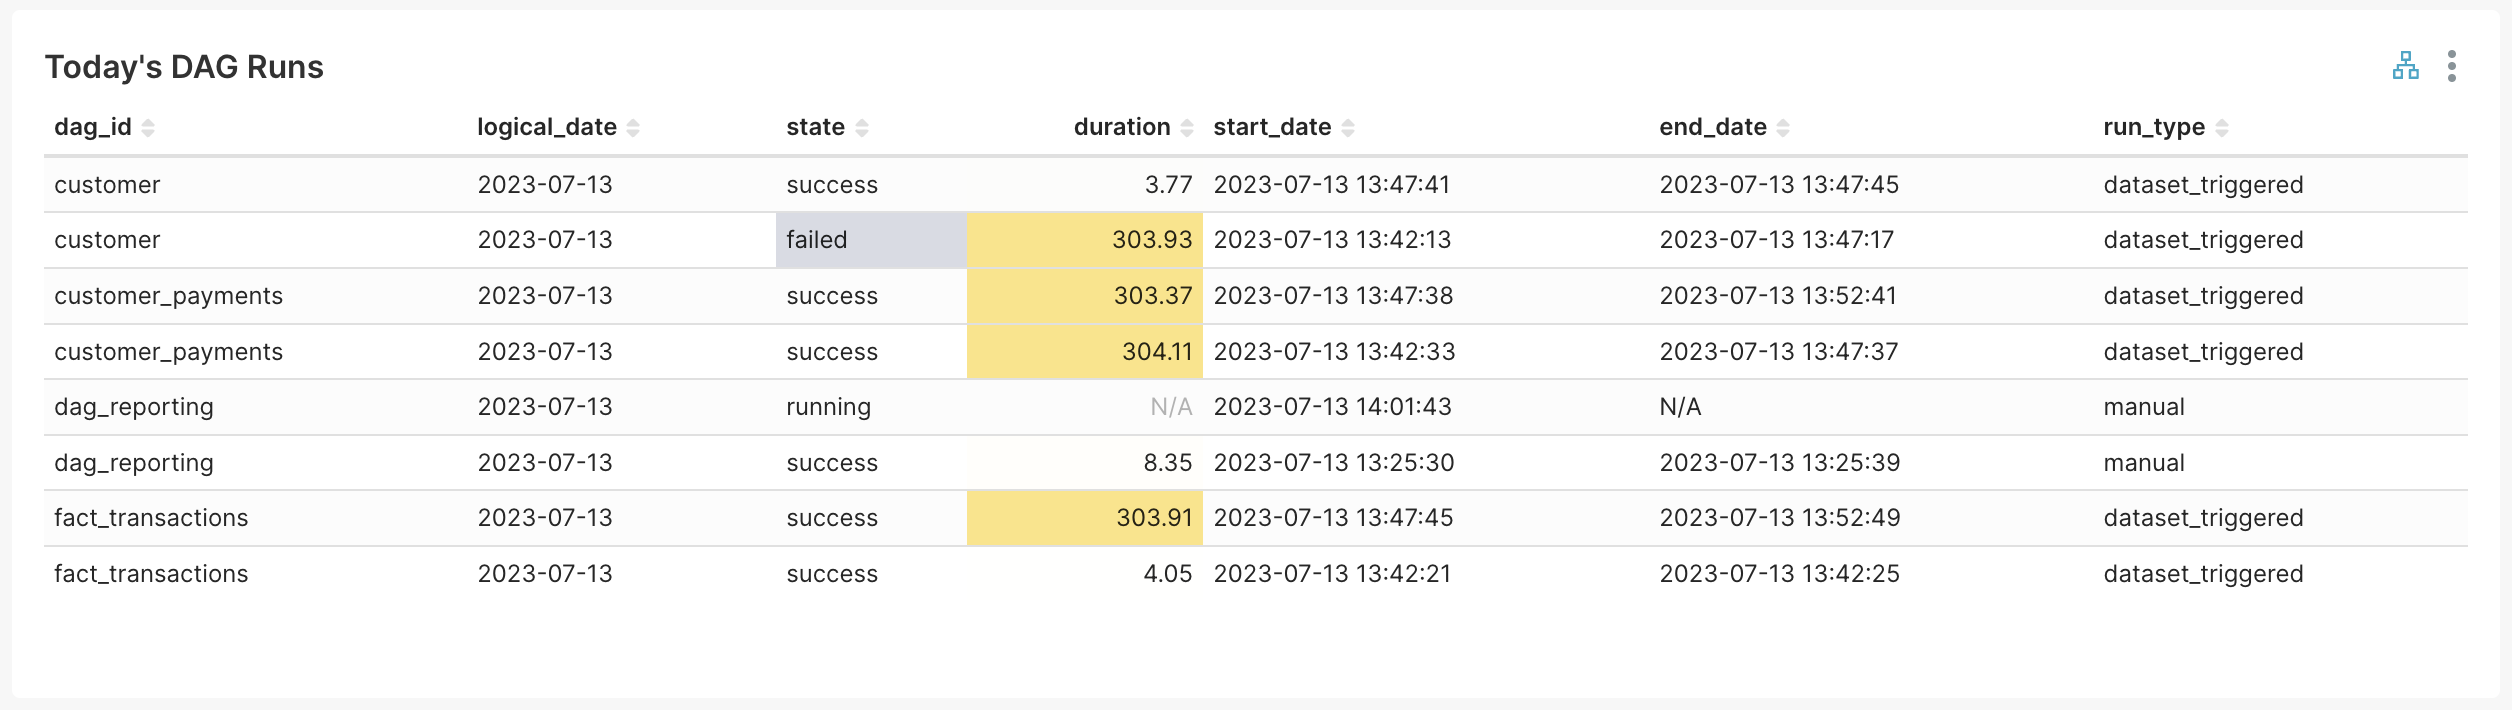
COPY airflow.dags FROM '/path/to/data/dags.csv' DELIMITER ',';- You can now connect your database to your BI tool and start building charts and dashboards. Few examples of charts are shown below:
Out-of-the-box monitoring of DAGs, Tasks, and Infrastructure with Airflow on Astro
Astro provides a fully-managed experience to run your Airflow environments for teams of all sizes, ensuring optimal performance and reliability. When you run Airflow on Astro, all your DAG run metrics and infrastructure metrics, such as CPU usage, memory usage, network usage, etc. are available in the same UI. These metrics are collated per Airflow environment for your entire organization.
The Astro alerts feature allows users to receive alerts for DAG failures and task SLA breaches regardless of their DAG type, without having to change their DAG code. SLA breaches are calculated based on task duration which you can set directly from Astro’s control plane.
Astro gives you a single pane of glass out-of-the-box to monitor your DAG and Airflow health, and the ability to:
- manage multiple Airflow environments across multiple clouds, regions and accounts from a single pane.
- choose the executor of your choice - Celery or Kubernetes - and the ability to switch anytime!
- focus on building DAGs and leave the management - ongoing maintenance, provisioning and auto-scaling of resources, and uptime monitoring - to Astronomer.
- create and manage ephemeral Airflow environments programmatically.
- access exclusive features with Astro Runtime to enrich the task execution experience, including smart task concurrency defaults and high availability configurations.
- and much more!
You can try Astro free for 14 days to experience the best way to run your Airflow.
Conclusion
Metrics in the form of tables, charts, graphs, and other visualizations are an essential tool for monitoring the health and SLA of your Airflow system. They provide a quick and easy way to identify issues and take corrective actions. While Airflow's built-in UI is a good starting point, along with notifications, using dashboard tooling provides more customization options with an added overhead of cost and maintenance.
If you are looking for easy-to-use, comprehensive observability out-of-the-box, along with managing your Airflow environments, try Airflow on Astro. Choose the tool that best suits your needs and start monitoring the health of your DAGs today!

Get started free.
OR
By proceeding you agree to our Privacy Policy, our Website Terms and to receive emails from Astronomer.