Watch the recording


Webinar agenda:
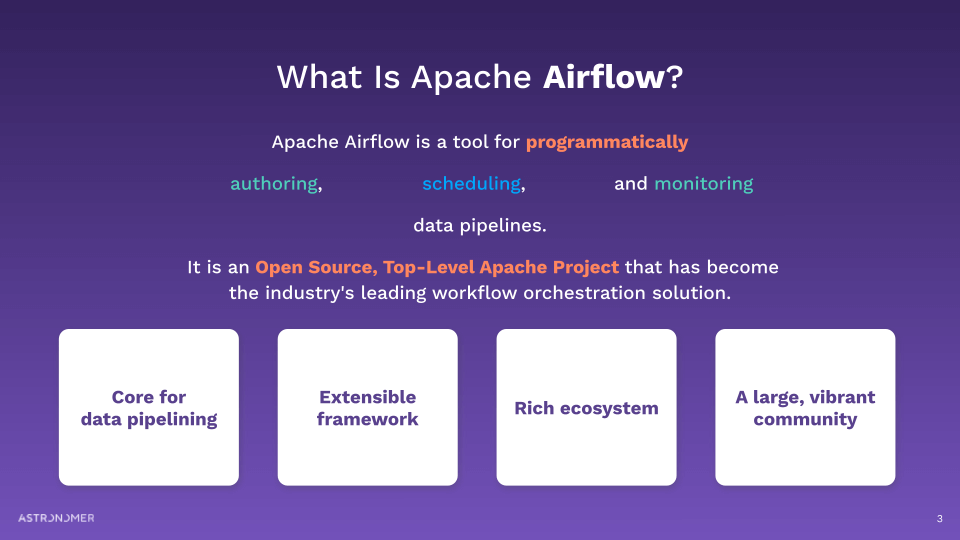
- What is Apache Airflow®?
- What makes a good data analyst
- A user story
- The stack
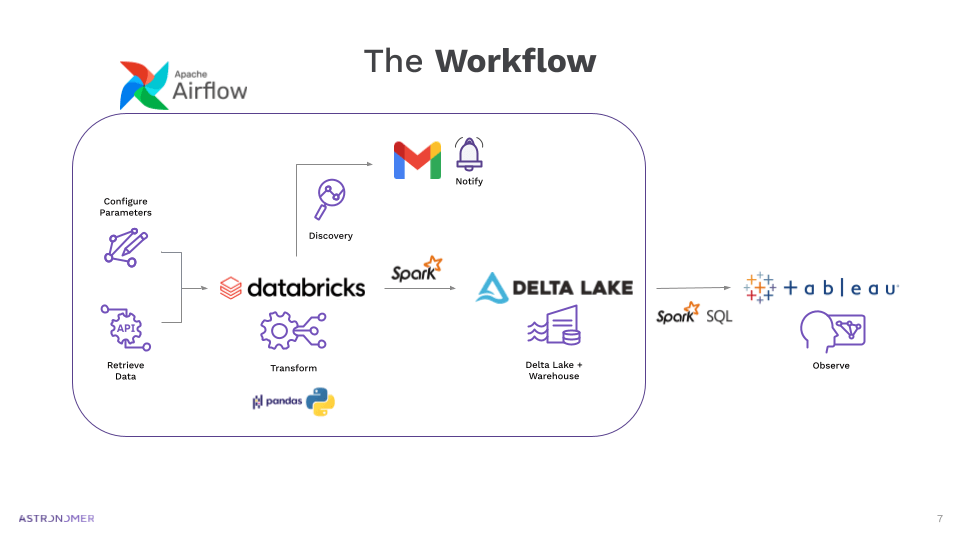
- The workflow
- The Airflow DAG
- Data Analysis step by step (Airflow, Databricks, Tableau)
Useful links:
What is Apache Airflow®?
What makes a good Data Analyst
Extensive knowledge of the business and KPIs
- Data analysts (also called business analysts or analytics engineers) know the organization’s OKRs, metrics, and targets.
- When a new objective is defined, data analysts work with stakeholders to build metrics that can be calculated using data.
Knowledge of company data and what’s missing
- To build these metrics, data analysts need to know the company’s data very well.
- This means understanding the ETL/ELT pipelines, the databases, and what data isn’t captured.
- Data analysts often incorporate data from outside sources (e.g., public APIs) to fill in gaps in the data.
Domain expertise to inform decision-makers -Data analysts then analyze the relevant data and compute the necessary metrics.
- They visualize the results and communicate them to stakeholders, empowering them to make business decisions based on data.
- They have to deliver insights regularly and reliably.
The Data Analyst’s Stack and Workflow
Data analysts work with a wide variety of tools. A typical analyst’s stack and workflow might look like this:


Airflow DAG task dependencies
run_databricks_job >> retreive_databricks_output >> branching >> [no_mail, mail]
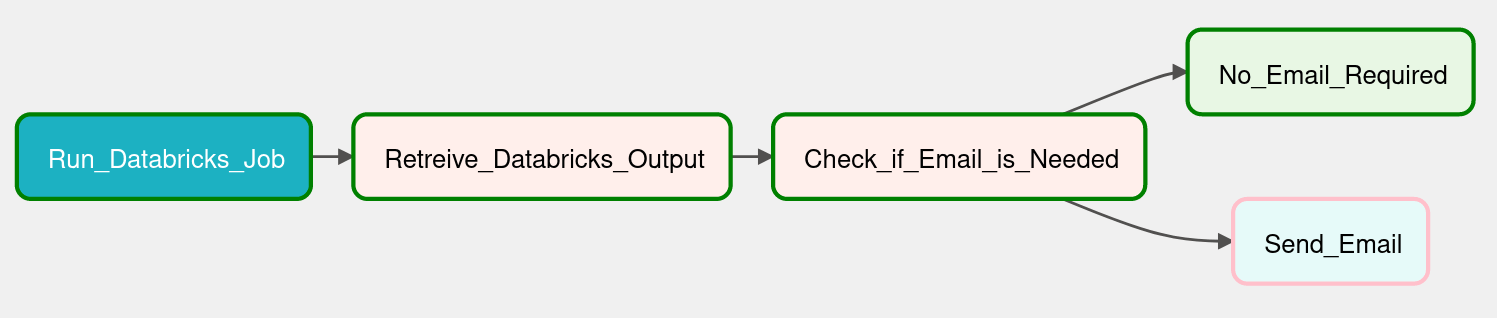
In this sample DAG, we see:
- Airflow triggering the Databricks job; then
- retrieving the output from the Databricks job (in between these two tasks the Databricks notebook is running and performing the transformations and analysis); then
- making a decision whether an email notification to the client is necessary based on the outputs results from the Databricks notebook; then
- based on that decision, either sending or not sending an email.
Sample data analysis: A User Story
Imagine a Data Analyst who works for an investment management firm, helping clients make good decisions about their investment portfolios. To do so, the Data Analyst retrieves market data regularly, and for each client provides an analysis of how the industries they are invested in perform.
The Data Analyst persists the transformed data from analyses, sends automated notifications to clients to take action when relevant, and keeps a dashboard up to date for them to check their investment health at a glance.
Let’s look into this Data Analysts workflow.
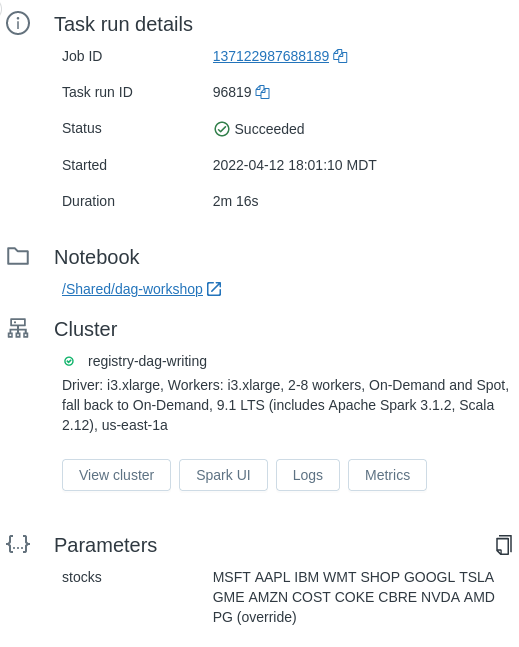
Sample data analysis Part 1: Airflow triggers Databricks notebook with parameters
Step 1: Passing Parameters from Airflow
As notebook_params in the DatabricksRunNowOperator.
portfolio = {
"stocks": "MSFT AAPL IBM WMT SHOP GOOGL TSLA GME AMZN COST COKE CBRE NVDA AMD PG"
}
# Run the Databricks job and retrieve the job Run ID
run_databricks_job = DatabricksRunNowOperator(
task_id="Run_Databricks_Job",
databricks_conn_id=DATABRICKS_CONNECTION_ID,
job_id=137122987688189,
do_xcom_push=True,
notebook_params = portfolio
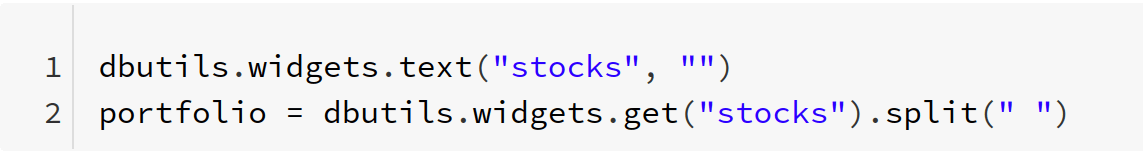
)Step 2: Retrieving Parameters in Databricks
Use dbutils.widgets.text(param, default_value) to load params pushed by Airflow into the notebook.
Step 3: Check the parameters in the Databricks UI after the notebook runs
Sample data analysis Part 2: Data ingestion & transformations
Step 1: Invoking the API
Pull data from Yahoo Finance using the yfinance Python package 1
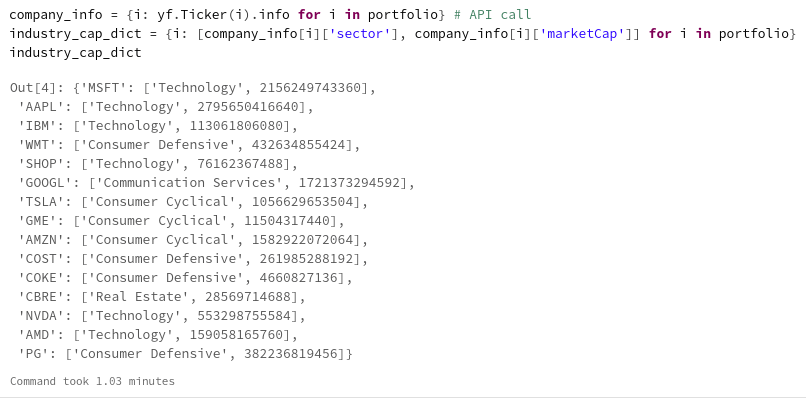
Code credits: https://github.com/ranaroussi/yfinance
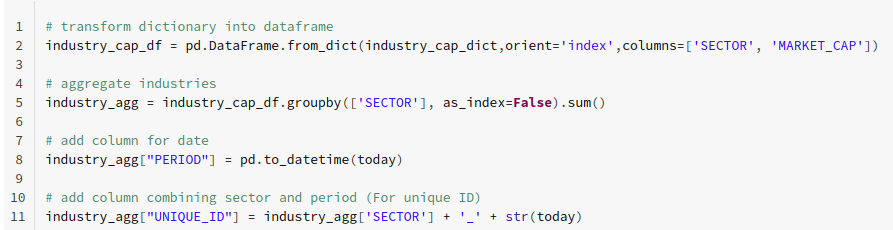
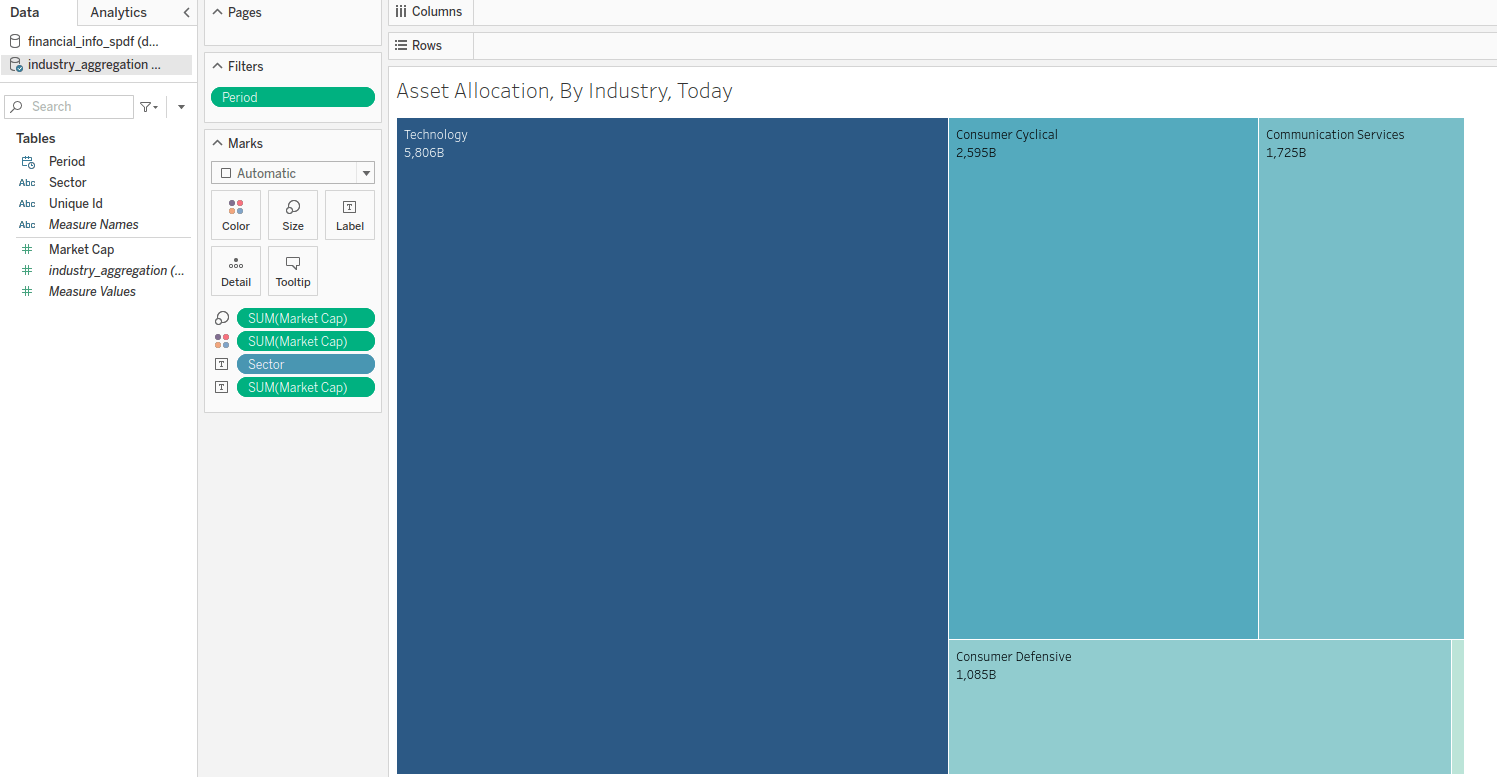
Step 2. Aggregating Market Cap. by Industry Sector
Sample data analysis Part 3: Enjoying the View, A (Delta) Table on a (Delta) Lake
Creating a Delta Table of daily data
Step 1: Transform pandas df into Spark df
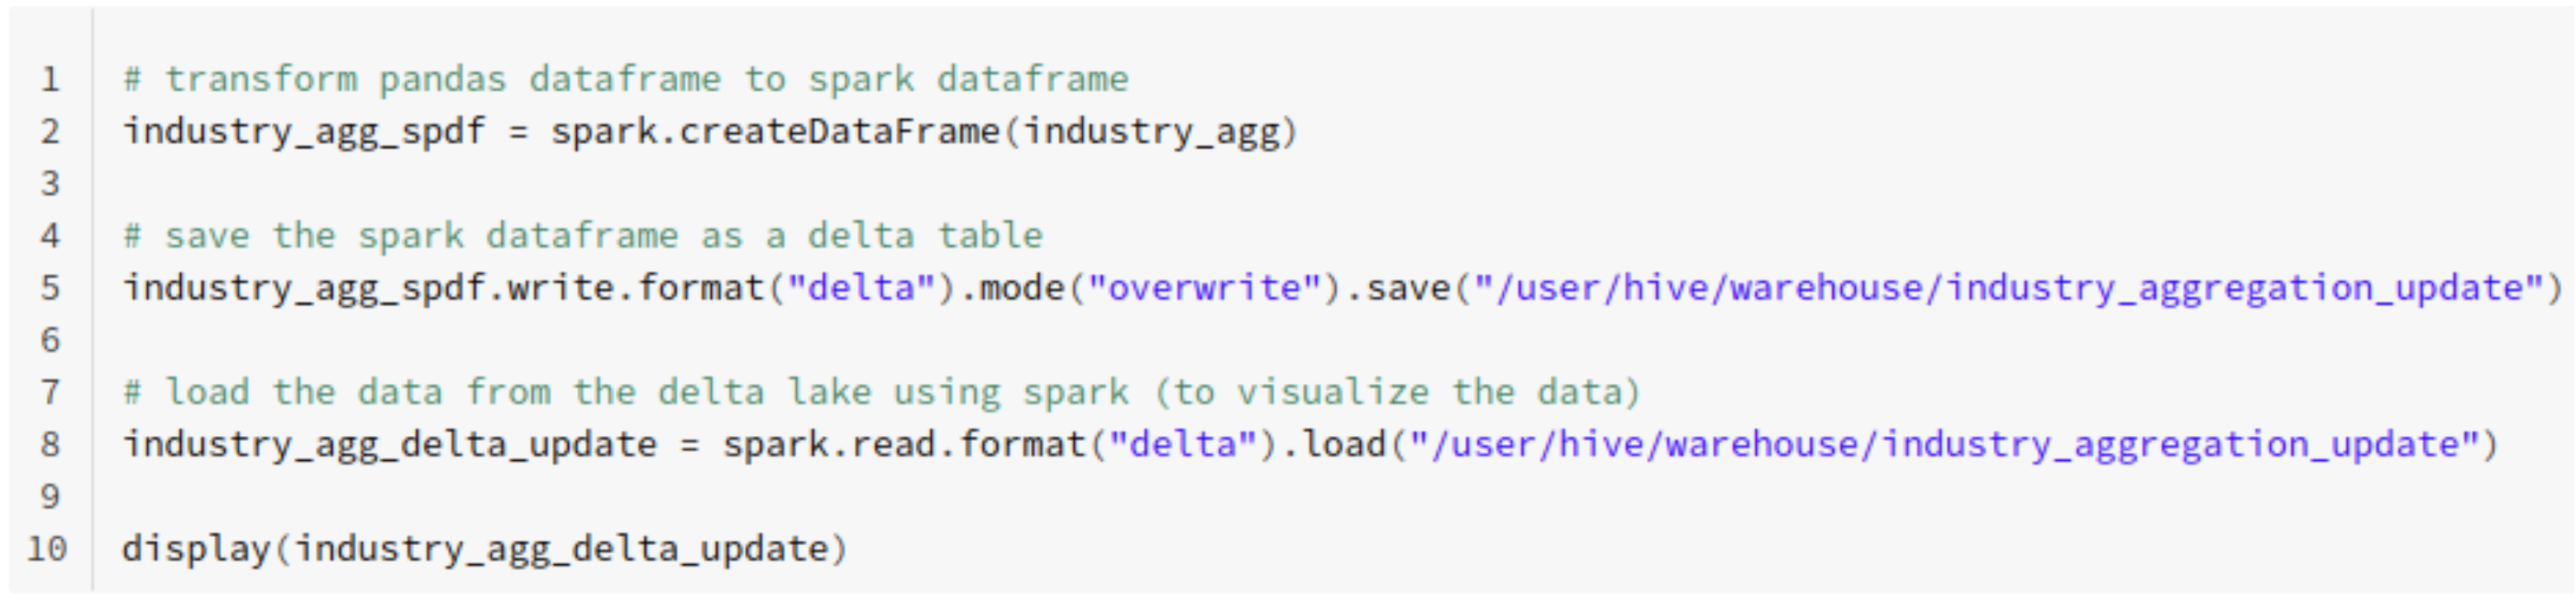
Step 2: Write Spark df to Delta Table
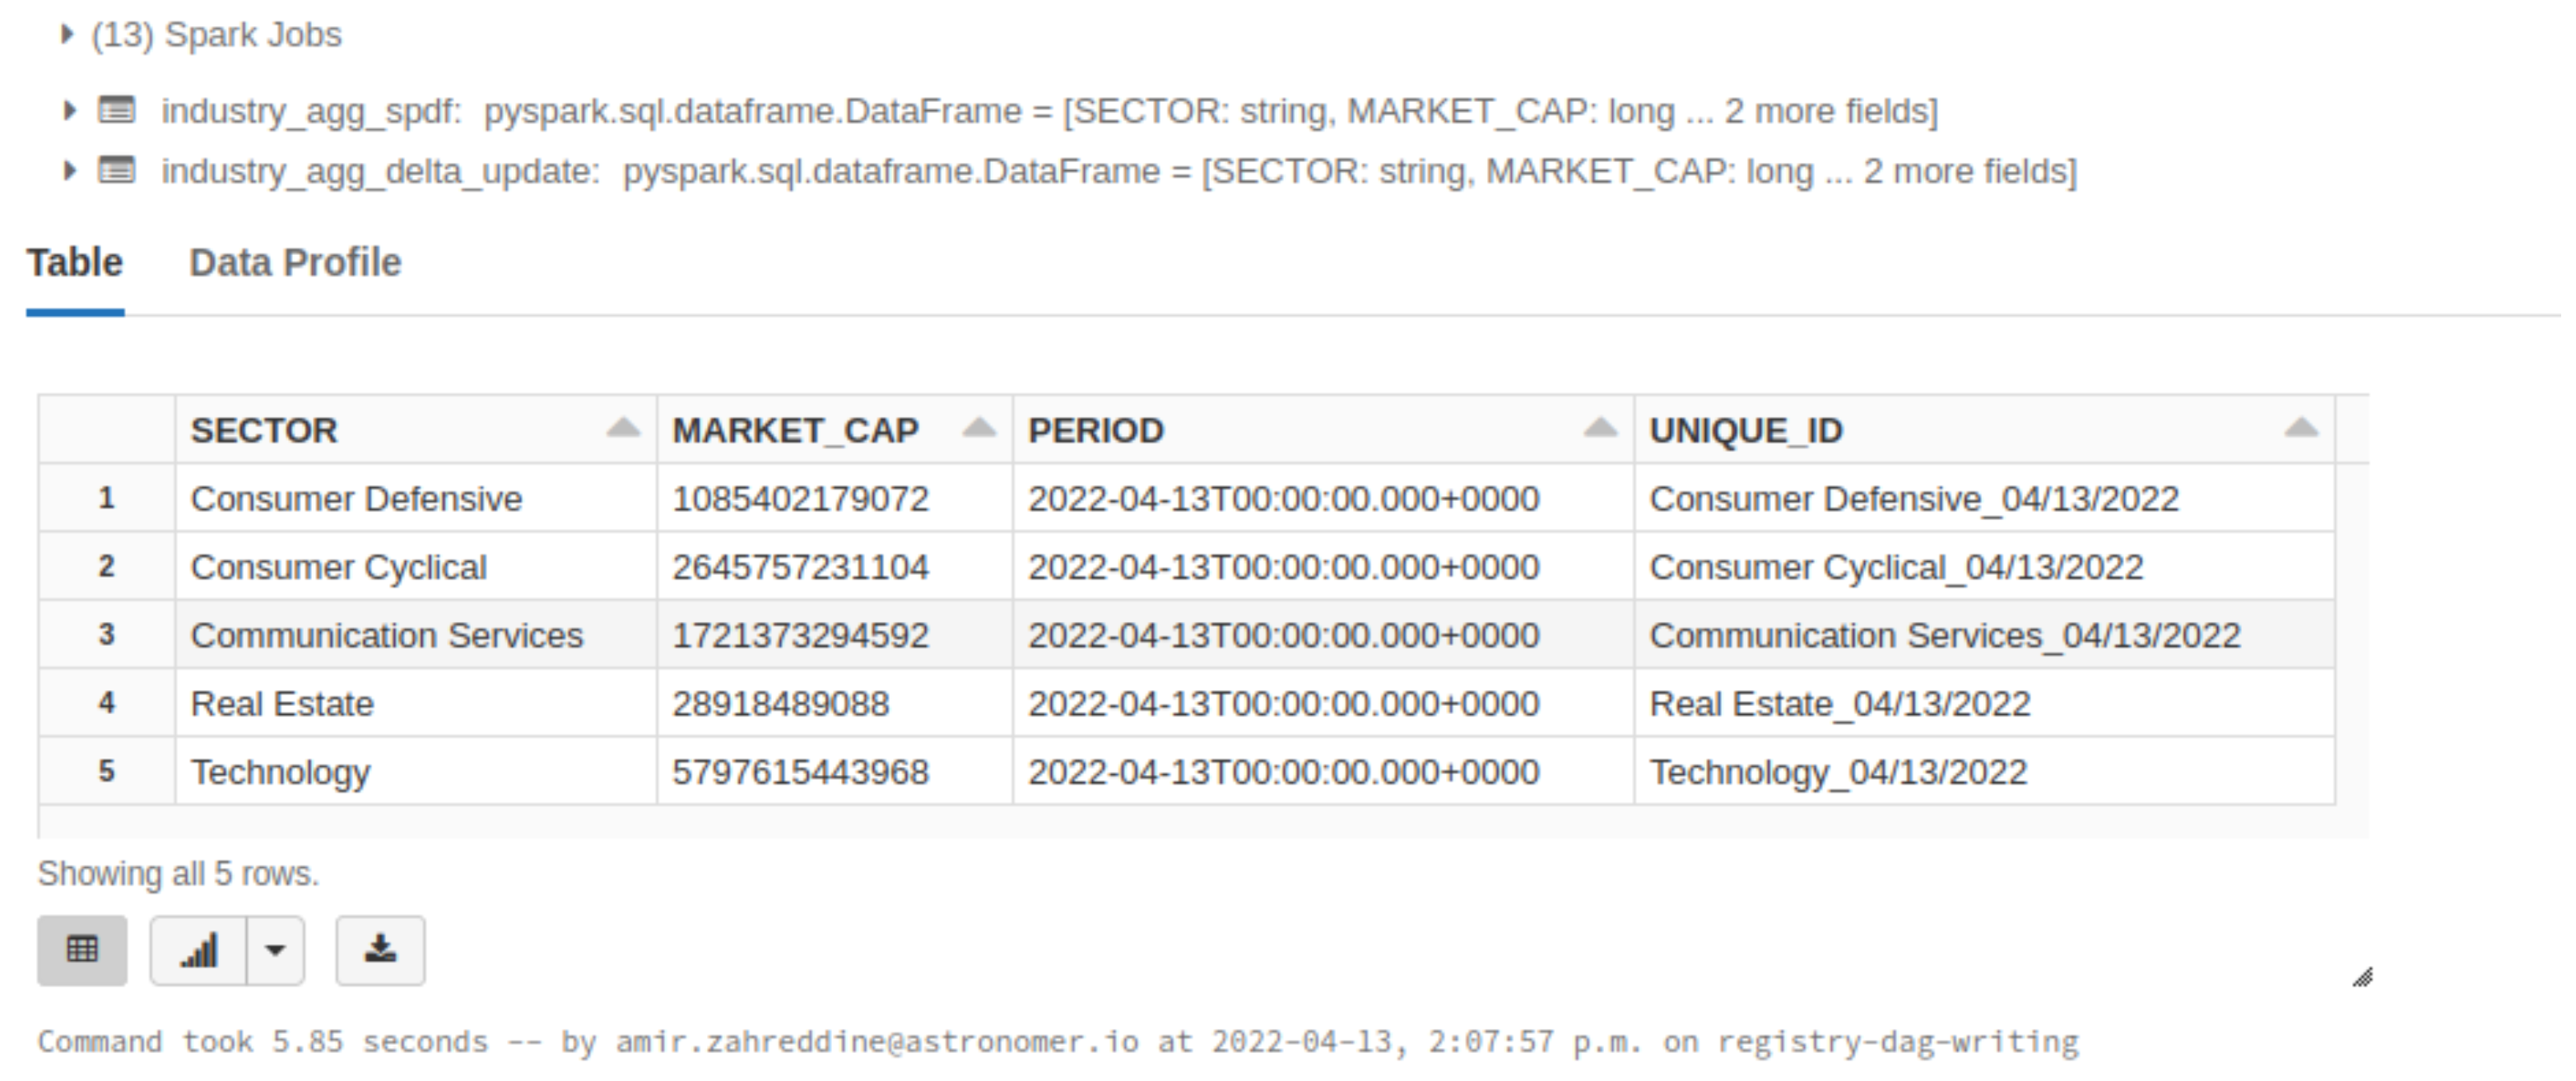
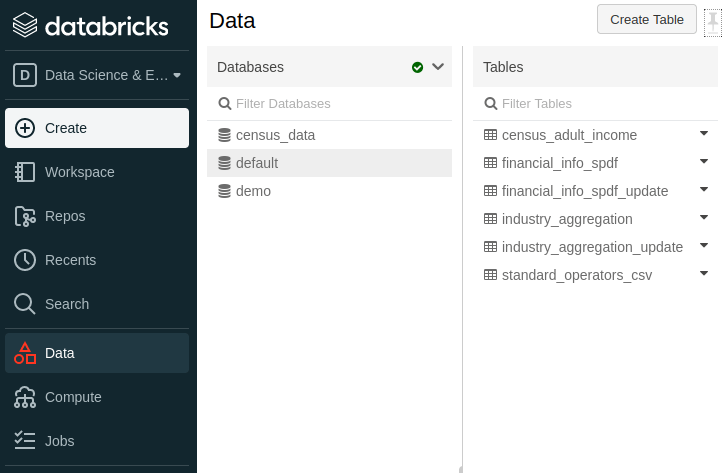
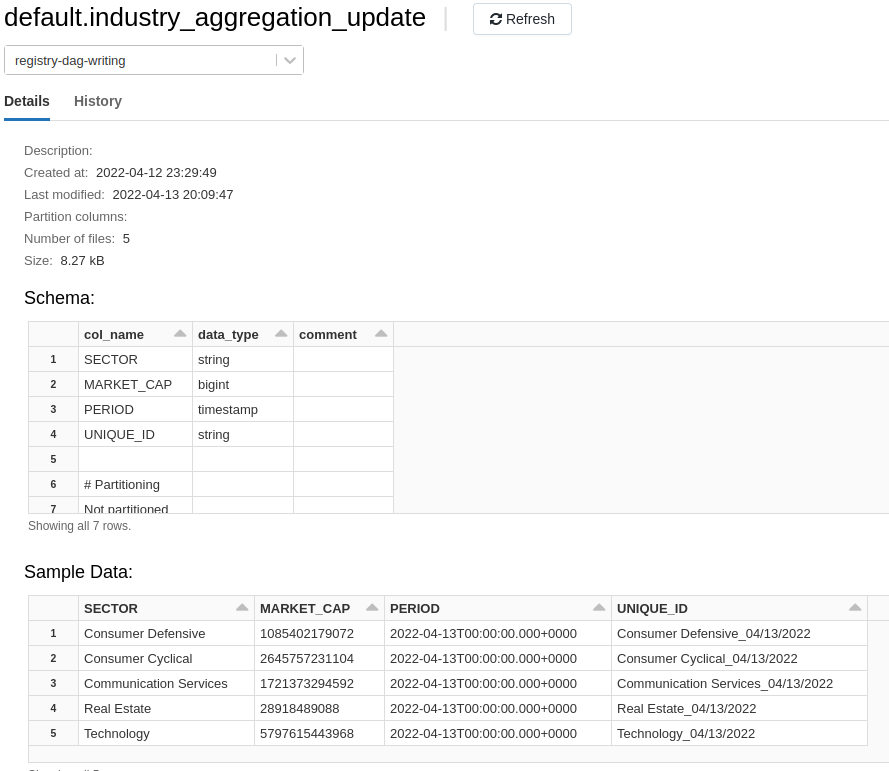
Viewing the table in Databricks
Step 1:
Step 2:
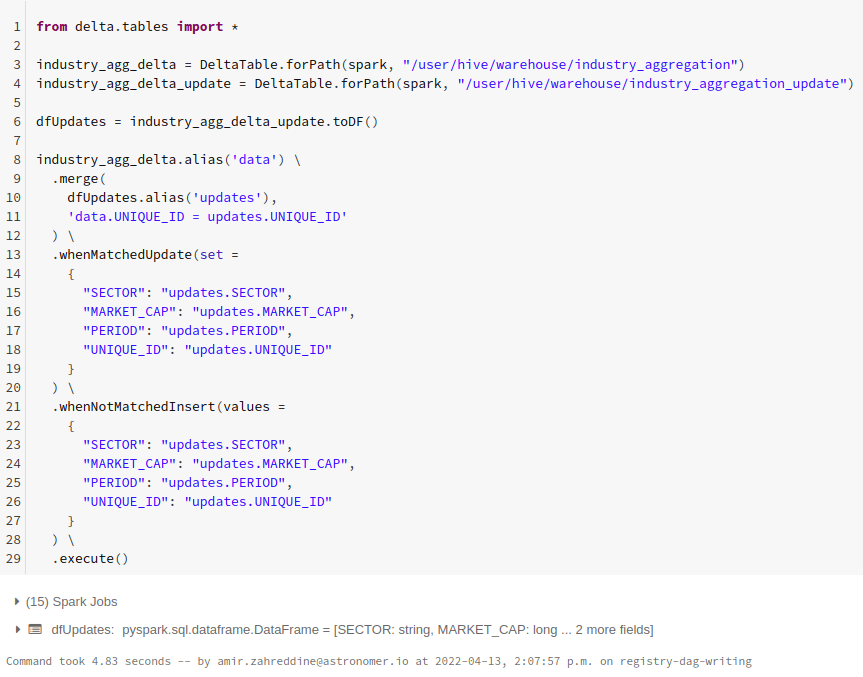
Upserting Daily Delta Table into Historical Delta Table
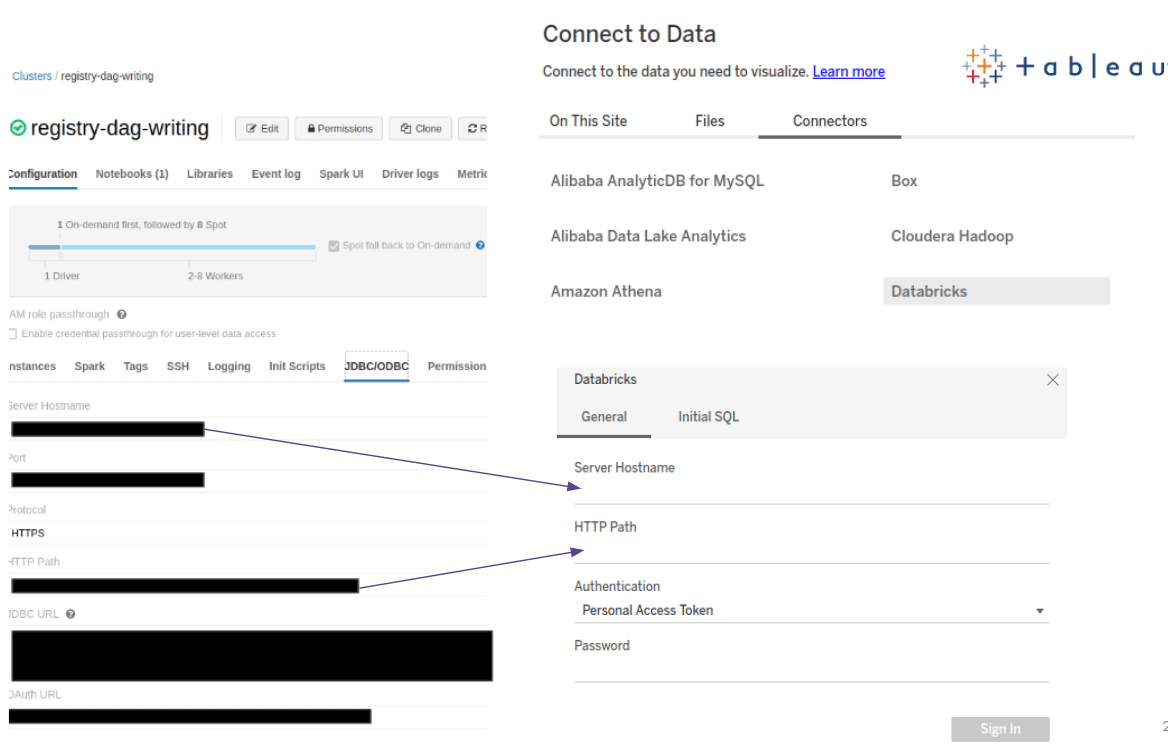
Sample data analysis Part 4: Visualize analytics in Tableau
Connecting Tableau to Databricks
Portfolio asset allocation by industry
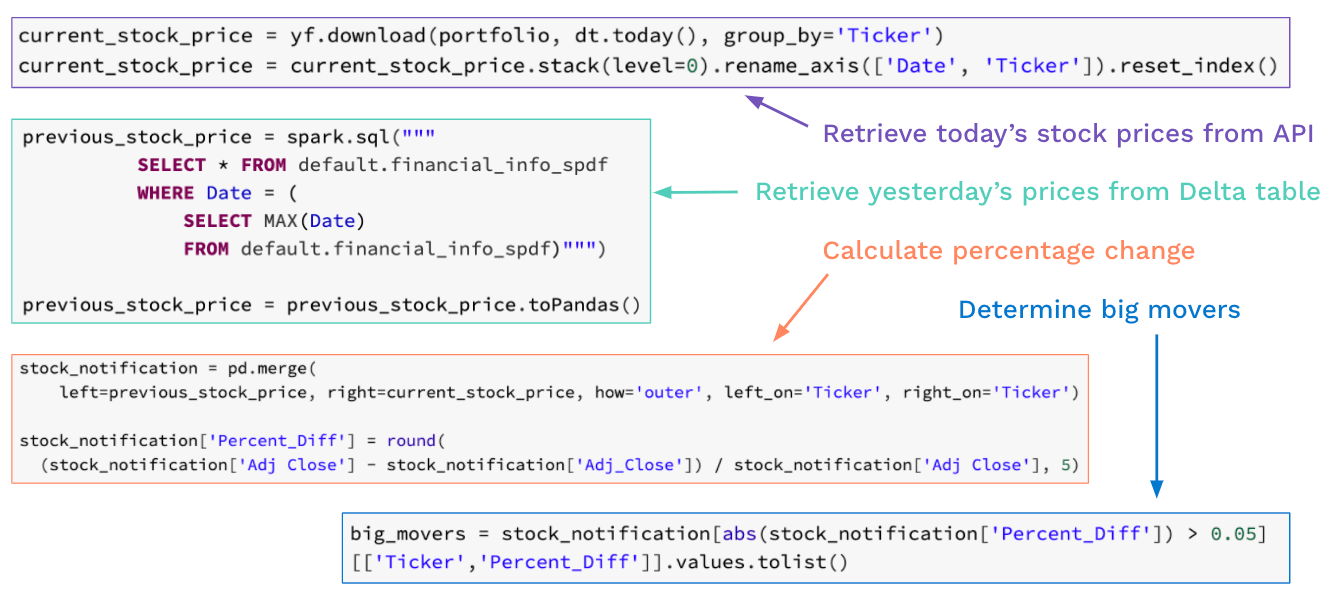
Sample data analysis Part 5: Monitoring portfolio performance & Email Notifications
Step 1. Determining the Percentage Change from Day Prior
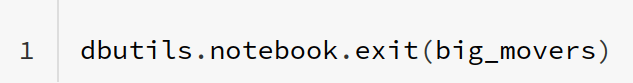
Step 2. Exiting Notebook with output data
Use dbutils.widgets.exit() to exit the notebook with data to push back to Airflow.
Step 3. Ingesting results in Airflow
This data is picked up using the DatabricksHook and assigned to the variable model_uri.
   @task
   def Retreive_Databricks_Output(id):

       # retrieve xcom data using DatabricksHook
       databricks_hook = DatabricksHook()
       model_uri = databricks_hook.get_run_output(id)['notebook_output']['result']

       return model_uri

   # Variable "Output" contains the xcom data from Databricks
   retreive_databricks_output = Retreive_Databricks_Output(run_databricks_job.output['run_id'])
Step 4. Using the BranchPythonOperator to decide whether to notify
   # Decide as to whether or not an email should be sent based on the content of Output
   branching = BranchPythonOperator(
       task_id='Check_if_Email_is_Needed',
       op_args = [retreive_databricks_output],
       python_callable=_split,
   )

   def _split(data):
       if data == "No Email Required":
           print("LOG: No big movers, no email was sent")
           return 'No_Email_Required'
       else:
           return 'Send_Email'
Step 5. Send email notification
   # Send email containing the content of the xcom
   mail = EmailOperator(
       task_id='Send_Email',
       to='your_email@gmail.com',
       subject='Daily Movers',
       html_content=retreive_databricks_output,
       )
Questions and Demo
Begins at 31:50 of the video.

Get started free.
OR
By proceeding you agree to our Privacy Policy, our Website Terms and to receive emails from Astronomer.