How We Track the Growth of Apache Airflow®
6 min read |
Astronomer is a data company. We work with open source data projects, and deliver data solutions to data-focused organizations. Every part of our company, from engineering to customer success, operates at least one data pipeline. Data is what we know.
So, naturally, we in the community team use data as a way to understand what’s happening in the open source communities and projects — Apache Airflow® and OpenLineage — that Astronomer works with closely. In this post, I’ll explore the different data sources and metrics we use to understand the current state — and history — of Airflow in particular.
Airflow Development Activity
The first area we focus on is development. We study the activity of developers in the project for many reasons, but our primary goals are to quantify how much work is happening in the project over time, compare Astronomer’s contributions with the community norm, and gauge whether activity is speeding up or slowing down.
As development of Airflow occurs mainly on Github, our primary source of information on this subject is the Github API. The information we pull from it — on commits, pull requests, issues, stars, and forks — is ingested daily via an Airflow DAG into our data warehouse.
As a starting point, we look at the number of commits in the Airflow repository over time:
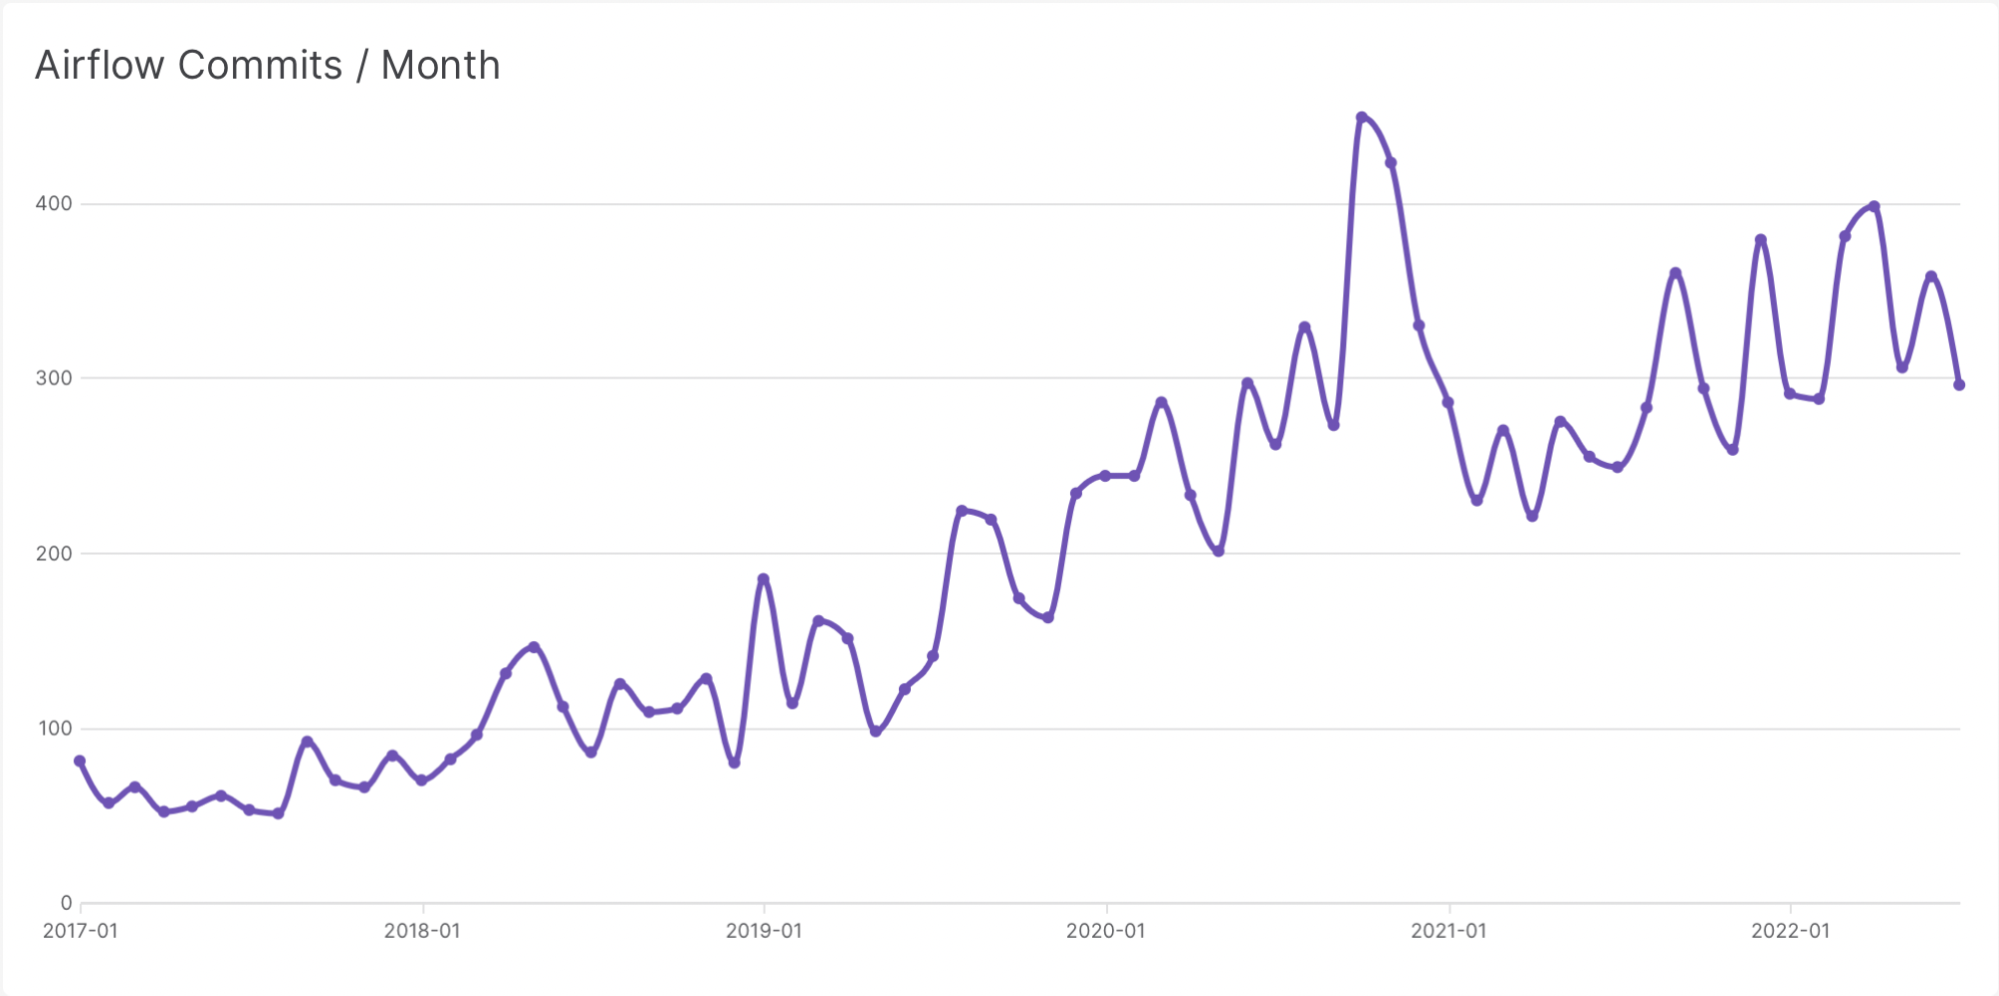
Commits are interesting, but they can represent highly variable amounts of work. Fortunately, we can measure a more atomic unit of work: the pull request.
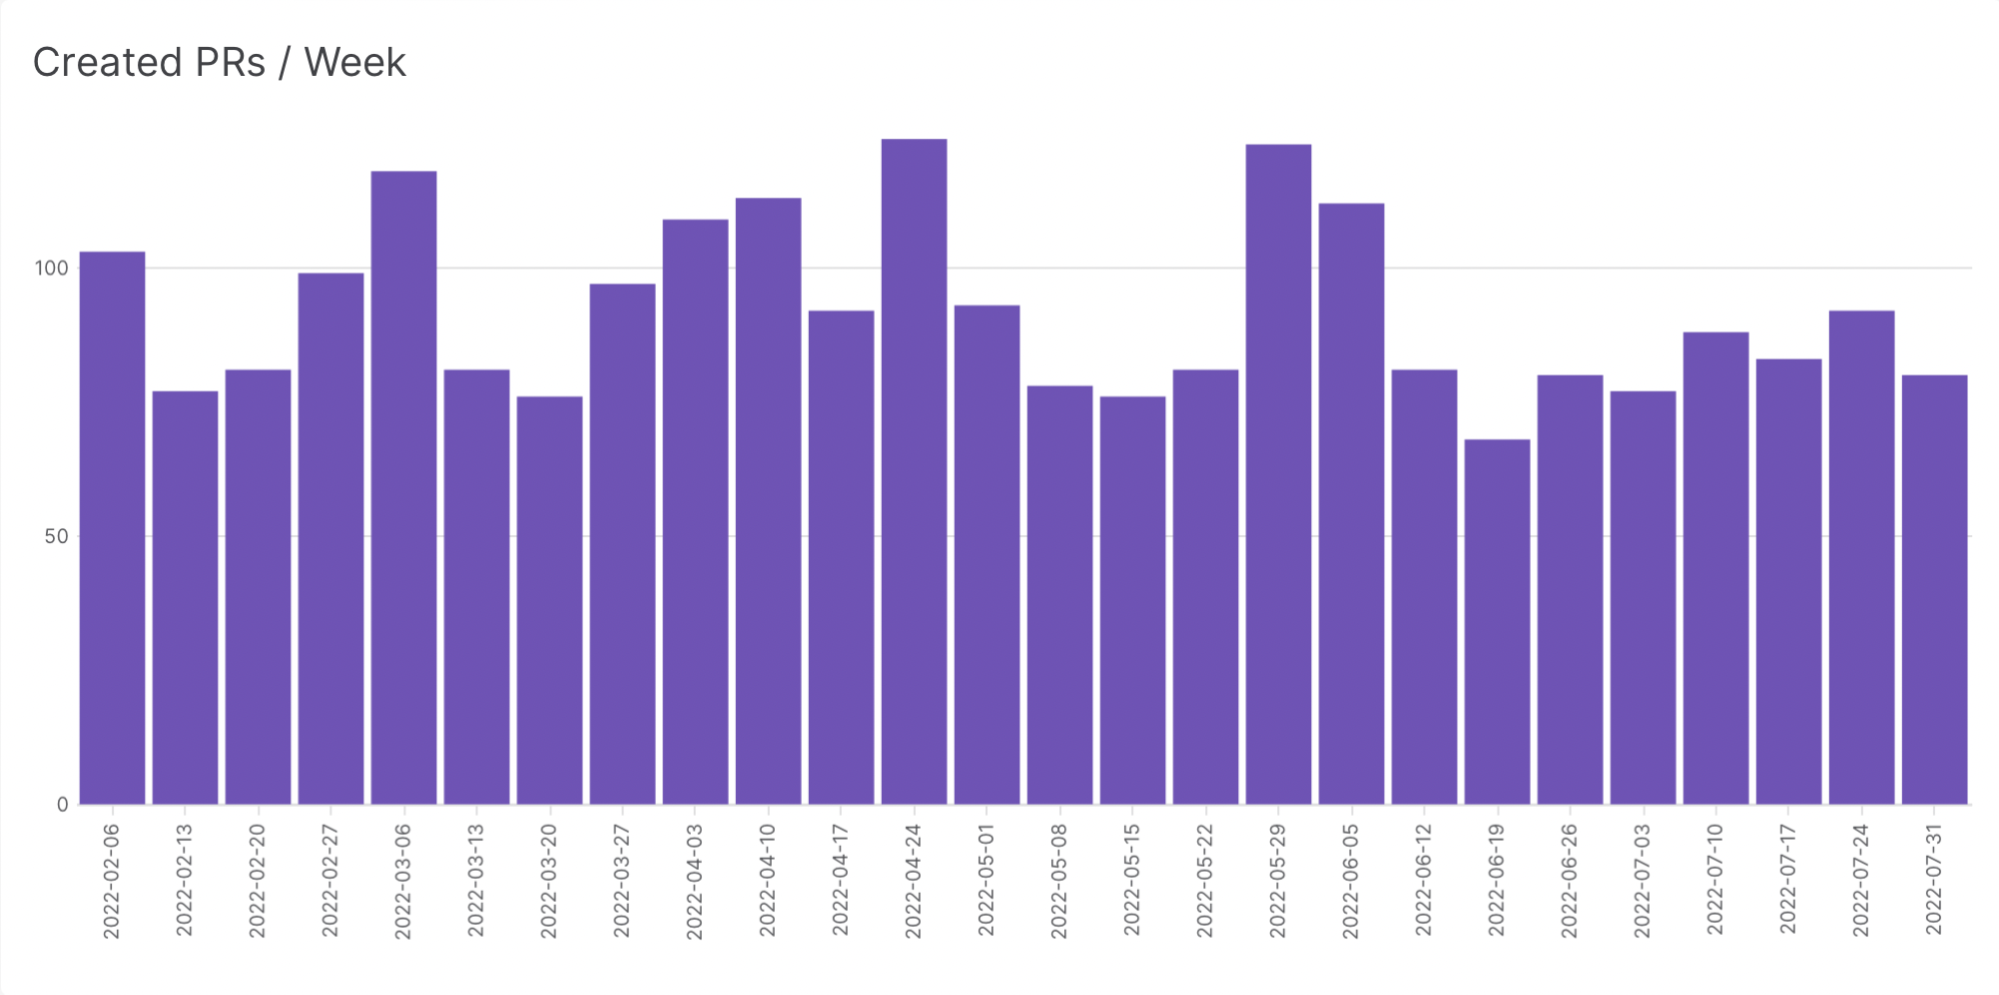
We gather metrics on the number of opened, closed, and merged pull requests nightly via the same Airflow DAG, and load them into our warehouse. That lets us see the number of created pull requests by week over the last six months:
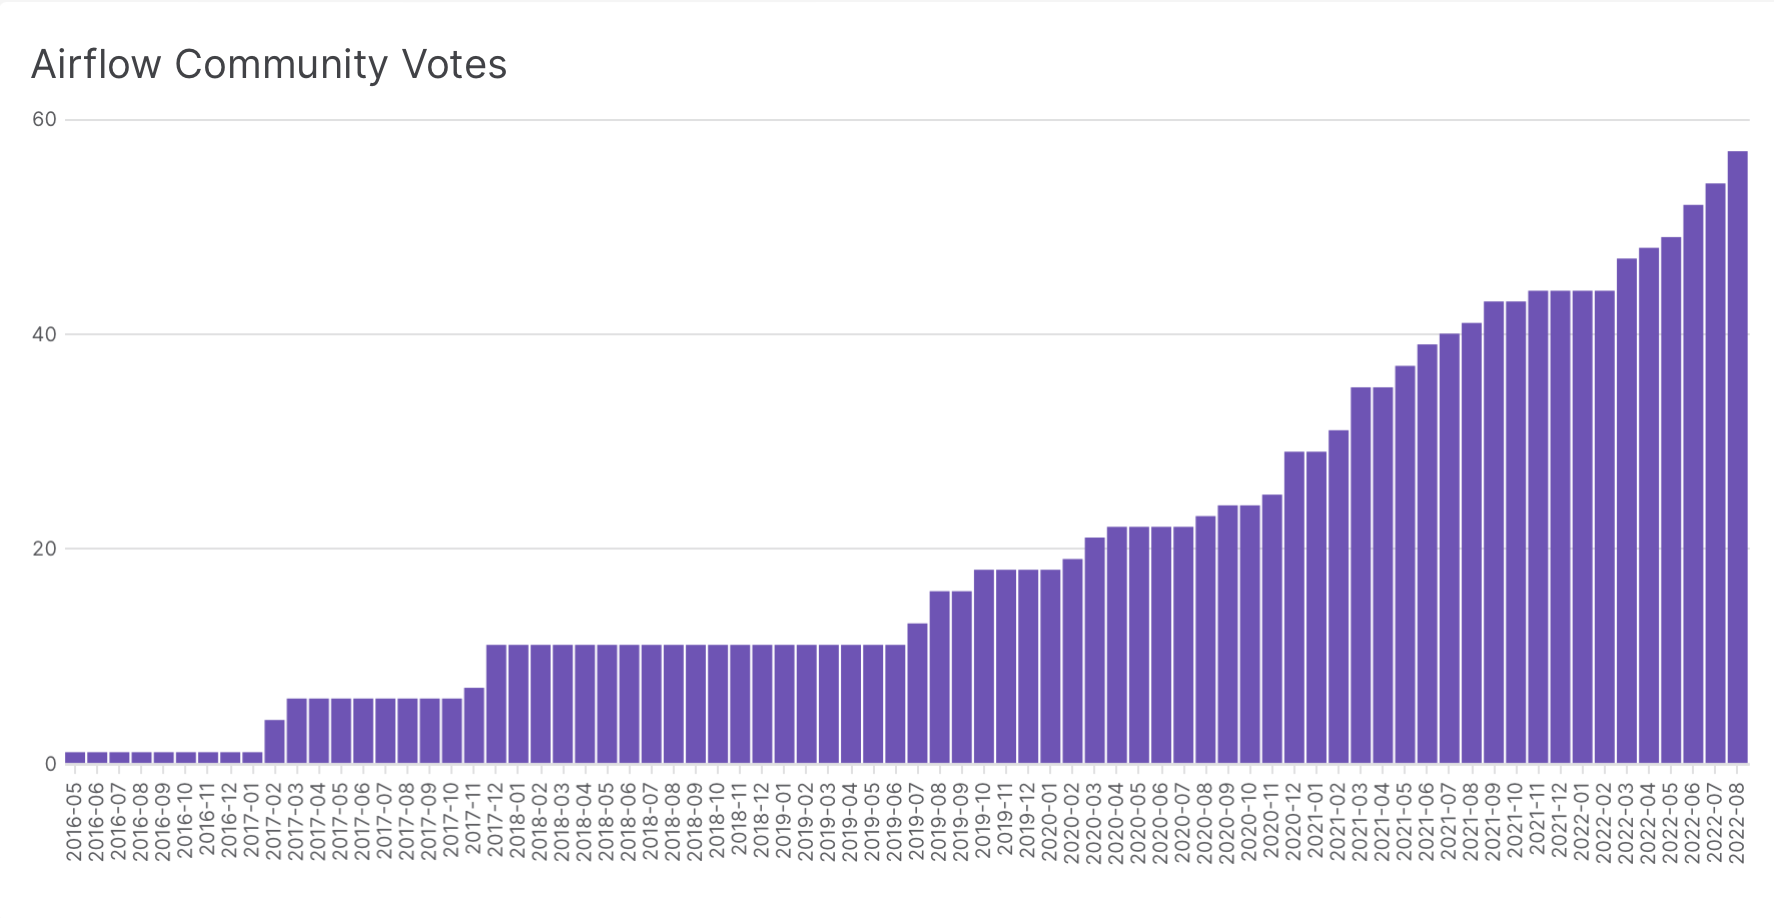
In addition to Github, we study the conversations that occur on the Airflow mailing lists. These are especially interesting because the dev list is where much of the official Apache project governance occurs. Archives are publicly available in mbox format, and we ingest messages daily via another Airflow DAG into our data warehouse. We analyze the messages looking for threads that contain “VOTE” in the subject line, as those are the ones where a community member calls for a vote.
Using these mailbox archives, we can observe the total number of votes that have been called over time:
Demand for Airflow
As you might expect, we have a keen interest in how much demand exists for Airflow. The “dream metrics” — the number of deployments running during a given day, the number of people who use Airflow — are unattainable. Once users download Airflow, they can use and redistribute it in many ways that cannot be studied through publicly available data sources. Downloads themselves, however, are easier to measure.
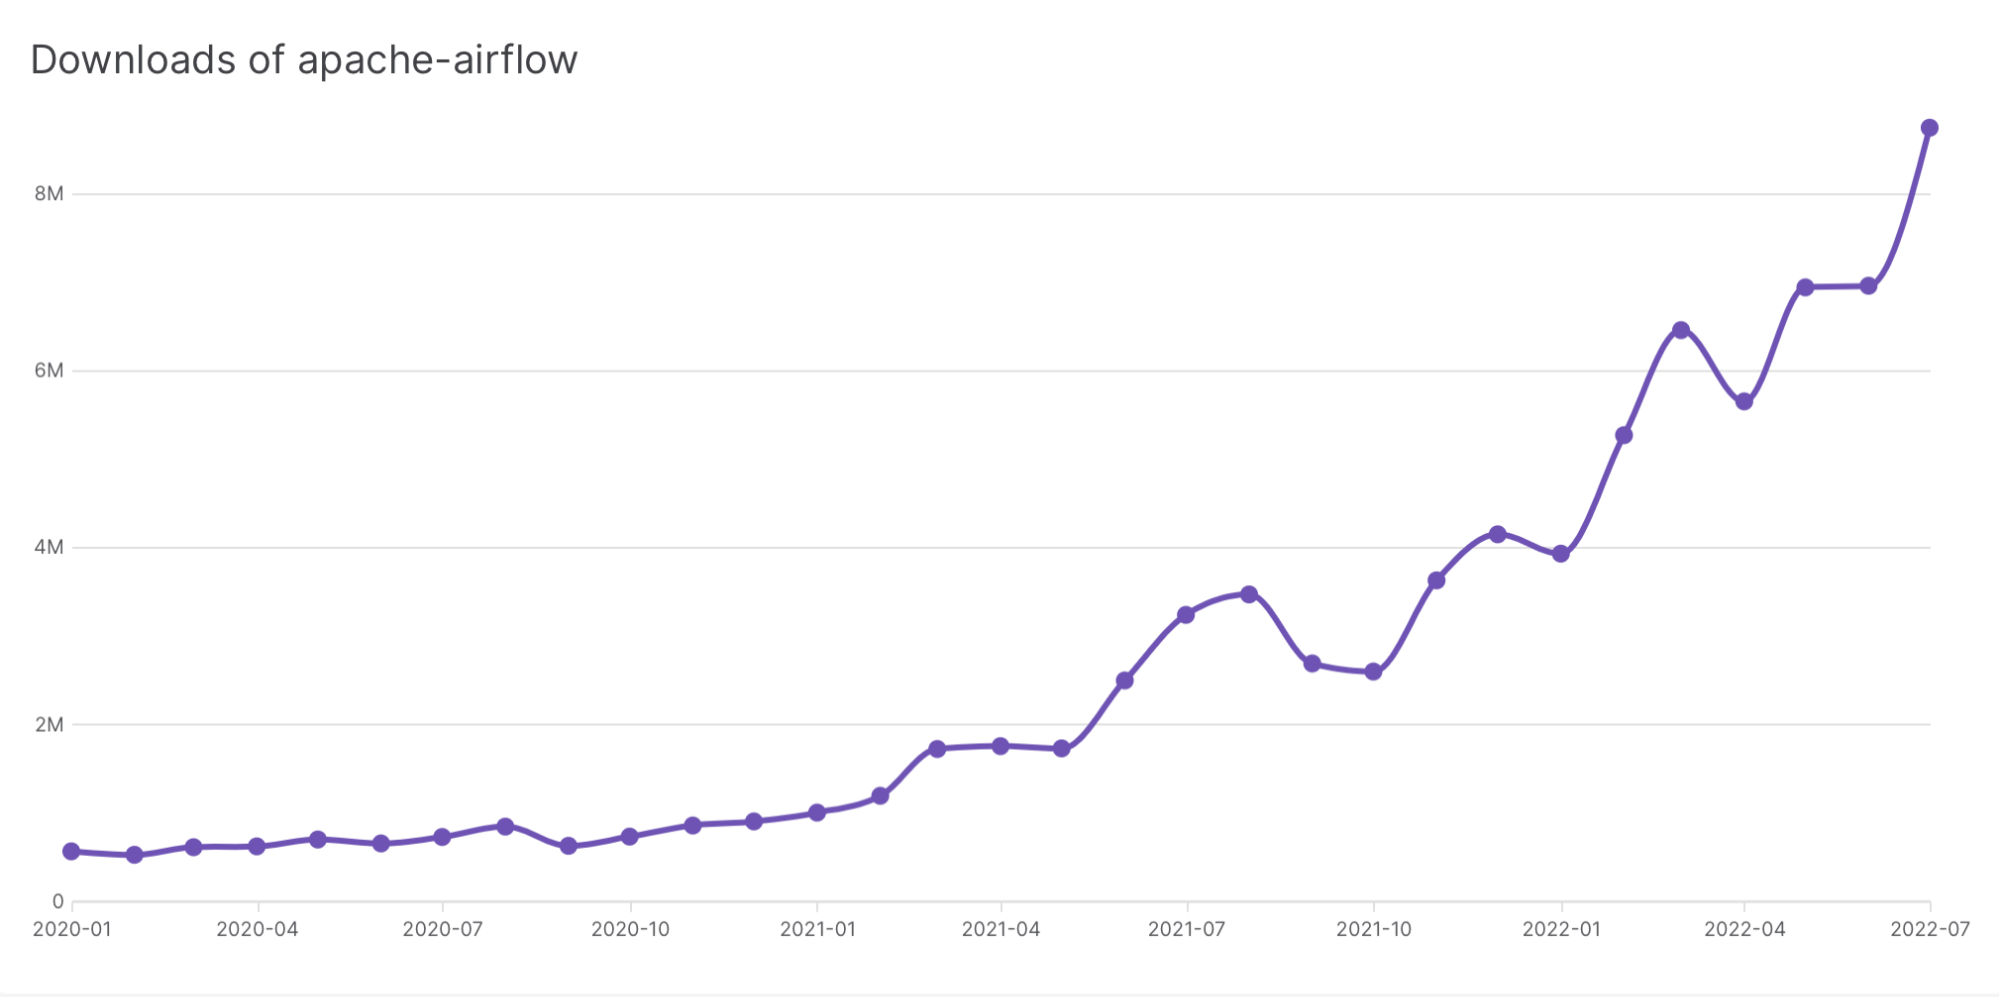
Many users of Airflow install it using pip install, so the number of downloads on the main Airflow Python package is interesting to us. We get this from the PyPI public data source in Google BigQuery, and we ingest it into our warehouse nightly using an Airflow DAG. It shows us vibrant and growing demand for Airflow’s Python package:
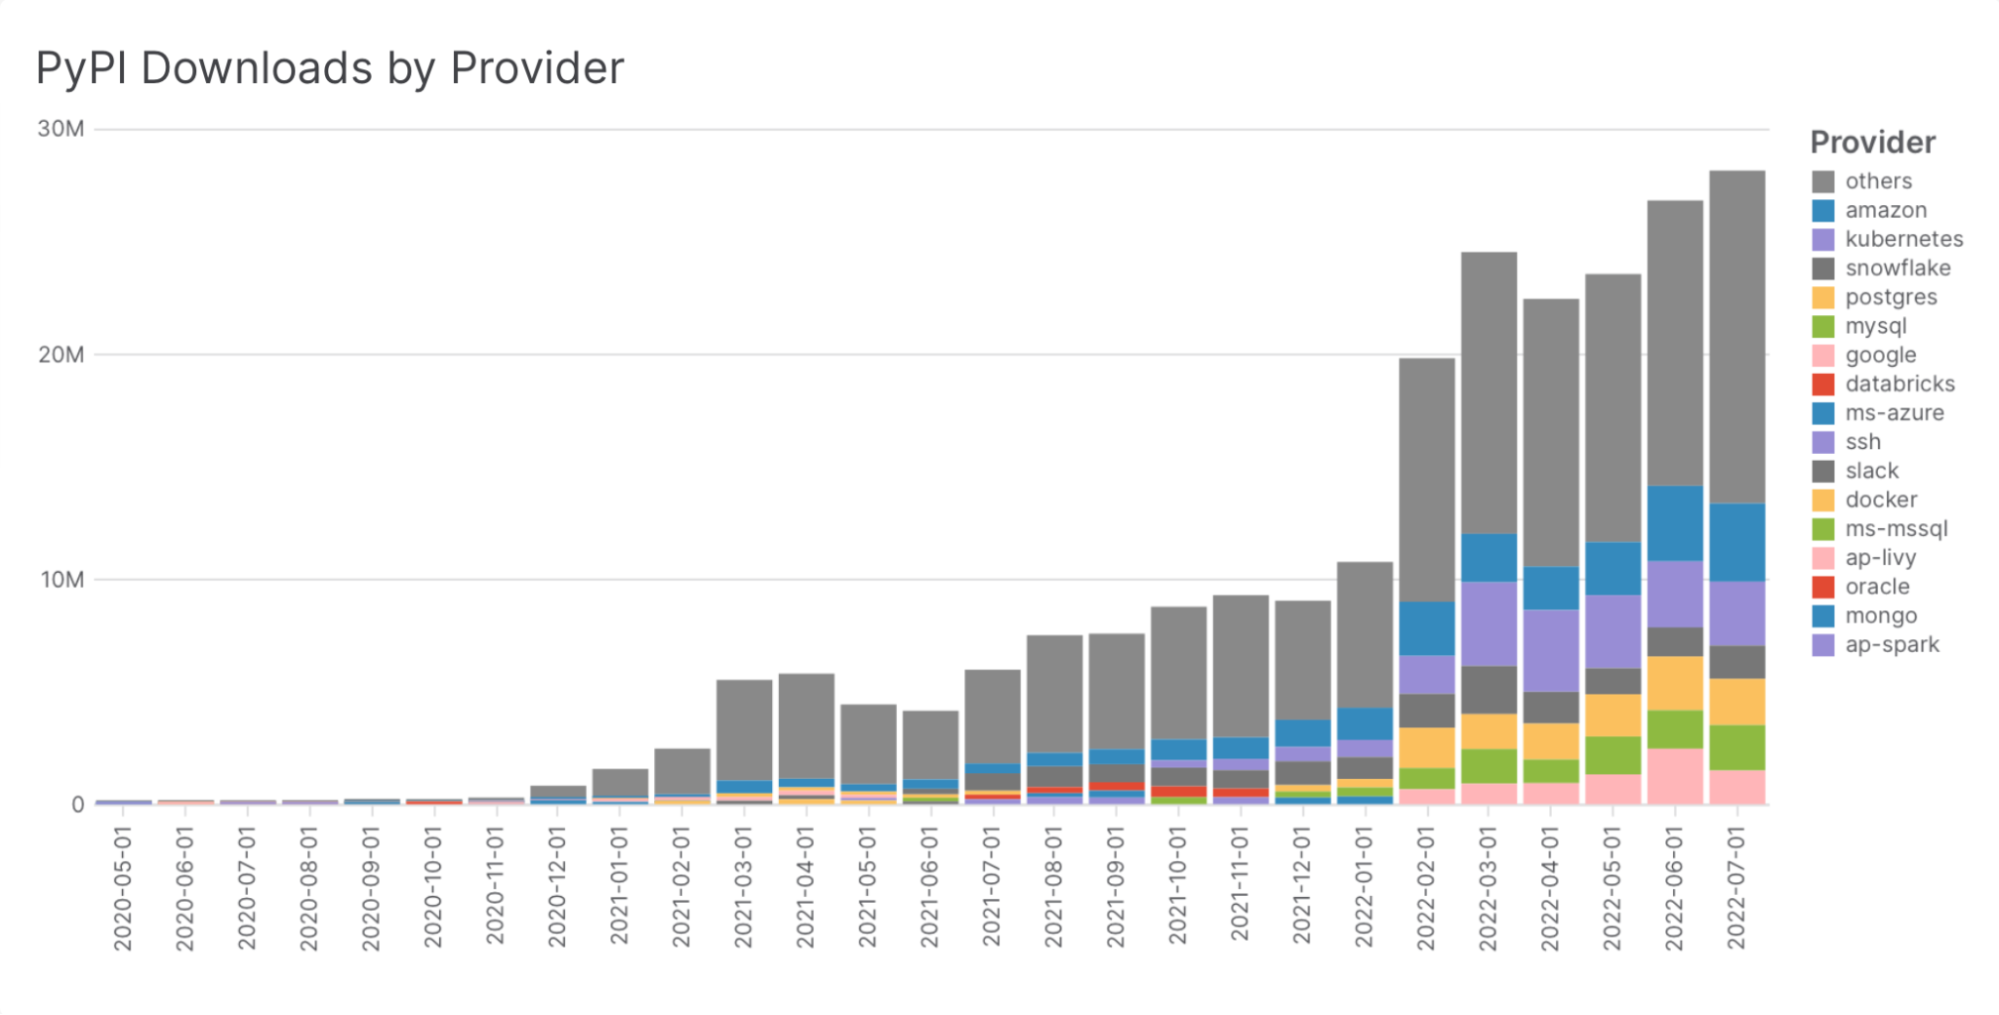
We also gather data on other Airflow packages. Studying the distribution of package downloads gives us a sense of which provider packages people are using most and, therefore, the systems people are using alongside Airflow most frequently:
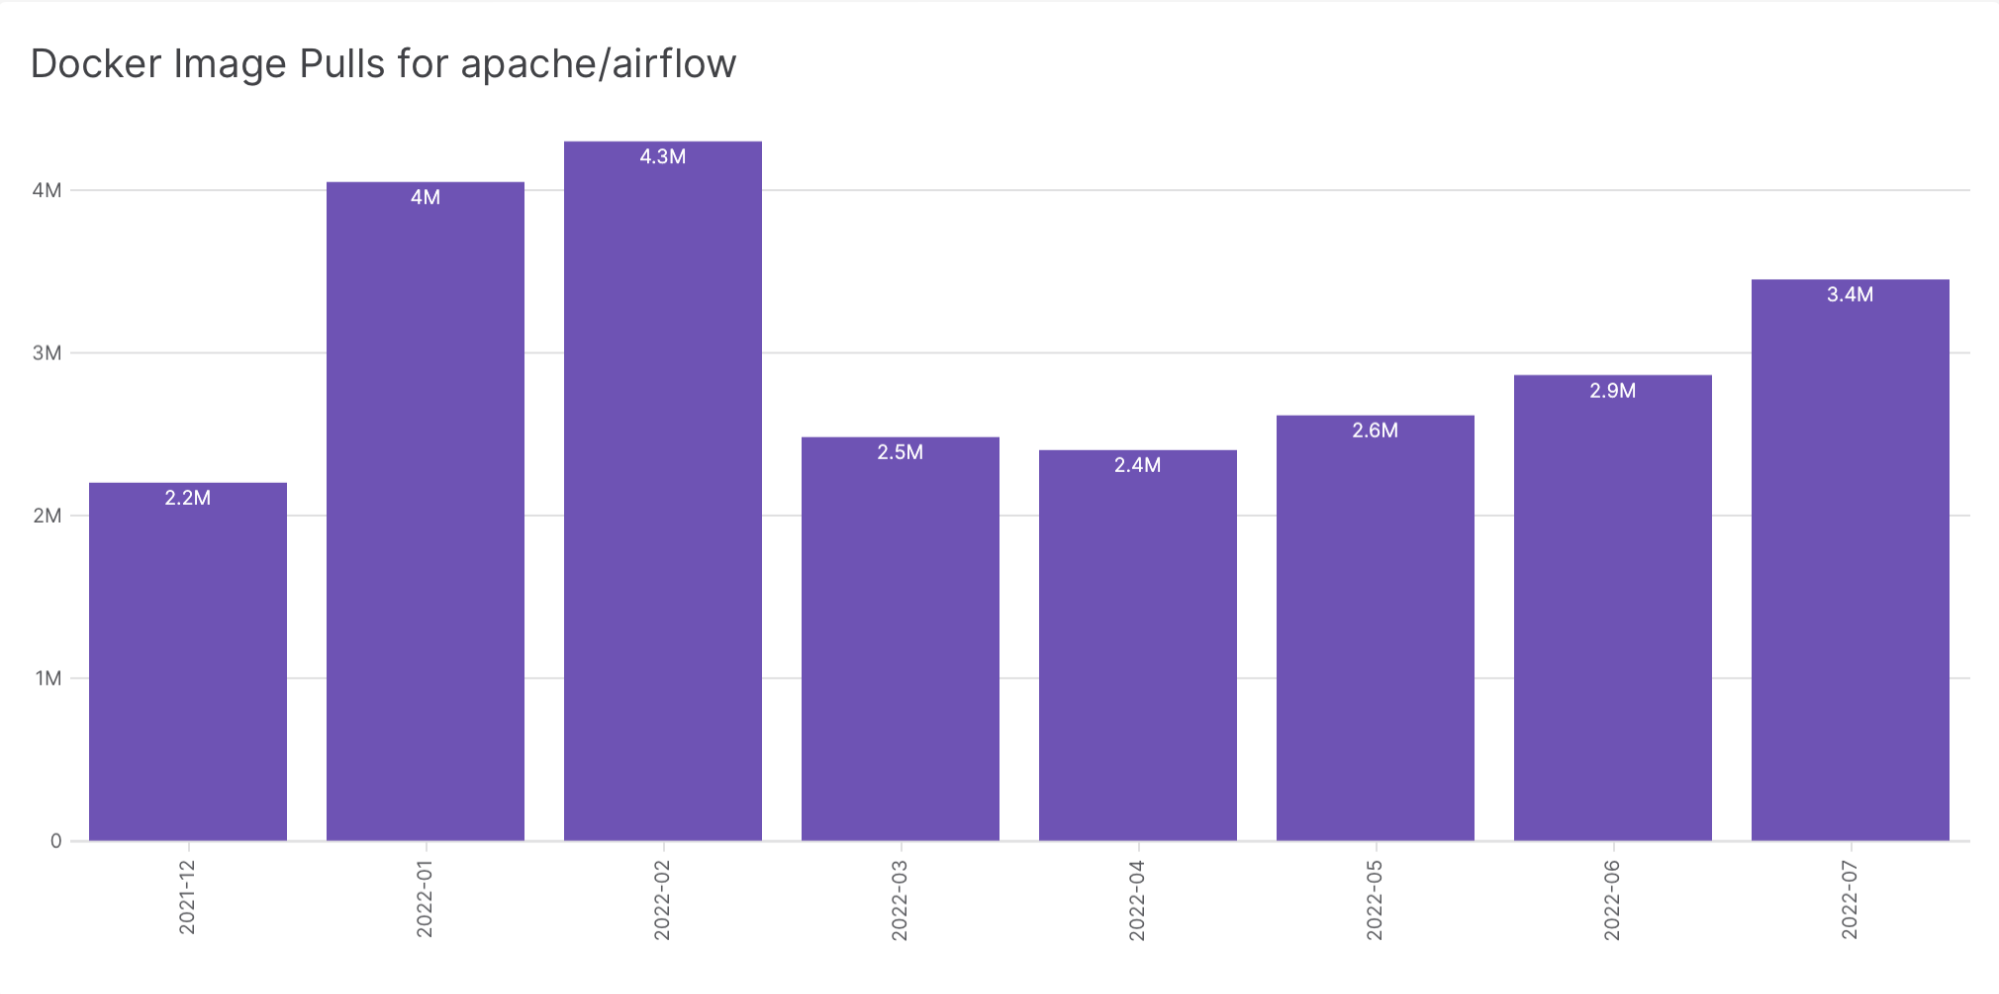
Since the community maintains an official Airflow Docker image, with accompanying Helm chart and docker-compose.yaml, many users also install Airflow using that instead of Python packages. Fortunately, Docker Hub’s public API provides the number of total pulls for an image. We snapshot this every day and load it into our warehouse with — you guessed it — another Airflow DAG:
These are big numbers. They are fun! They are in the “hamburgers served” realm. They boost morale and establish a “high water mark” for the community to celebrate. And we want a really comprehensive metric to summarize demand, one that befits a community with the vibrancy and ubiquity of Airflow.
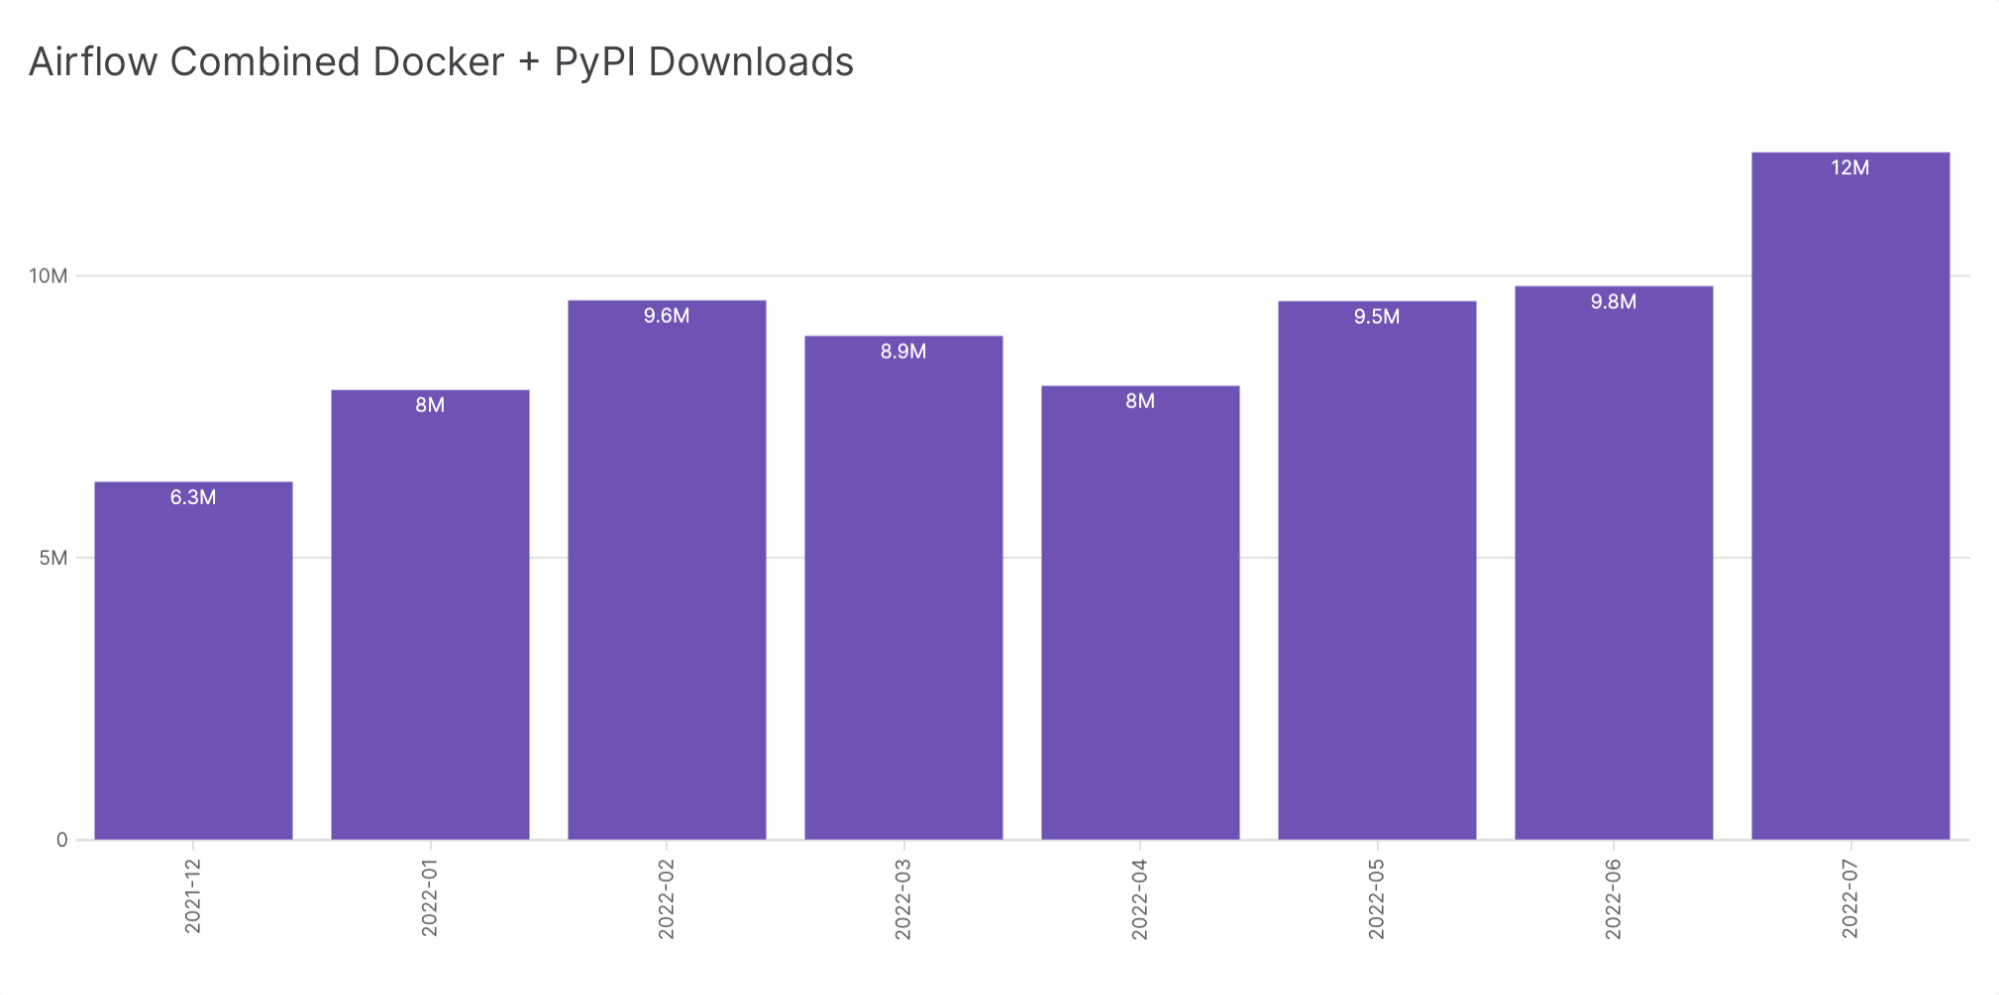
So when we say “Airflow downloads” in our content and materials, we mean the sum of Docker Hub image pulls for apache/airflow and PyPI package downloads for apache-airflow. This is not a complete number by any means — users can set up private package repos or image registries, install from a Github clone, or distribute Airflow directly within their organizations — but it is a big, growing number we can all celebrate:
Airflow’s Community Population
We also like to know whether the community is growing or shrinking, in terms of actual people as opposed to the activity they produce. Because the Airflow project produces complex software that covers a variety of use cases, we feel it’s important for it to have a sizable set of opinions and experiences to draw upon. A large community with a diverse enough perspective can easily overcome even the most complicated challenges.
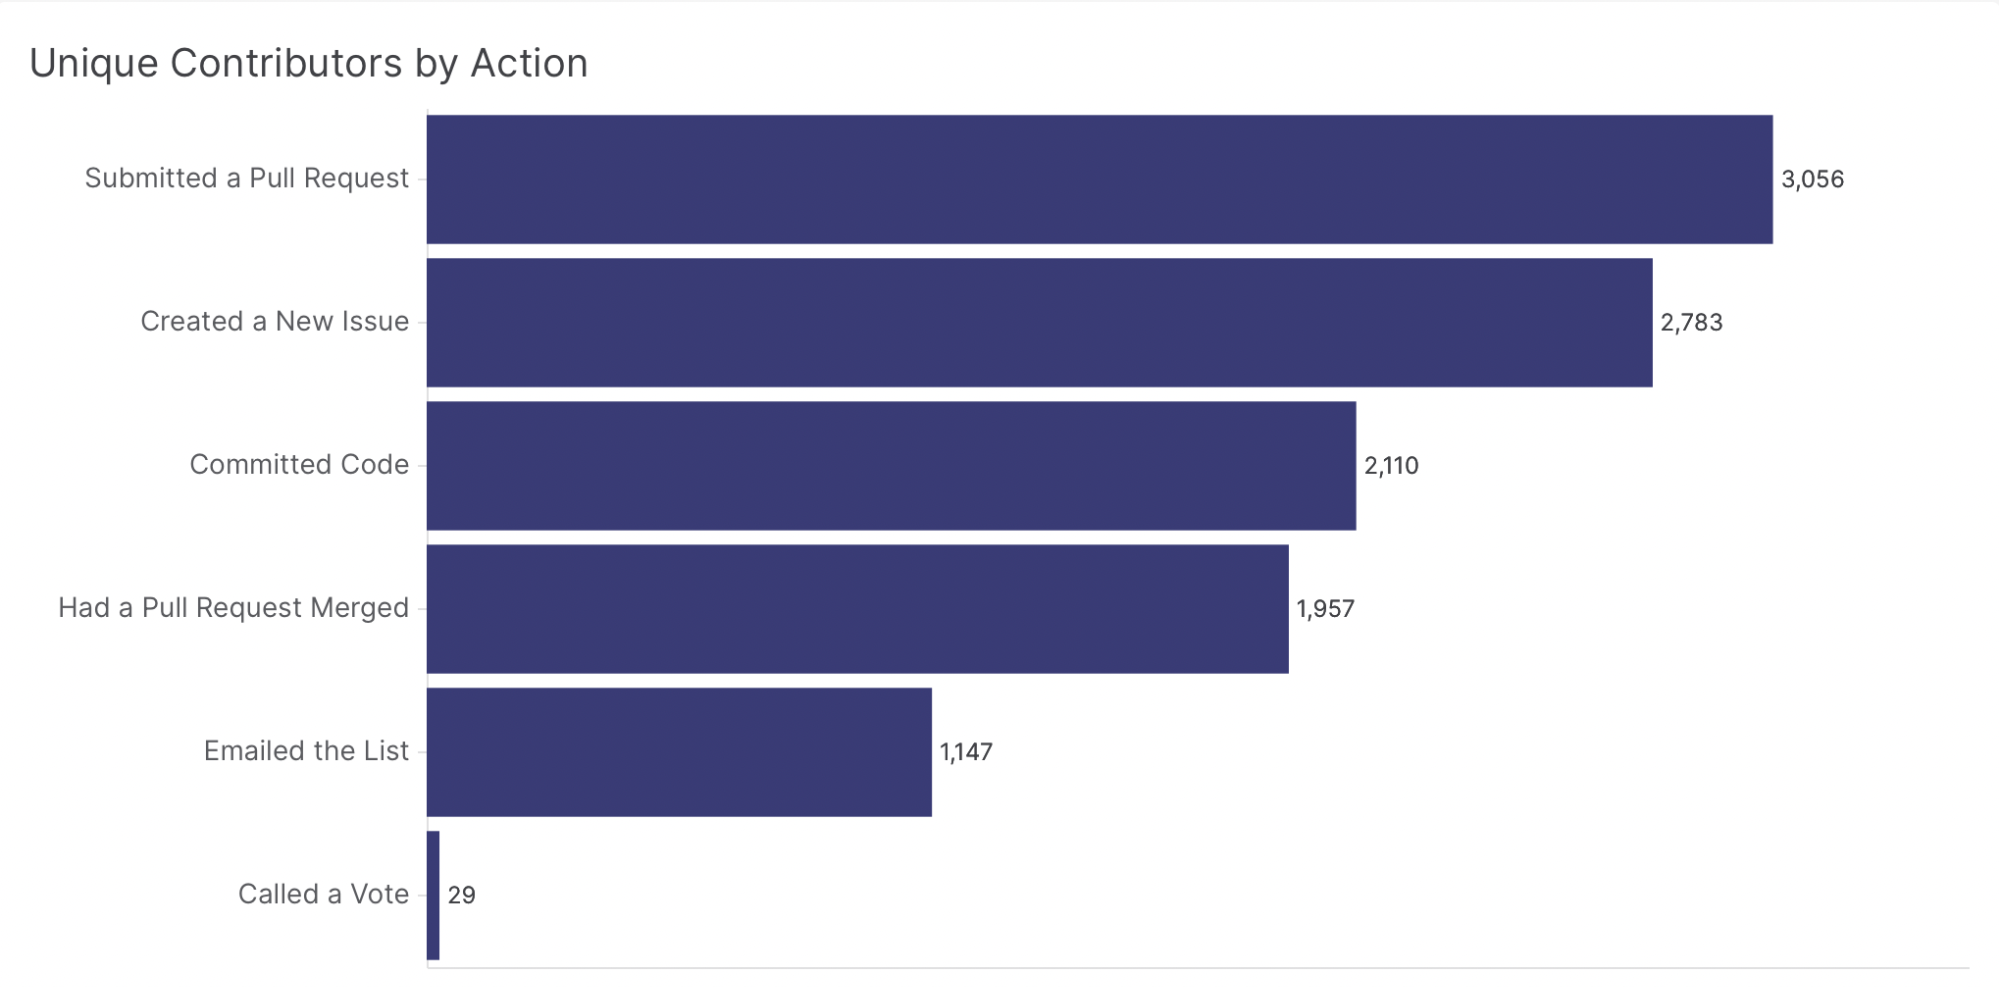
The first thing we study is the number of individuals who have committed code in the Airflow repository. We then look at the number who have created an issue, the number who have submitted a pull request, and the number who have merged a pull request. We also study the number of people who have created messages on the dev@airflow.apache.org and users@airflow.apache.org mailing lists, and whether it’s growing or shrinking over time. This is all done with an Airflow DAG that parses public Github APIs and Apache Software Foundation mailbox archives, loading data into our warehouse.
This gives us a (very) rough sense of the number of individuals in each sphere of participation:
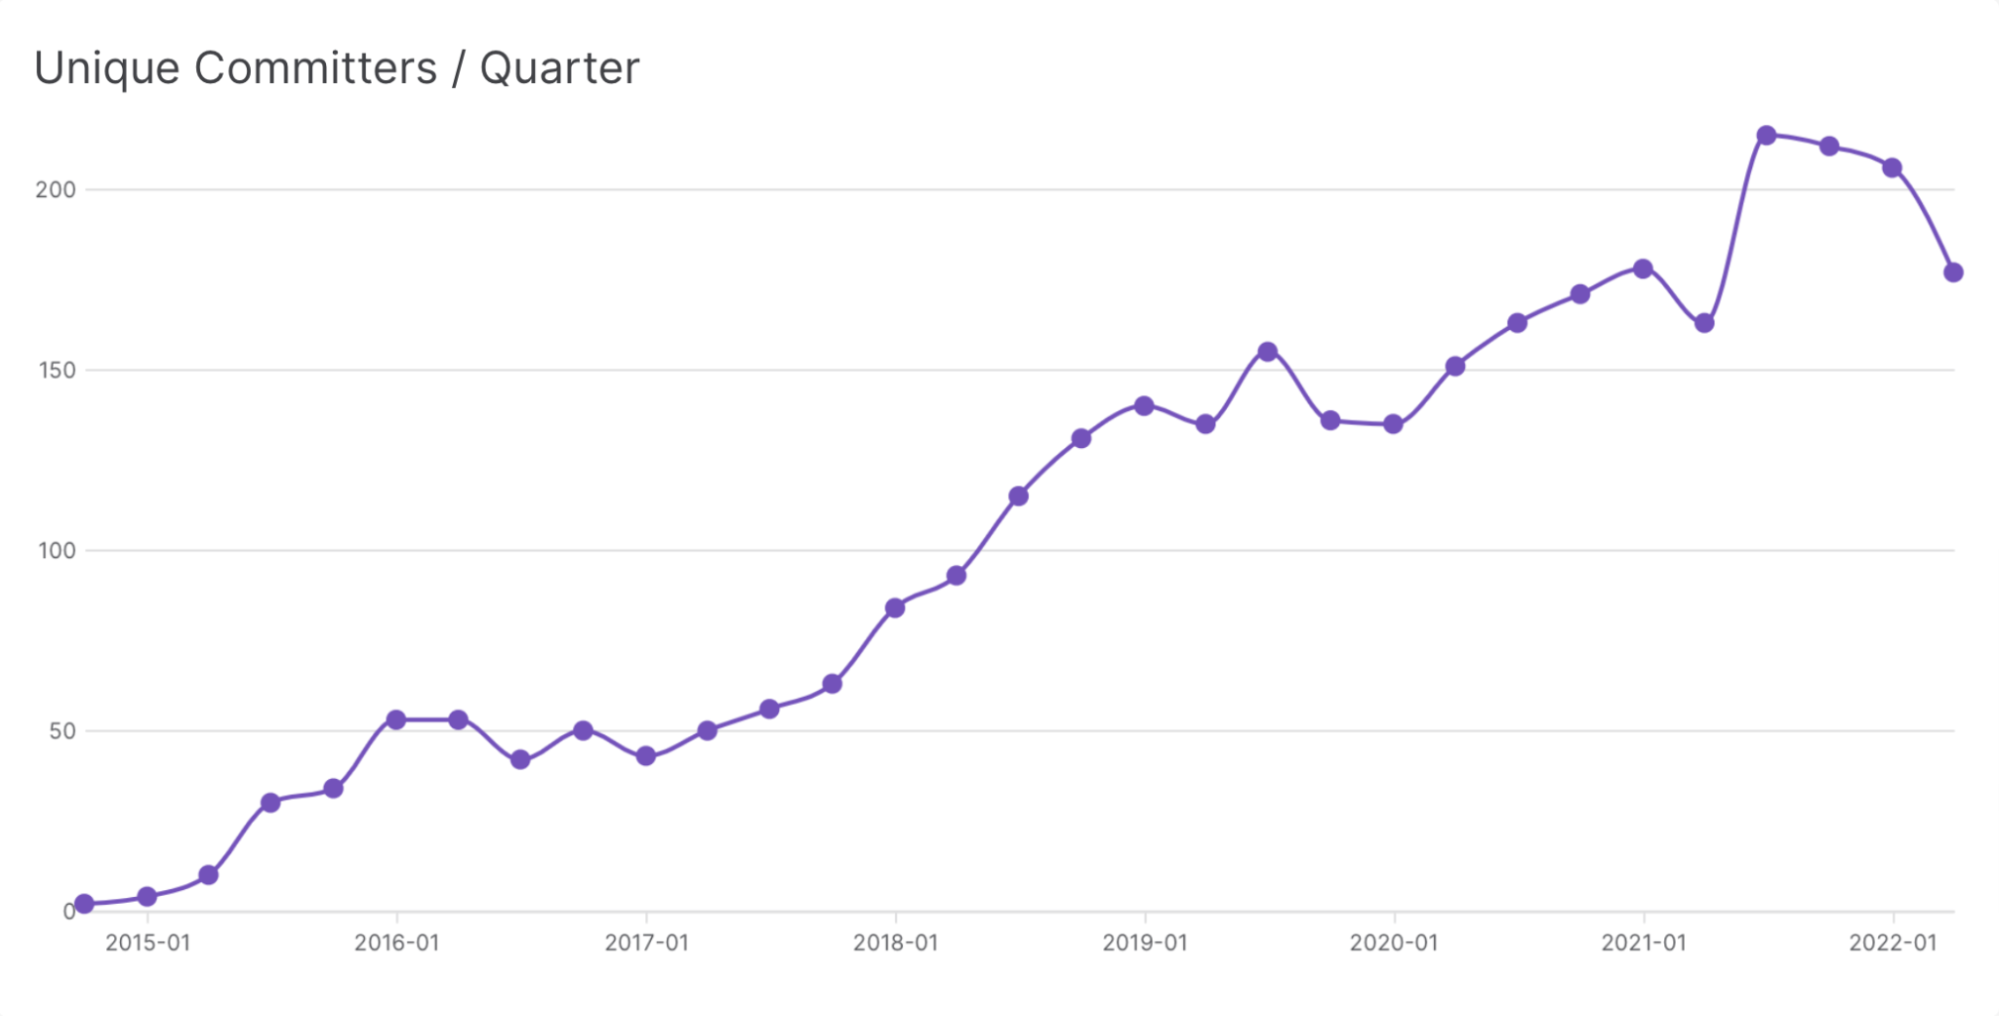
It also allows us to view population trends over time. For example, we can see that the community of code-writers within Airflow is steadily growing by looking at unique committers by quarter:
The largest of Airflow’s populations is on Slack, however, where there are (as of this writing) just over 25,000 registered users. This is one metric we currently do not automatically retrieve; when we use it in content or materials, it has been gathered from the Slack user interface at a particular moment. (For key content, we update it regularly.)

Get Started With Airflow
These metrics were all gathered with simple Airflow DAGs using the gusty framework, which helps us manage them and provides a framework for streamlined authoring. You, too, can study the open source projects you care about — or anything, really — using Airflow.
Our new (and free) ebook, “Apache Airflow® 101: Essential Concepts and Tips for Beginners,” is a great way to start. Become one of the millions served and take one of the most advanced and flexible orchestration platforms for a spin.

Get started free.
OR
By proceeding you agree to our Privacy Policy, our Website Terms and to receive emails from Astronomer.