5 Ways to View and Manage DAGs in Airflow
4 min read |
The Airflow user interface (UI) is a handy tool that data engineers can use to understand, monitor, and troubleshoot their data pipelines. Most Airflow users are already familiar with some of the insights the UI provides into DAGs and DAG runs through the popular Graph view. But the Airflow UI has other powerful views as well, and recent Airflow releases have brought innovations to existing views and added new features that make Airflow more connected, usable, and observable than ever.
Below we take a quick look at the most popular views in the Airflow UI.
Airflow DAGs View
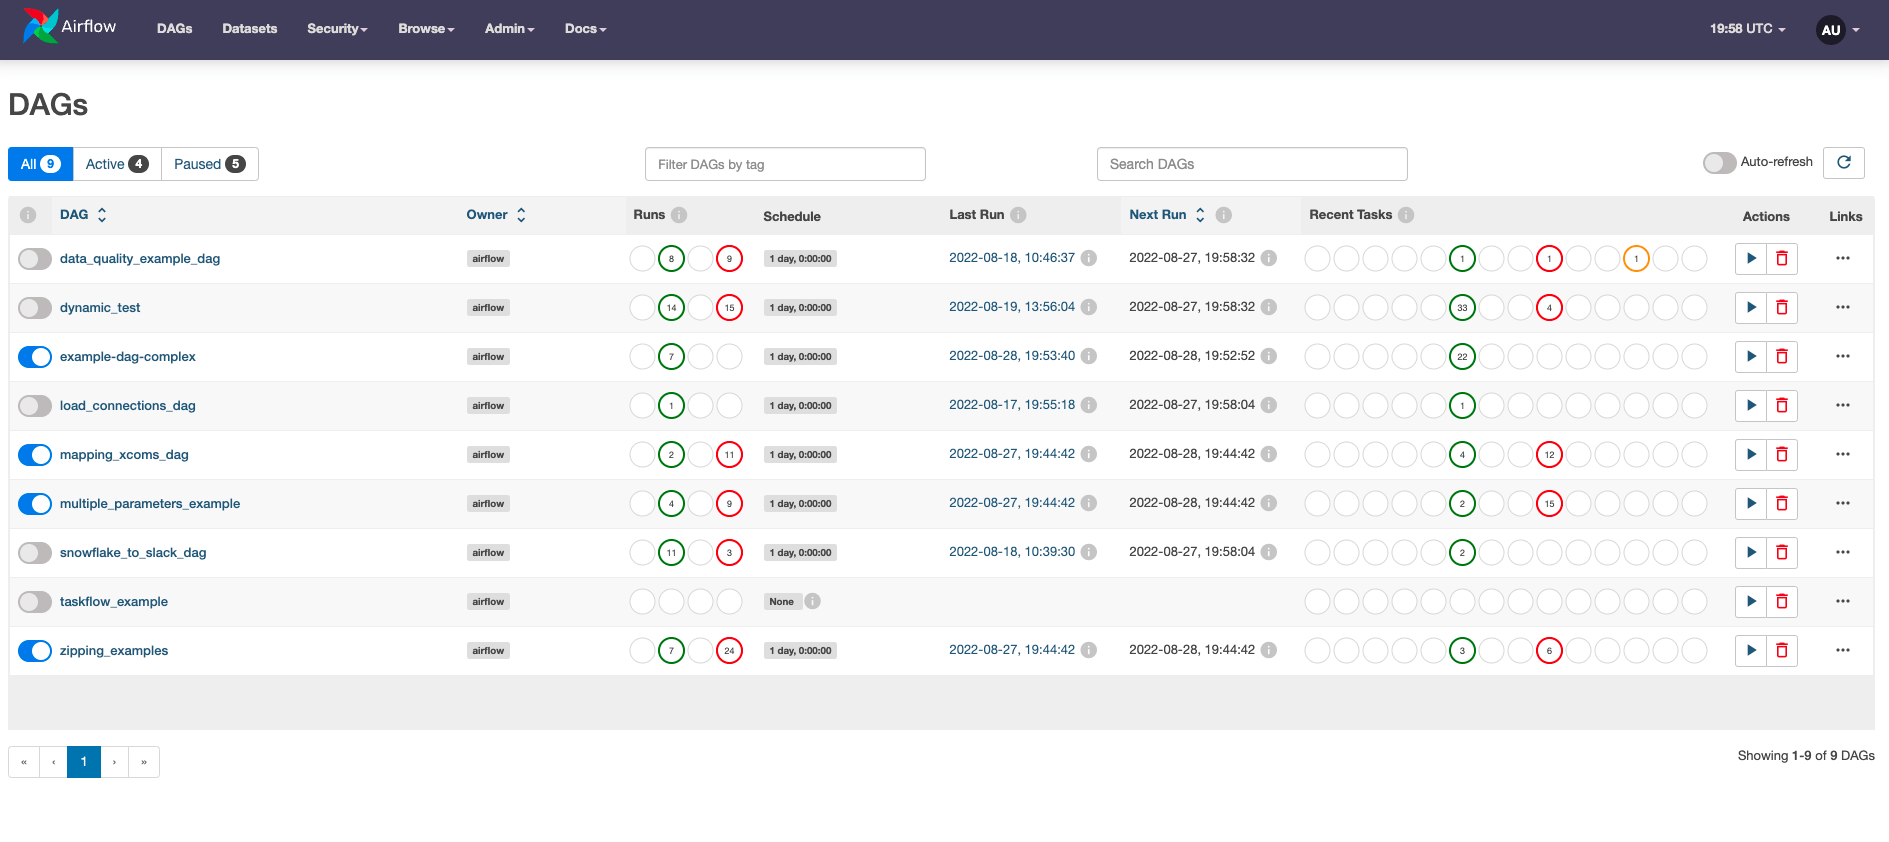
Figure 1: The Airflow DAGs view (current as of Airflow 2.5).
The DAGs view is the main view in the Airflow UI. The best way to get a high-level overview, it shows a list of all the DAGs in your environment. For each one, you can see the status of recent DAG runs and tasks, the time of the last DAG run, and basic metadata about the DAG, like the owner and the schedule. This view has undergone significant changes in recent Airflow updates, including an auto-refresh feature that allows you to view status updates of your DAGs in real-time.
See more detail on the DAGs view.
Airflow Graph View
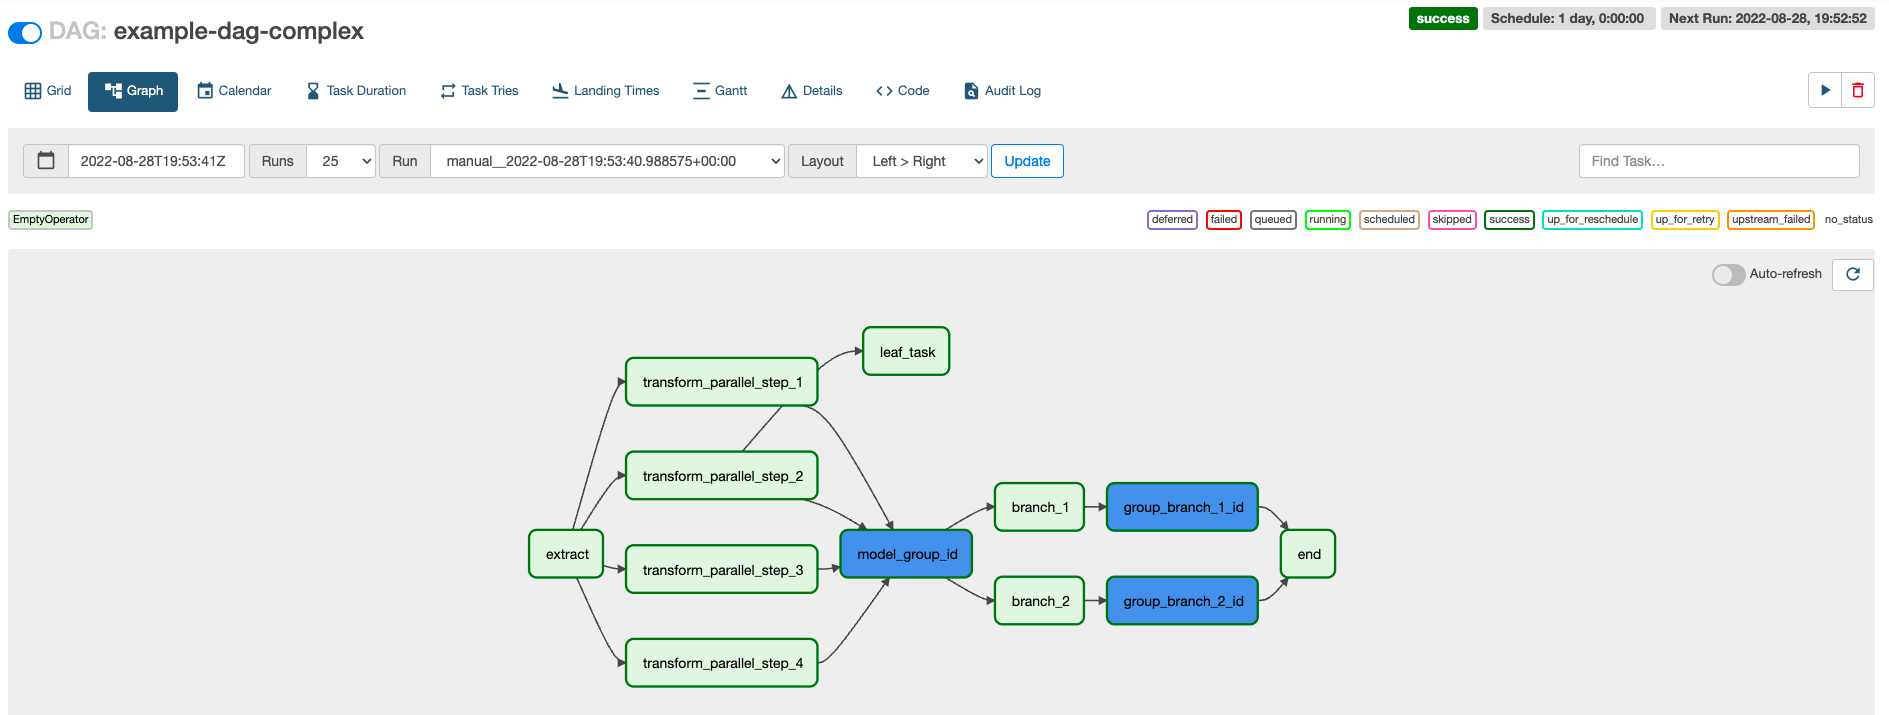
Figure 2: The Airflow Graph view (current as of Airflow 2.5).
The Graph view shows a visualization of the tasks and dependencies in your DAG and their current status for a specific DAG run. It’s the easiest way to see a graphical view of what’s going on in a DAG, and is particularly useful when reviewing and developing DAGs. It also lets you see real-time task status updates with the auto-refresh feature.
Clicking on a specific task in the Graph view launches a modal window that provides access to additional information, including task instance details, the task’s metadata after it has been templated, the logs of a particular task instance, and more.
See more detail on the Graph view.
Airflow Grid View

Figure 3: The Airflow Grid view (current as of Airflow 2.5).
The Grid view (which replaced the former Tree view) shows a grid representation of a DAG’s previous runs, including their duration and the outcomes of all individual task instances. Each column represents a DAG run, and each square represents a task instance in that DAG run. Task instances are color-coded according to their status. Small icons at the top of the DAG run columns indicate whether a run was triggered manually or by a dataset update.
See more detail on the Grid view.
Airflow Calendar View
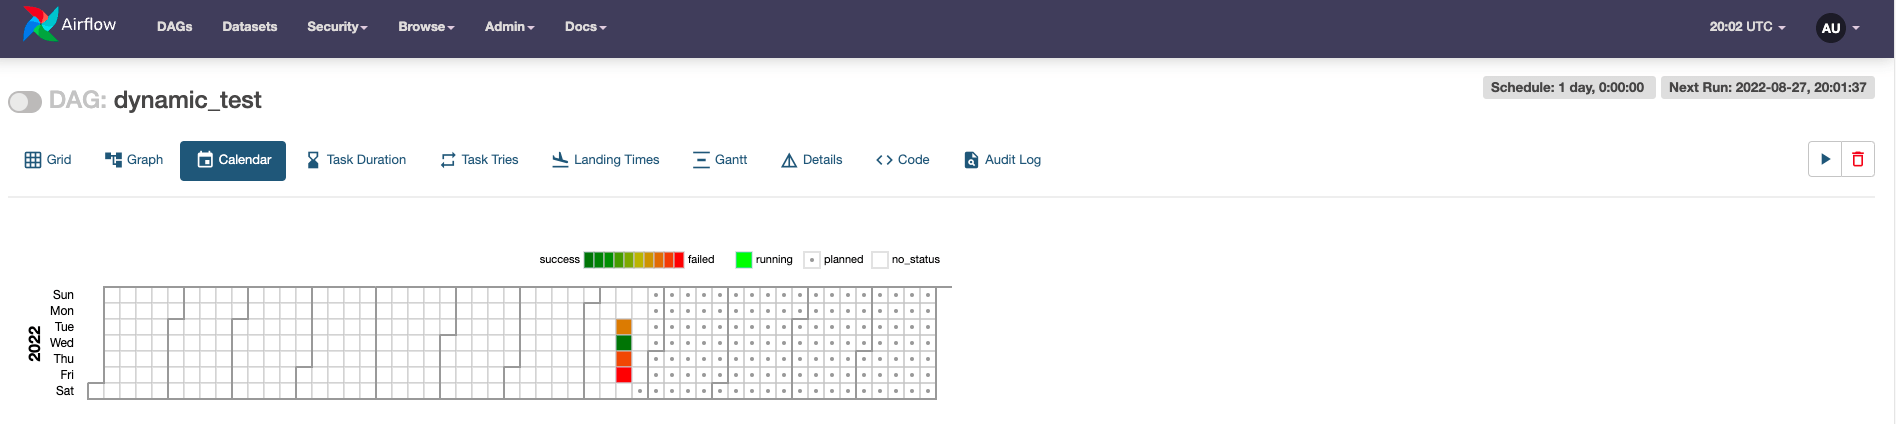
Figure 4: The Airflow Calendar view (current as of Airflow 2.5).
The Calendar view shows the state of DAG runs on a given day or days, displayed on a calendar. States are represented by color. If there were multiple DAG runs on the same day with different states, the color shows the average state for the day, on a color gradient between green (success) and red (failure).
See more detail on the Calendar view.
Airflow Browse Tab
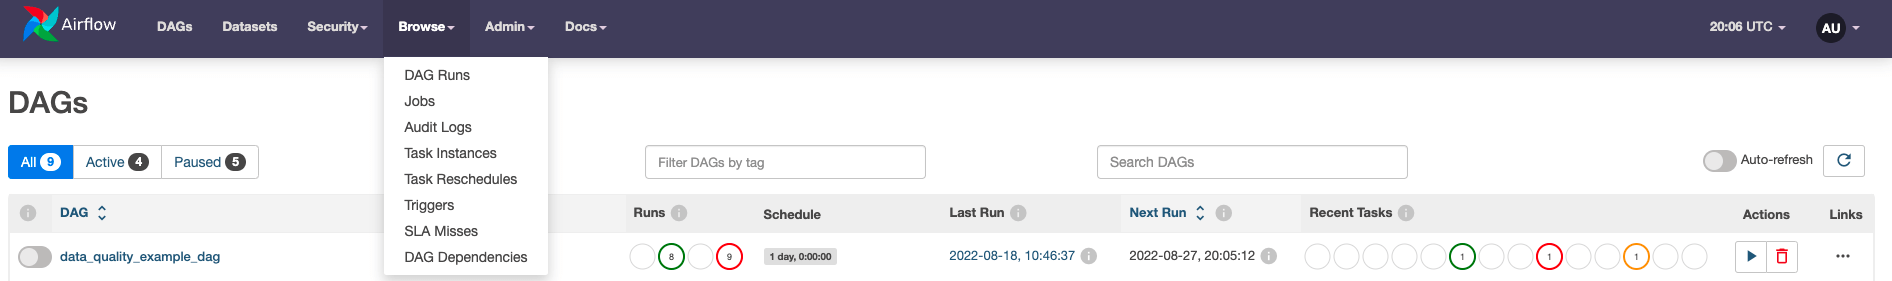
Figure 5: The Airflow Browse tab (current as of Airflow 2.5).
Under the Browse tab, there are several additional ways to view your DAGs. These include the Task Instances view, which shows all your task instances for every DAG running in your environment and allows you to make changes to task instances in bulk.
Another helpful view is the DAG Dependencies view, which shows a graphical representation of any dependencies between DAGs in your environment. Any time you have DAG dependencies defined through a dataset, an external task sensor, or a trigger DAG run operator, you can see those dependencies in the DAG Dependencies view.
See more detail on the Browse tab.
Get More Information About the Airflow UI
Interested in learning more about how you can view your DAGs and DAG runs in the Airflow UI? You can find detailed information in Astronomer’s "Introduction to the Airflow UI" documentation.

Get started free.
OR
By proceeding you agree to our Privacy Policy, our Website Terms and to receive emails from Astronomer.