What is Data Observability?
7 min read |
A guide to understanding data observability, why it matters, and how modern teams are using it to deliver trusted, reliable data at scale.
Introduction
Data observability is the ability to monitor, understand, and troubleshoot the health of data as it moves through complex systems. It helps data teams detect issues early, resolve them faster, and deliver data that’s accurate, timely, and reliable.
In an environment where pipelines are growing more complex and expectations for trust in data are rising, observability has become a critical part of the modern data stack.
But what does data observability actually involve? And how can you tell the difference between simple monitoring and true, actionable observability?
In this guide, we’ll explain what data observability is, why it’s important, and how to evaluate potential observability solutions based on your needs.
Why Data Observability Matters
Today’s businesses rely on data to power dashboards, train machine learning models, run experiments, and make business critical decisions. That reliance means any data failure, like a delayed pipeline, broken schema, or silent null values, can lead to missed opportunities or eroded trust across the business.
As data ecosystems grow more distributed across cloud warehouses, orchestration and ETL platforms, and self-service tools, the risk of silent data failures increases. Infrastructure and application monitoring tools track system performance, but they don’t detect data-specific issues. Even modern data observability platforms often focus on anomalies within the warehouse, surfacing problems only after data has landed.
What’s missing is visibility into how data is created and moved. Without insight into upstream pipelines, task execution, and transformations, teams are left reacting to symptoms rather than addressing the root cause.
Data observability addresses this gap by helping teams detect anomalies, trace issues across the data lifecycle, and maintain trust in the data powering their business.
The Five Pillars of Data Observability
Data observability helps teams understand not just whether data is present, but whether it’s accurate, timely, and ready for use.
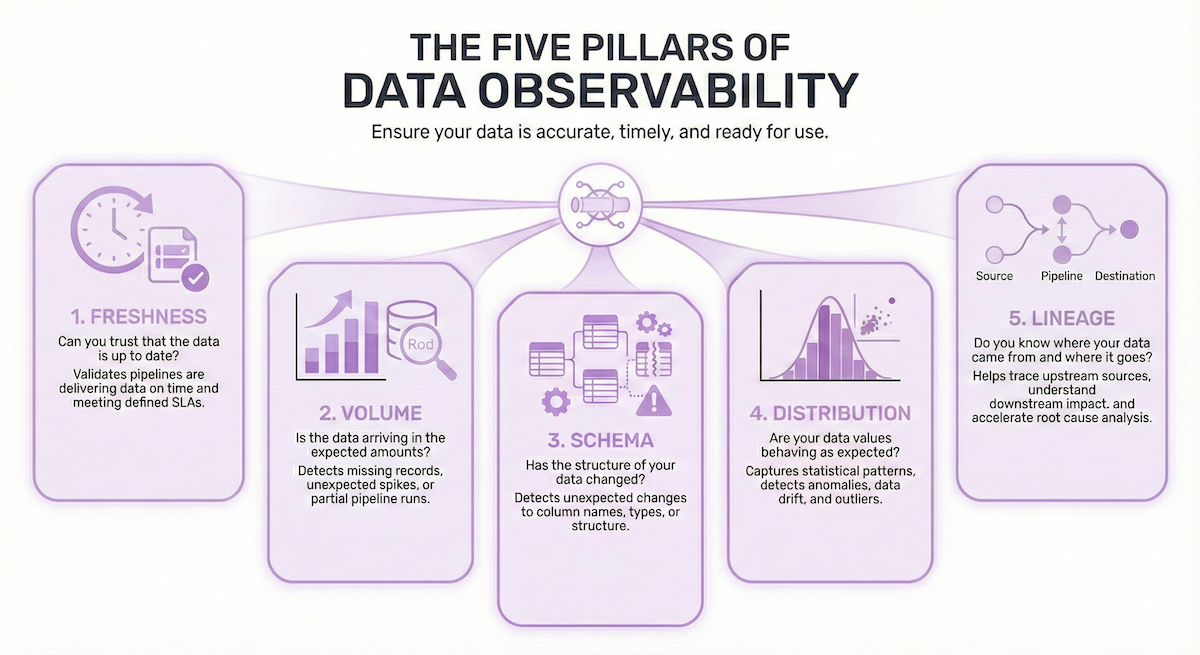
To provide complete coverage, most modern observability frameworks rely on five key pillars:
1. Freshness Can you trust that the data is up to date? Freshness checks validate that pipelines are delivering data on time and meeting defined SLAs. This is especially critical for dashboards, operational reporting, and ML workflows that depend on daily or hourly data.
2. Volume Is the data arriving in the expected amounts? Volume metrics help detect missing records, unexpected spikes, or partial pipeline runs by validating row counts against historical baselines.
3. Schema Has the structure of your data changed? Schema checks detect unexpected changes to column names, types, or structure that could break downstream transformations, dashboards, or models.
4. Distribution Are your data values behaving as expected? Distribution metrics capture statistical patterns in your data, such as range, mean, standard deviation, or frequency of values. These checks help detect anomalies, data drift, and outliers that could affect downstream models or decisions. This pillar is especially important for ML and analytics teams monitoring production data pipelines.
5. Lineage Do you know where your data came from and where it goes? Lineage shows how data moves through your pipelines, helping teams trace upstream sources, understand downstream impact, and accelerate root cause analysis when issues occur.
Why Orchestration Context Matters
For teams running Apache Airflow, pipelines aren’t just scheduled jobs—they’re the foundation of how data products are created, delivered, and maintained across the business.
Airflow often powers business-critical workflows such as:
- Daily reporting and dashboard refreshes that support executive and operational decision-making
- Product analytics pipelines that drive personalization, pricing, and performance optimization
- Machine learning workflows including feature engineering, model retraining, and inference deployment
- Financial and compliance reporting that demands accuracy, auditability, and strict SLAs
- Data delivery workflows that publish curated datasets to external platforms or downstream systems
In these environments, data reliability isn’t optional. A single failed task or missed SLA can disrupt dashboards, delay decisions, or impact customer-facing systems.
That’s why context from the orchestration layer, where pipelines actually run, plays a critical role in delivering trusted data.
The Limits of Observability Without Orchestration
Most traditional observability tools focus on downstream systems like cloud data warehouses. While these tools can detect schema drift, null values, or row count anomalies, in the data warehouse they often lack critical information:
- Which pipeline generated the table?
- When did the task last run, and did it succeed?
- What else depends on this data product?
Without orchestration context, teams are forced to piece together lineage manually, jump between tools to fill in gaps, or rely on alerting that’s disconnected from execution reality. This slows down root cause analysis and increases the risk of delayed or broken data delivery.

What Orchestration-Native Observability Unlocks
By combining observability with orchestration, teams get a clearer picture of not just what went wrong, but why, and where to fix it.
An orchestration-native approach connects data health metrics to task execution, pipeline lineage, and SLAs. This enables:
- Earlier detection of pipeline issues before they reach the warehouse
- Faster root cause analysis tied to task runs and upstream dependencies
- More meaningful alerts that reflect business-critical data products, not just raw tables
- Clearer visibility for platform and data engineering teams into how pipelines are performing and where issues originate
If your organization relies on Airflow to orchestrate mission-critical data workflows, observability needs to start there too. Otherwise, you’re only seeing half the picture, and being notified after issues have already spread.
What Makes Orchestration-Native Observability Different
Once you recognize that data issues often originate upstream, it becomes clear: observability needs to be embedded where pipelines are defined and executed—not tacked on after the fact.
Unlike standalone tools that operate downstream or outside the orchestration layer, an orchestration-native approach provides visibility starting from where the data journey begins—the Dags, tasks, and dependencies that define how your data products are built and delivered.
By connecting task execution, lineage, SLAs, and data health in one environment, orchestration-native observability helps teams:
- Detect issues earlier—often before data ever reaches the warehouse
- Resolve problems faster, with full pipeline context
- Understand downstream impact in real time through lineage
- Reduce the need for stitching together insights across multiple tools
- Align engineering, analytics, and platform teams around shared visibility
For organizations scaling Airflow across multiple teams or business units, this approach also supports consistent reliability practices, clearer ownership, and faster delivery of trusted data products.
Real-World Use Cases for Data Observability
Data observability isn’t just a monitoring layer, it's a critical part of delivering trusted, business-ready data. Here are a few ways teams are putting it into practice:
Ensuring on-time delivery of critical data products Track SLAs and freshness for executive dashboards, product analytics, or ML pipelines. Get alerted before issues cause downstream disruption.
Detecting and resolving pipeline failures Surface failed tasks, retry loops, and bottlenecks with full execution context. Reduce incident response time and prevent missed deadlines.
Troubleshooting broken or stale dashboards Quickly trace data quality issues like null values or schema drift back to the pipeline or task that introduced the problem. Understand impact, not just symptoms.
Aligning teams around data ownership Assign responsibility for data products, monitor performance by team or domain, and reduce handoffs with shared observability across the org.
Understanding data warehouse cost and usage Connect warehouse spend to the pipelines and tasks driving it. Identify high-cost workloads and optimize resource usage.
Choosing the Right Observability Approach
If your team depends on Airflow to run mission-critical data workflows, your data observability strategy should start where those pipelines live.
Ask yourself:
- Do we have visibility into pipeline health before data hits the warehouse?
- Can we trace issues across Dags, datasets, and dependencies?
- Do alerts reflect business-critical data products, or just raw tables or tasks?
- Are our teams jumping between tools to understand what went wrong?
If the answer to any of those is “no,” it may be time to consider an orchestration-native approach.
See Orchestration-Native Observability in Action
At Astronomer, we believe observability should be embedded where your pipelines run, not added on after the fact.
Astro Observe delivers orchestration-native observability built for Airflow, so your team can detect issues earlier, resolve them faster, and deliver trusted data with confidence.
Learn more about Astro Observe
Read the guide: Accelerating Data Product ROI with Pipeline-Aware Observability

Get started free.
OR
By proceeding you agree to our Privacy Policy, our Website Terms and to receive emails from Astronomer.