Data products get budgets, pipelines get questioned
10 min read |
In my time as a data engineer, our team once had a major pipeline outage. Suddenly, everyone in the company understood our value, because they saw exactly what broke when our tables and processes went down.
It was effective, but I wouldn't recommend "catastrophic failure" as a communication strategy.
This highlights a fundamental paradox of data engineering: When we do our job well, we are invisible. Software engineers often ship visible features, whereas we build the invisible data backend that powers decisions and systems behind the scenes. This makes it incredibly hard to demonstrate value, secure headcount, or justify refactoring time.
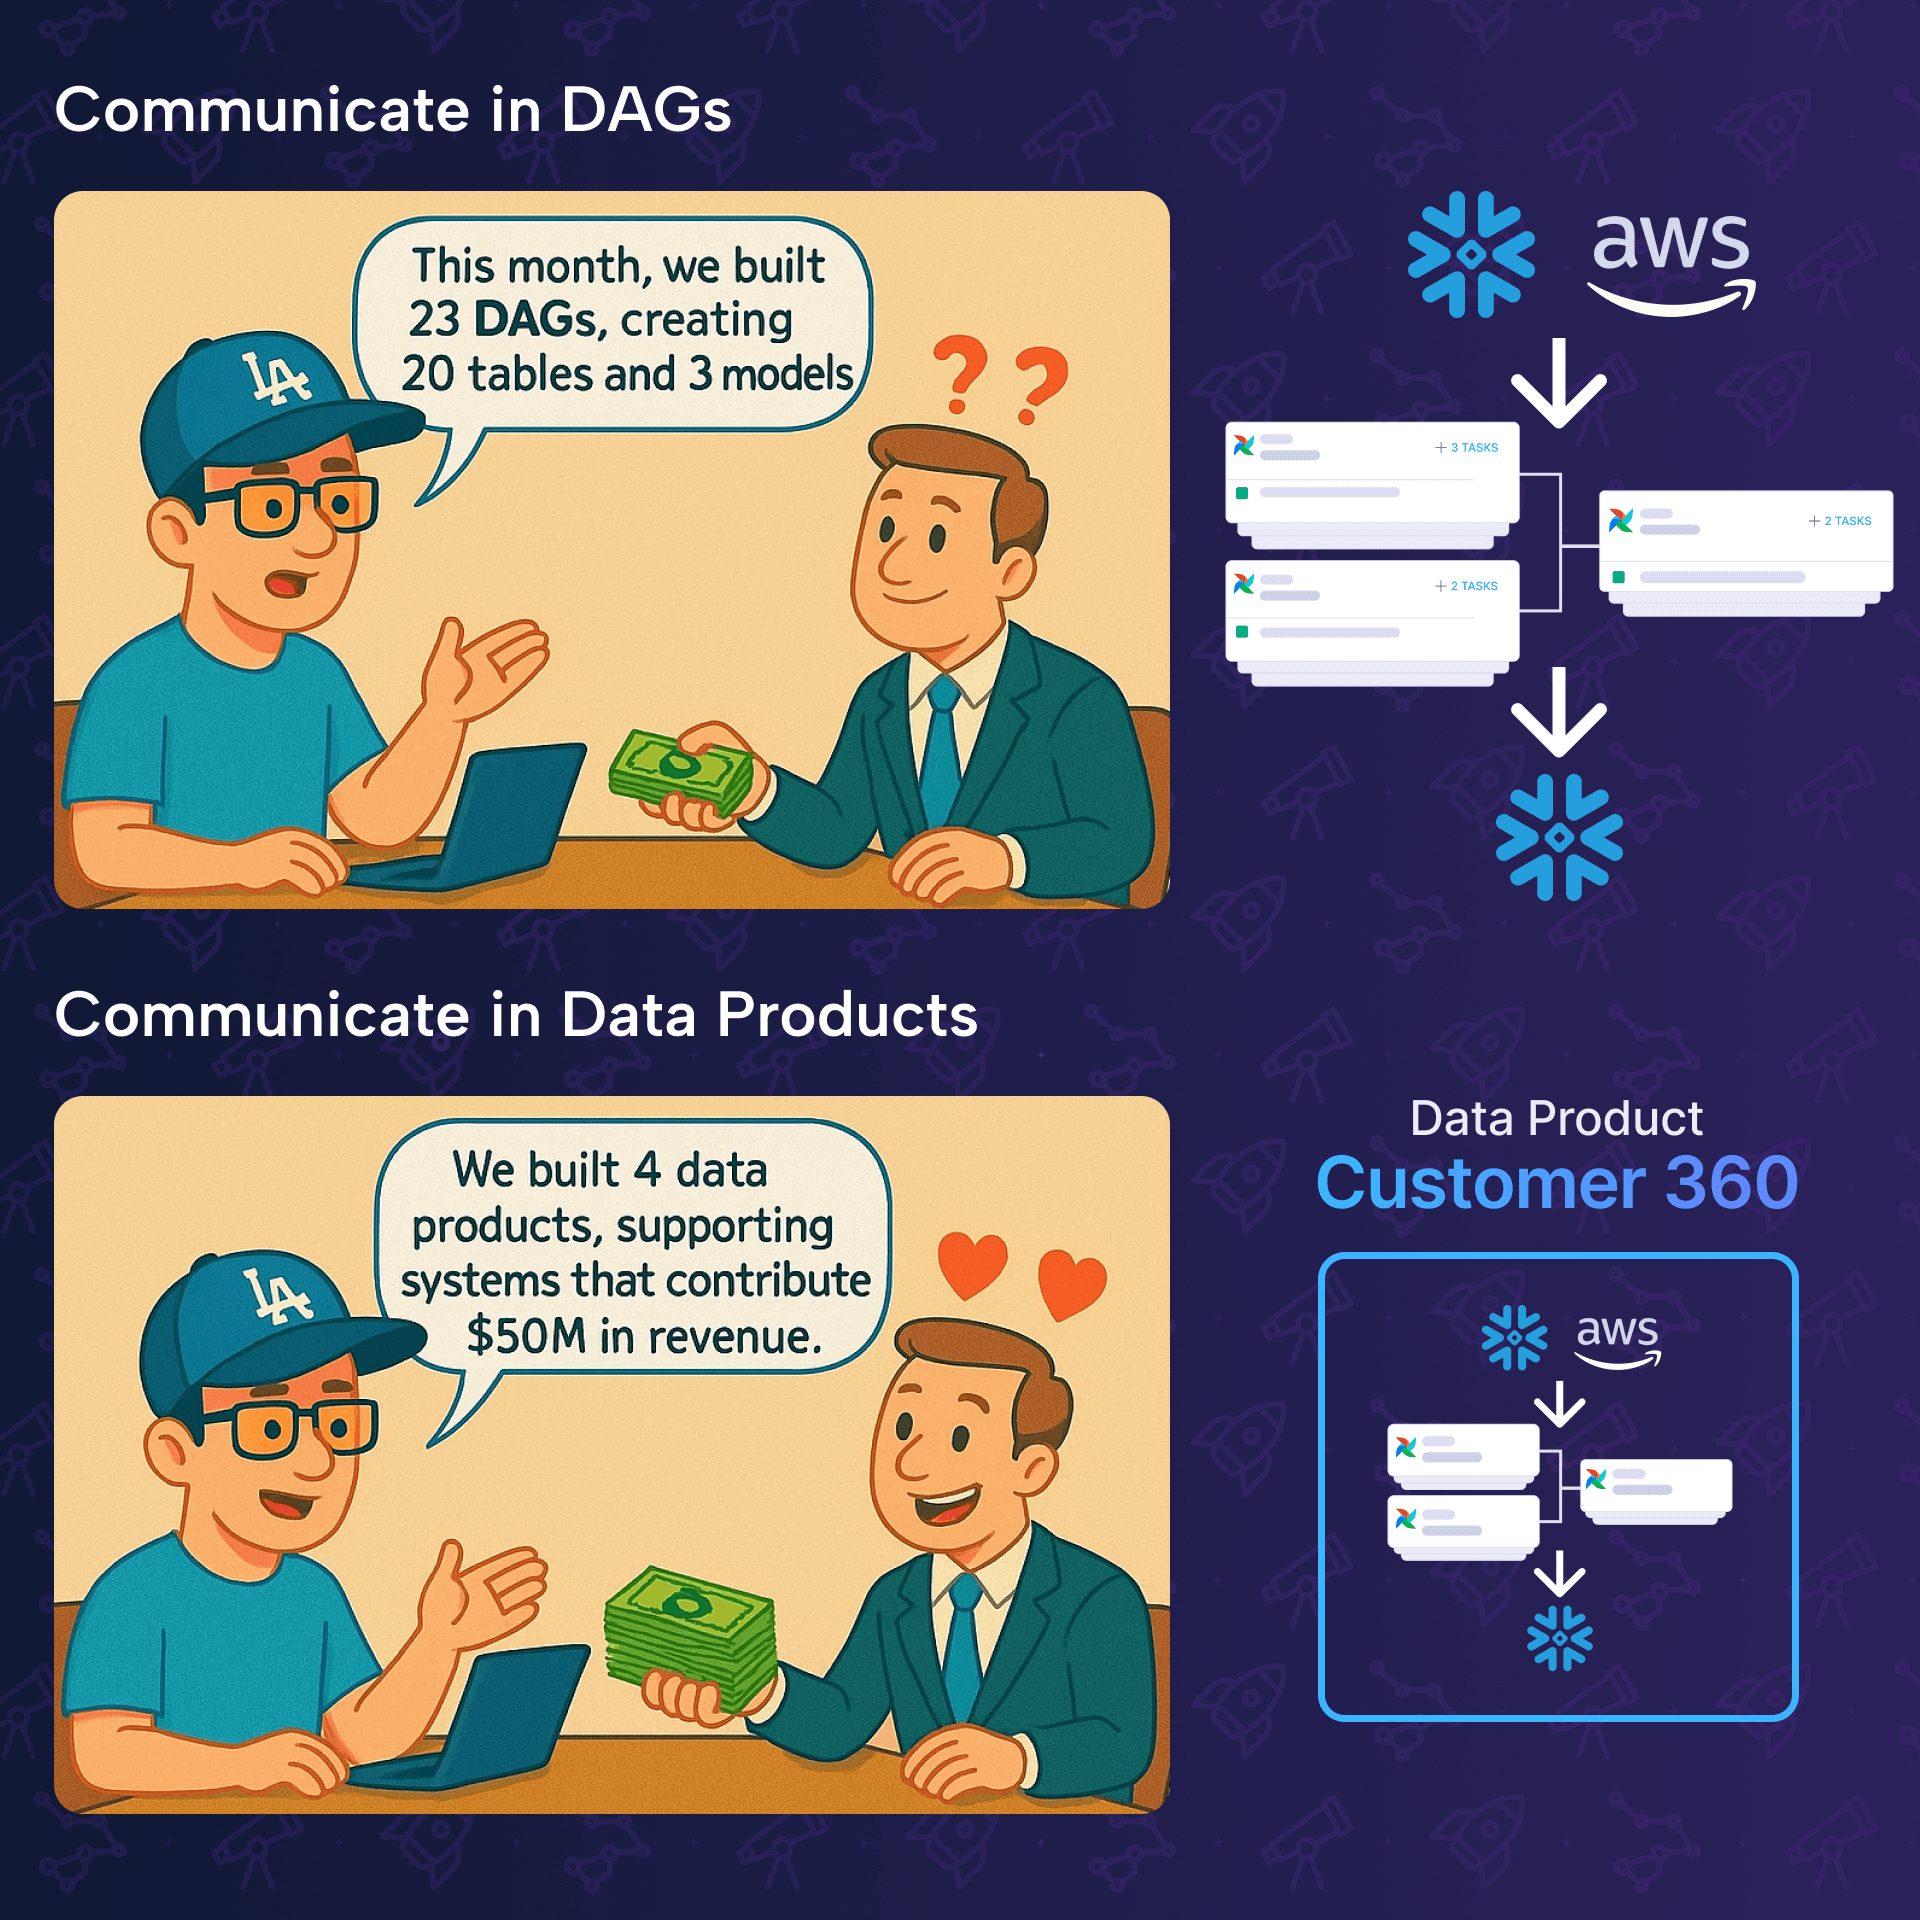
This is where the concept of the data product becomes relevant, not only for managers, but also for data engineers. It isn't just management-speak about ROI, it's a communication protocol that translates invisible Python scripts into visible business assets.
What is a data product (really)?
If I had to define data products in as few words, I would go for:
When they work, they're invisible. When they break, everyone notices.
A data product is the tip of the iceberg.
You might have 20 upstream tables (staging, cleaning, joining) managed by 5 different Dags. These are your raw materials and internal components. The data product is the final output. The specific table, report, or model that crosses the boundary from your team to the business. And all the intermediate steps in between, belong to this data product.
Let's look at it from two perspectives:
Data products for managers
From a management perspective, a data product is a measurable business asset with clear ROI and accountability. It’s something you can point to during budget discussions, assign ownership to, and track performance against defined SLAs. Data products make the invisible work of data teams visible by translating technical complexity into business outcomes.
Data products for data engineers
From a data engineering perspective, a data product is a collection of interdependent Dags, tasks, tables, and other resources, for a business-critical output and requires coordinated effort across multiple systems and teams to maintain. Data products represent the pipelines worth investing in, where you’ll want proper observability, documentation, and SLA monitoring.
Identifying data products in Airflow
You don't need a whiteboard session to find your data products. You can find them in your IDE.
Not every Dag is a product. Here is how to spot the products amidst the pipelines using three code patterns:
Cross-domain pattern
Airflow assets allow tasks to update assets, and Dags to run based on asset updates. But using an asset in it doesn't automatically make a Dag a data product. To find the product, look for domain boundaries.
If dag_a (platform team) updates an asset, and dag_b (platform team) reads it, that is just an internal dependency. However, if there is dag_c that runs based on those two assets, which itself updates an asset for which an external team is the stakeholder, for example CRM using a table represented as an asset for user segmentation, this pattern is a clear indicator for a data product.
# Internal asset
raw_users = Asset("s3://bucket/staging/raw_users")

# Product interface
customer_360 = Asset("s3://bucket/gold/customer_360")

@dag(
  dag_id="marketing_campaigns",
  schedule=[customer_360]
):
    # ...
The customer_360 asset represents the product. The 20 tables leading up to it are just assets that belong to this product.
Control Dag pattern
You have a control Dag that performs very little actual computation but consists primarily of TriggerDagRunOperator tasks.
# The Controller Dag
logins = TriggerDagRunOperator(task_id="logins", trigger_dag_id="logins")
registrations = TriggerDagRunOperator(task_id="registrations", trigger_dag_id="registrations")
customer_360 = TriggerDagRunOperator(task_id="customer_360", trigger_dag_id="customer_360")

logins >> registrations >> customer_360
The control Dag represents the end-to-end product and can be identified as a data product.
Escalation pattern
You can identify which pipelines represent data products by looking at how hard they scream when they break.
The presence of on failure callbacks that route to high-urgency channels (e.g., PagerDuty) can be an indicator.
Code that wakes people up at 3 AM is, by definition, a critical data product or at least part of one.
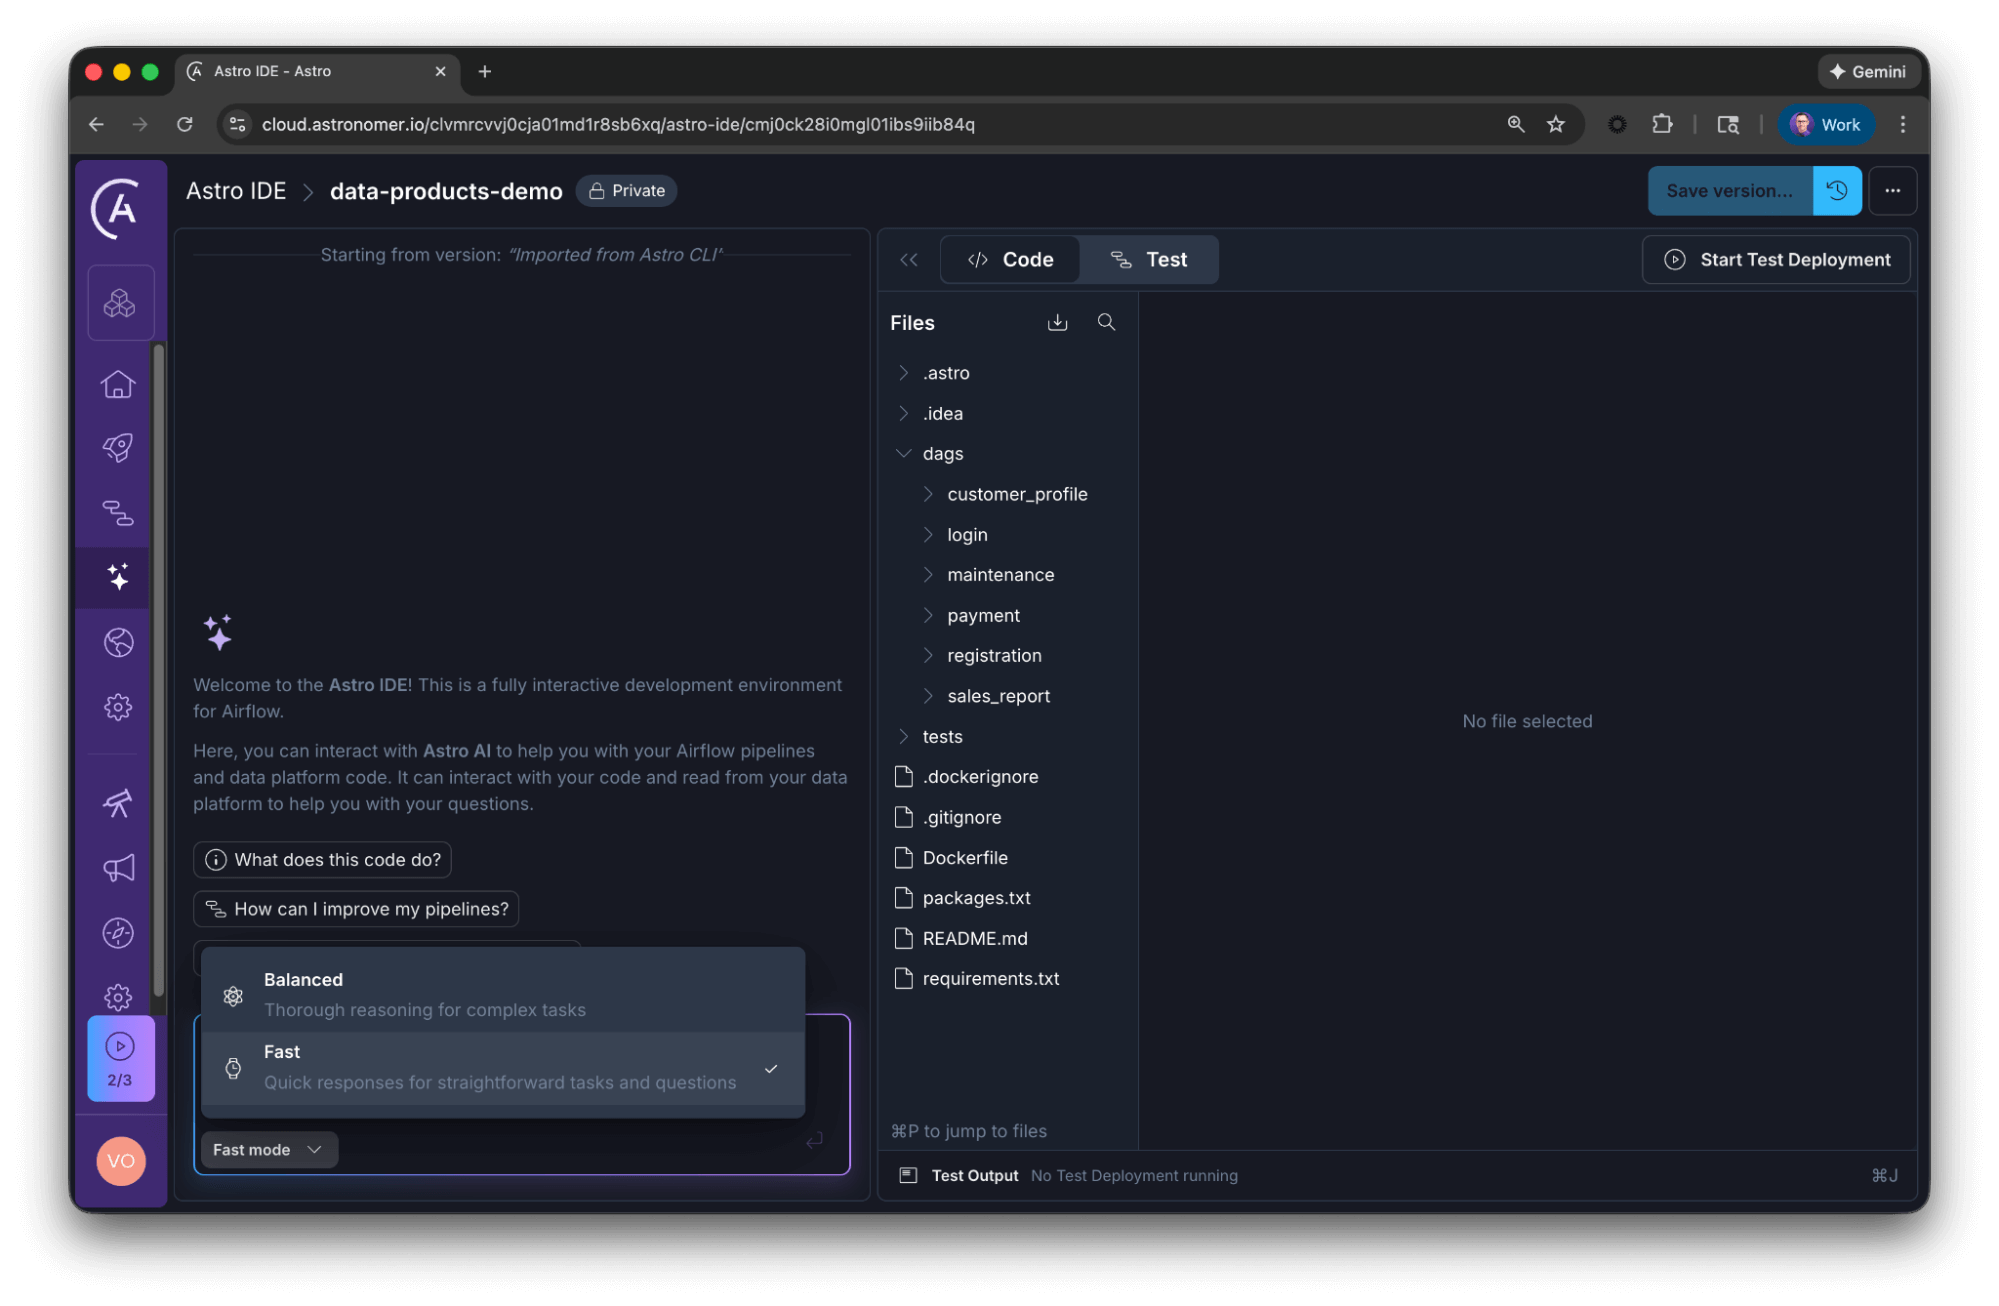
Discover data products with the Astro IDE
Knowing the patterns is step one. But scanning hundreds of Dag files manually to map these relationships is tedious. This is where the Astro IDE can help you get started.
Since the built-in AI has access to your project files, you can automate the discovery process.
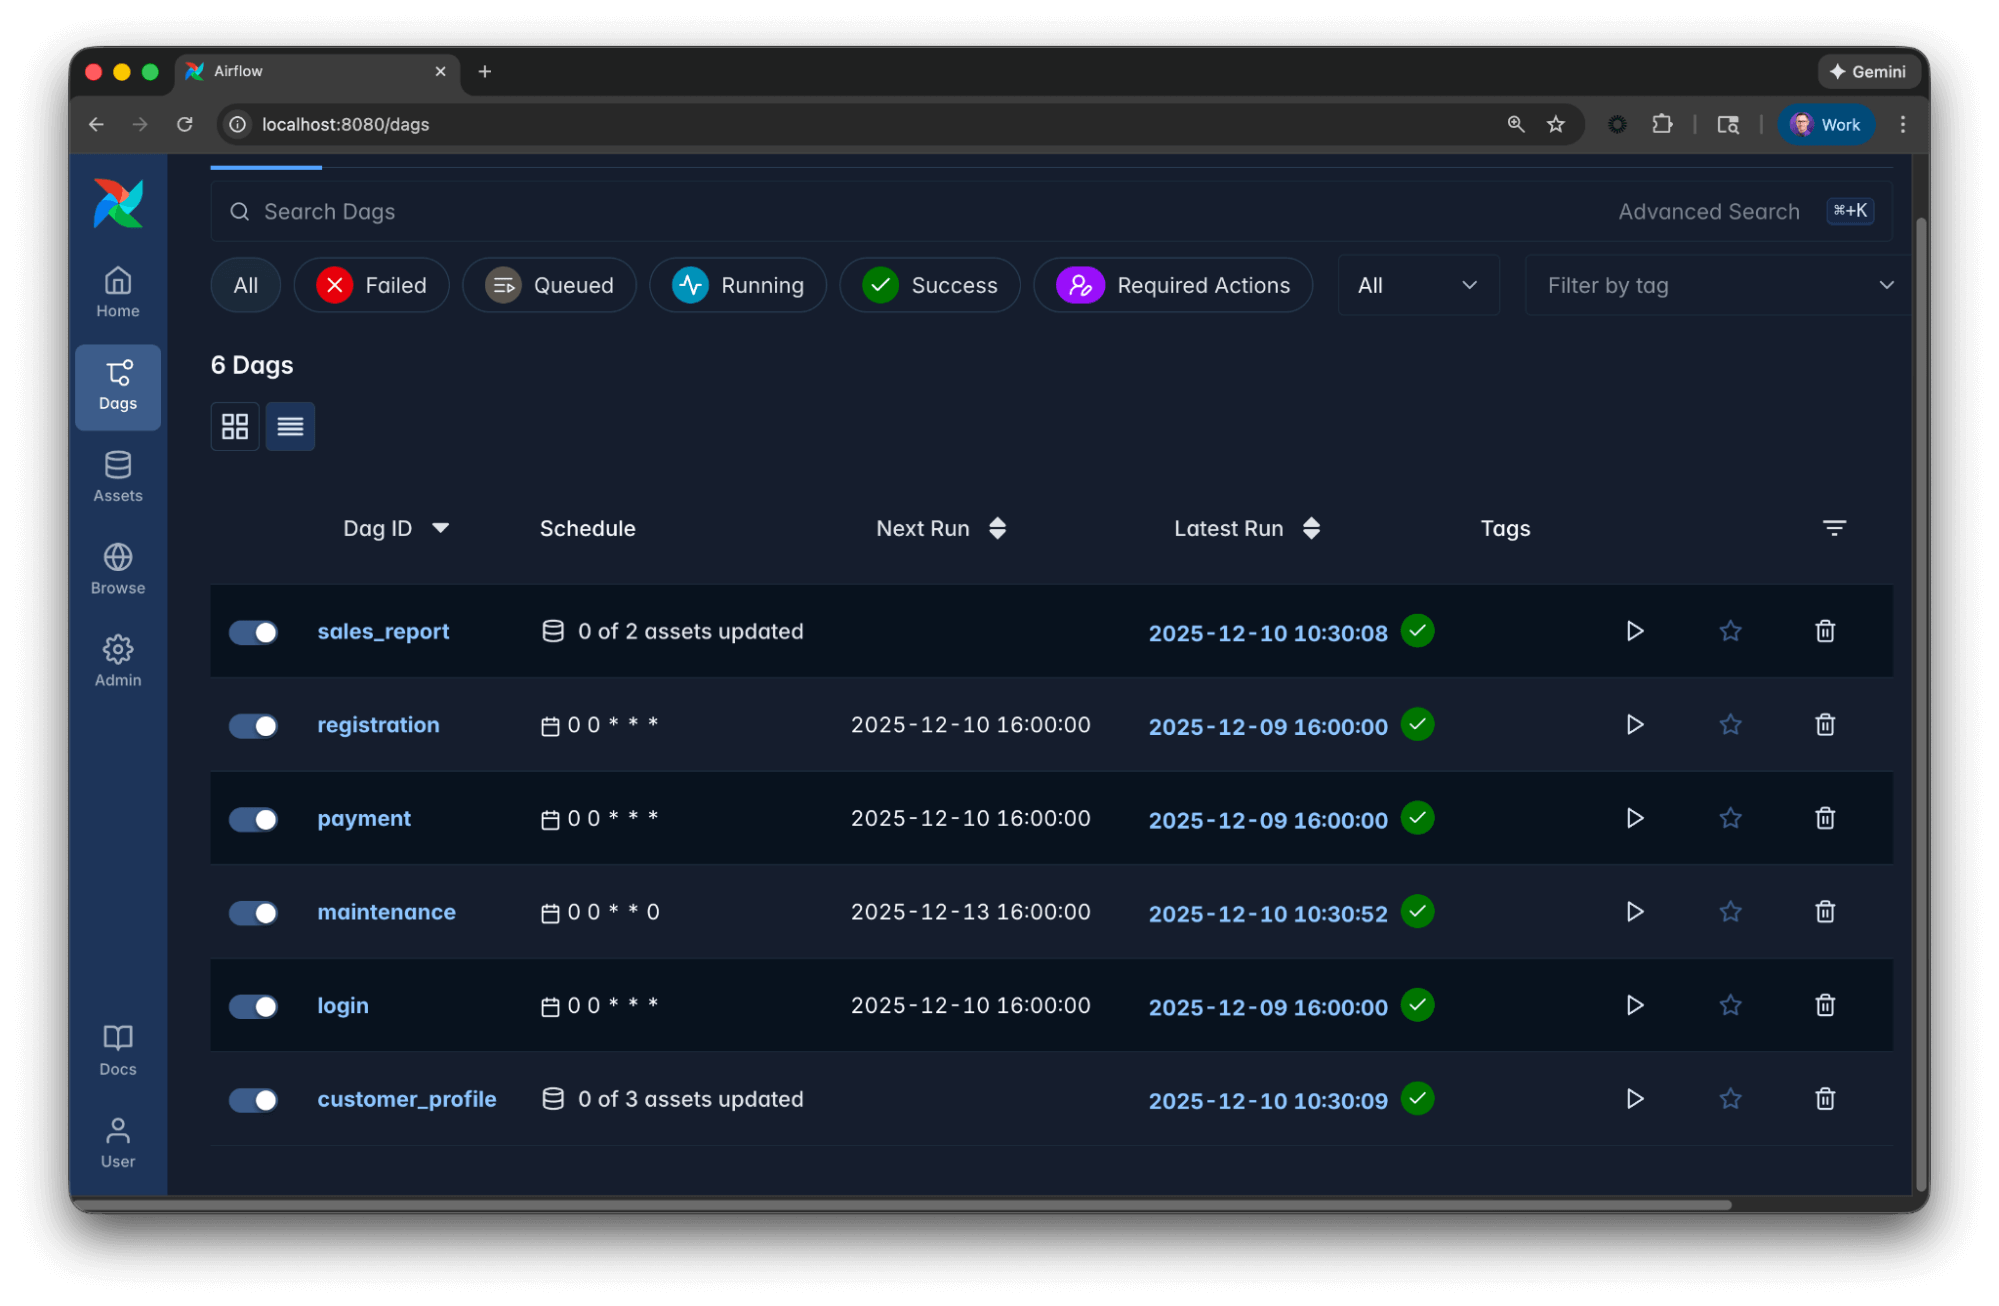
Let's assume the following example Airflow setup:
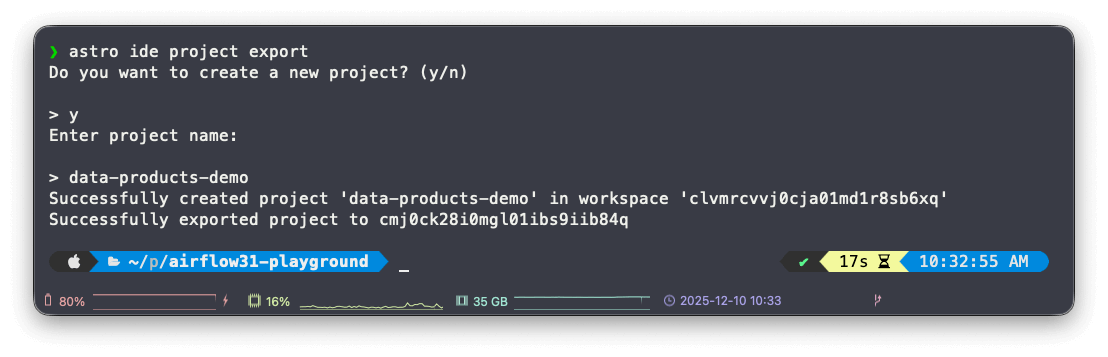
Independent from how you run Airflow, you can simply export the project to the Astro IDE using the Astro CLI:
The Astro IDE comes with two AI modes:
- Fast: Quick responses for straightforward tasks and questions.
- Balanced: Thorough reasoning for complex tasks.
In this scenario, select fast mode, since we are not generating or modifying code. That way, you get a quick response.
Once the project is imported, you can paste the following prompt into the AI assistant within the Astro IDE to generate an inventory of your data products instantly.
Data product prompt
## Goal
Your goal is to analyze the provided Airflow codebase and identify distinct data products.
## Context
* A data product is a composition of assets that, taken together, deliver a result with business relevance. It captures the end-to-end data lifecycle, and all elements that are involved in creating the product. Dags, tasks, and tables can all be assets of data products.
* Not every table or Dag deserves to be a data product, yet they might be part of one.
* Here are three practical patterns that signal you're looking at a data product candidate:
* Business impact: Failure triggers incidents, impacts revenue, or causes customer complaints.
* Orchestration complexity: Parent Dags triggering multiple child Dags, pipeline chaining across teams, or complex dependencies using Airflow assets.
* High-value consumption: Critical tables used by multiple teams, feeding executive dashboards, powering ML models, or serving external partners. If this disappeared tomorrow, would executives notice? Would customers be impacted?
## Constraints
* Group related Dags (upstream/downstream dependencies) into a single product entity.
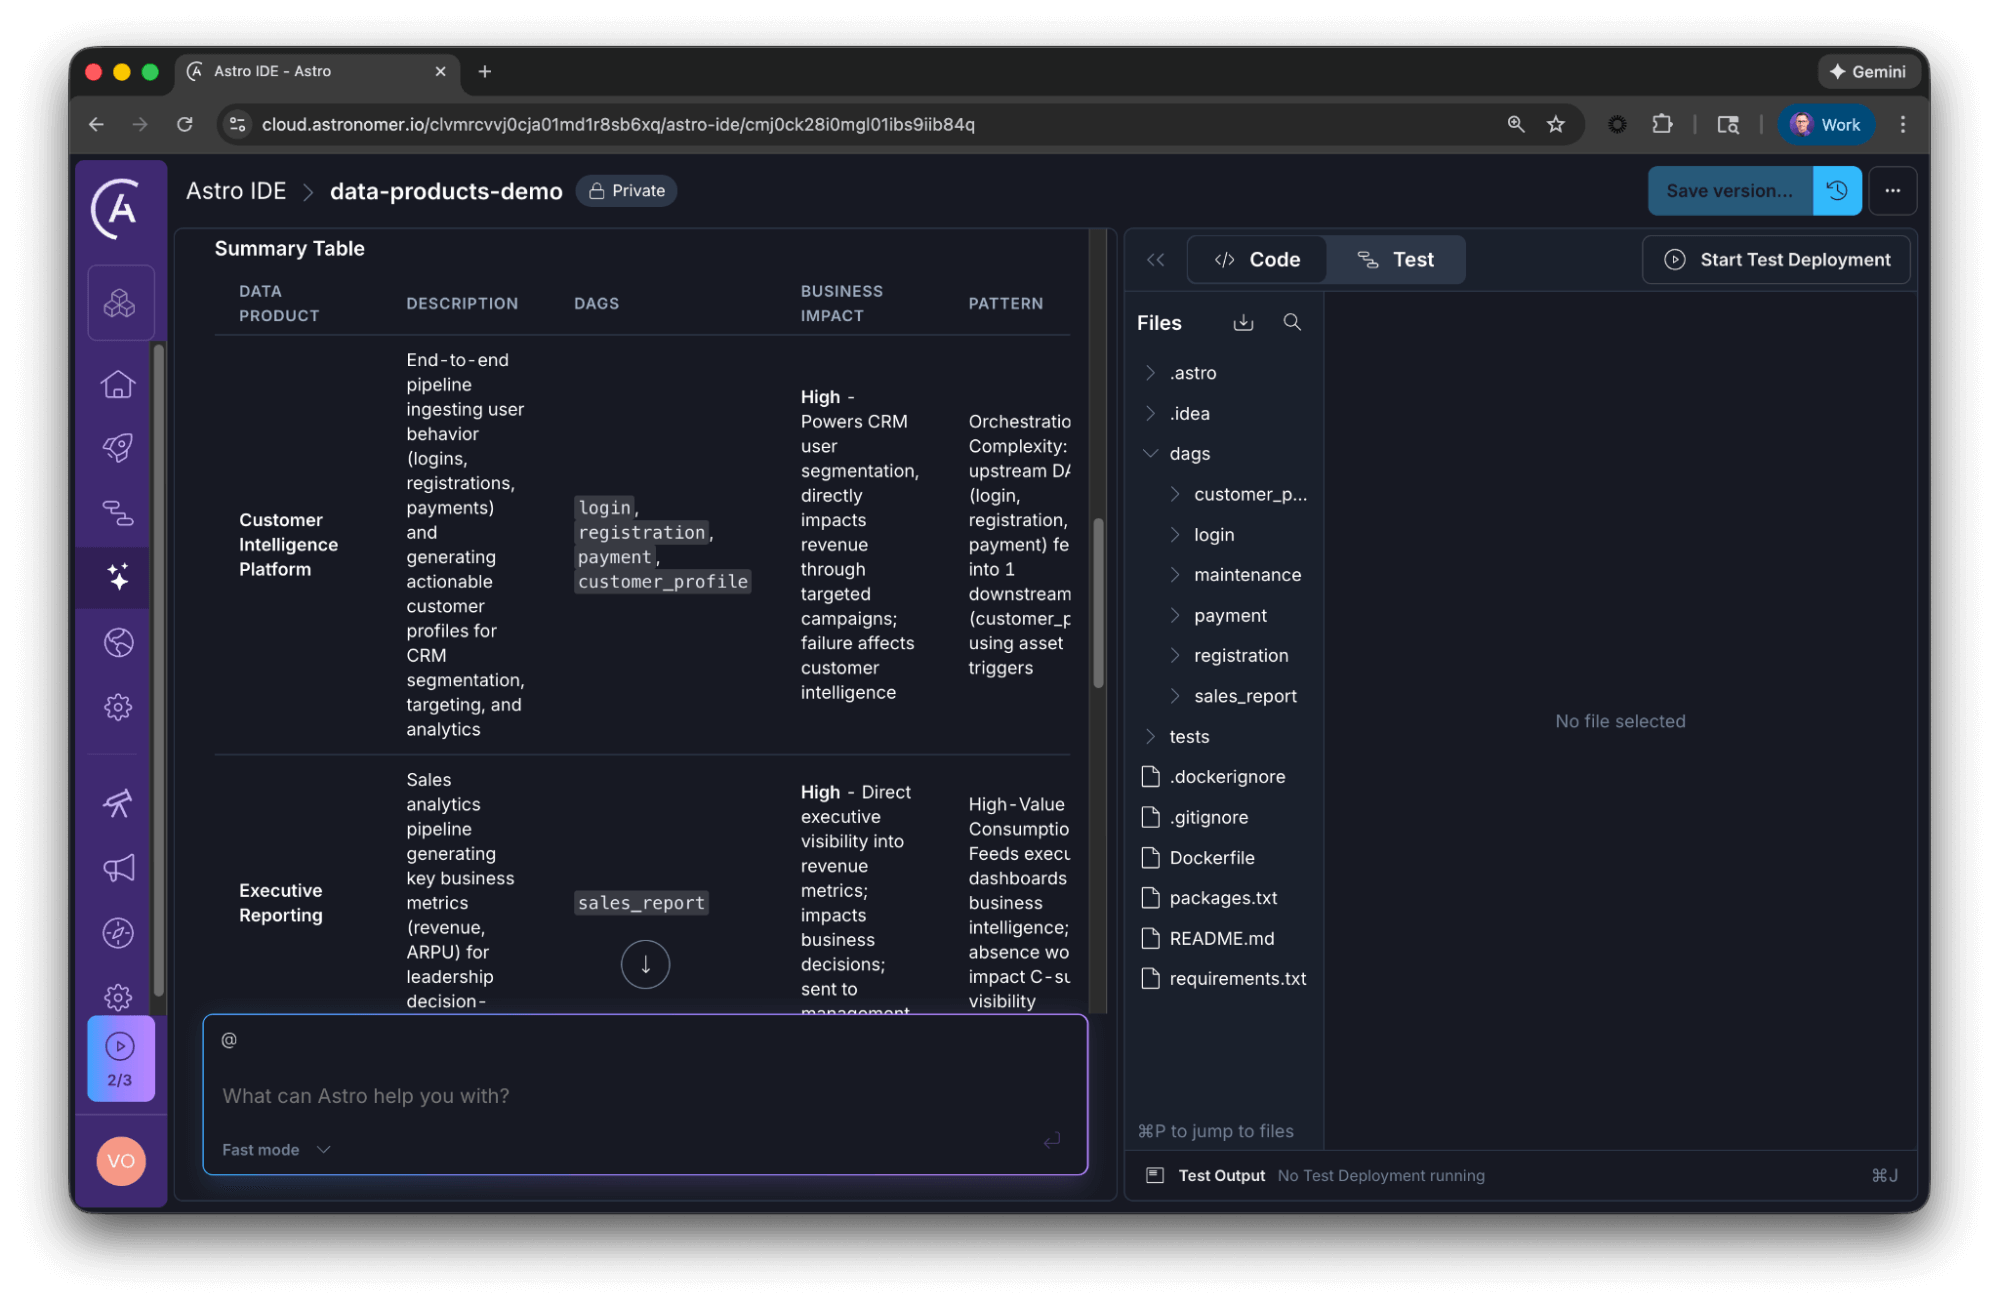
* Generate a concise summary table, including the proposed data product and Dags belonging to that product.AI response
The AI will parse your Dags to return a structured view, here is an excerpt of the reply:
**Data Product 1: Customer Intelligence Platform**
- **Upstream/Source Dags:** `login`, `registration`, `payment`
  - Extract and transform user behavior from Kafka and Payment API
  - Daily schedules ensure fresh data
- **Downstream/Consuming Dag:** `customer_profile`
  - Triggered by all 3 upstream assets (logins AND registrations AND payments)
  - Produces `customer_profile` asset used for CRM segmentation
- **Assets:** logins → registrations → payments → **customer_profile**

**Data Product 2: Executive Reporting**
- **Consuming Dag:** `sales_report`
  - Triggered when registrations AND payments assets are available
  - Generates business metrics (daily revenue, ARPU)
  - Actively sends report to management
- **Assets:** registrations + payments → **sales_report**

**Infrastructure:** `maintenance`
- Weekly operational task; not part of a business-facing data product
- No asset dependencies or downstream consumers
Notice what happened here: The AI correctly identified that the maintenance Dag, despite being a valid pipeline, is not a data product because it lacks business output. Conversely, it grouped the fragmented ingestion Dags into a cohesive Customer Intelligence Platform. This can be a great starting point to define your data products.
Read our blog post about Best practices for writing Airflow Dags with AI to learn more about effective prompting in data orchestration.
Making the invisible observable with Astro Observe
Once you have identified these products via code patterns or AI analysis, the final step is visibility. Standard monitoring tools look at tasks. Data product monitoring looks at value.
Astro Observe delivers observability built directly into Astro, providing complete pipeline visibility from ingestion through transformation to delivery. Unlike traditional observability tools that stop at the warehouse, Astro Observe gives you end-to-end visibility.
With Astro Observe, you can:
- Define data products with clear ownership and SLAs.
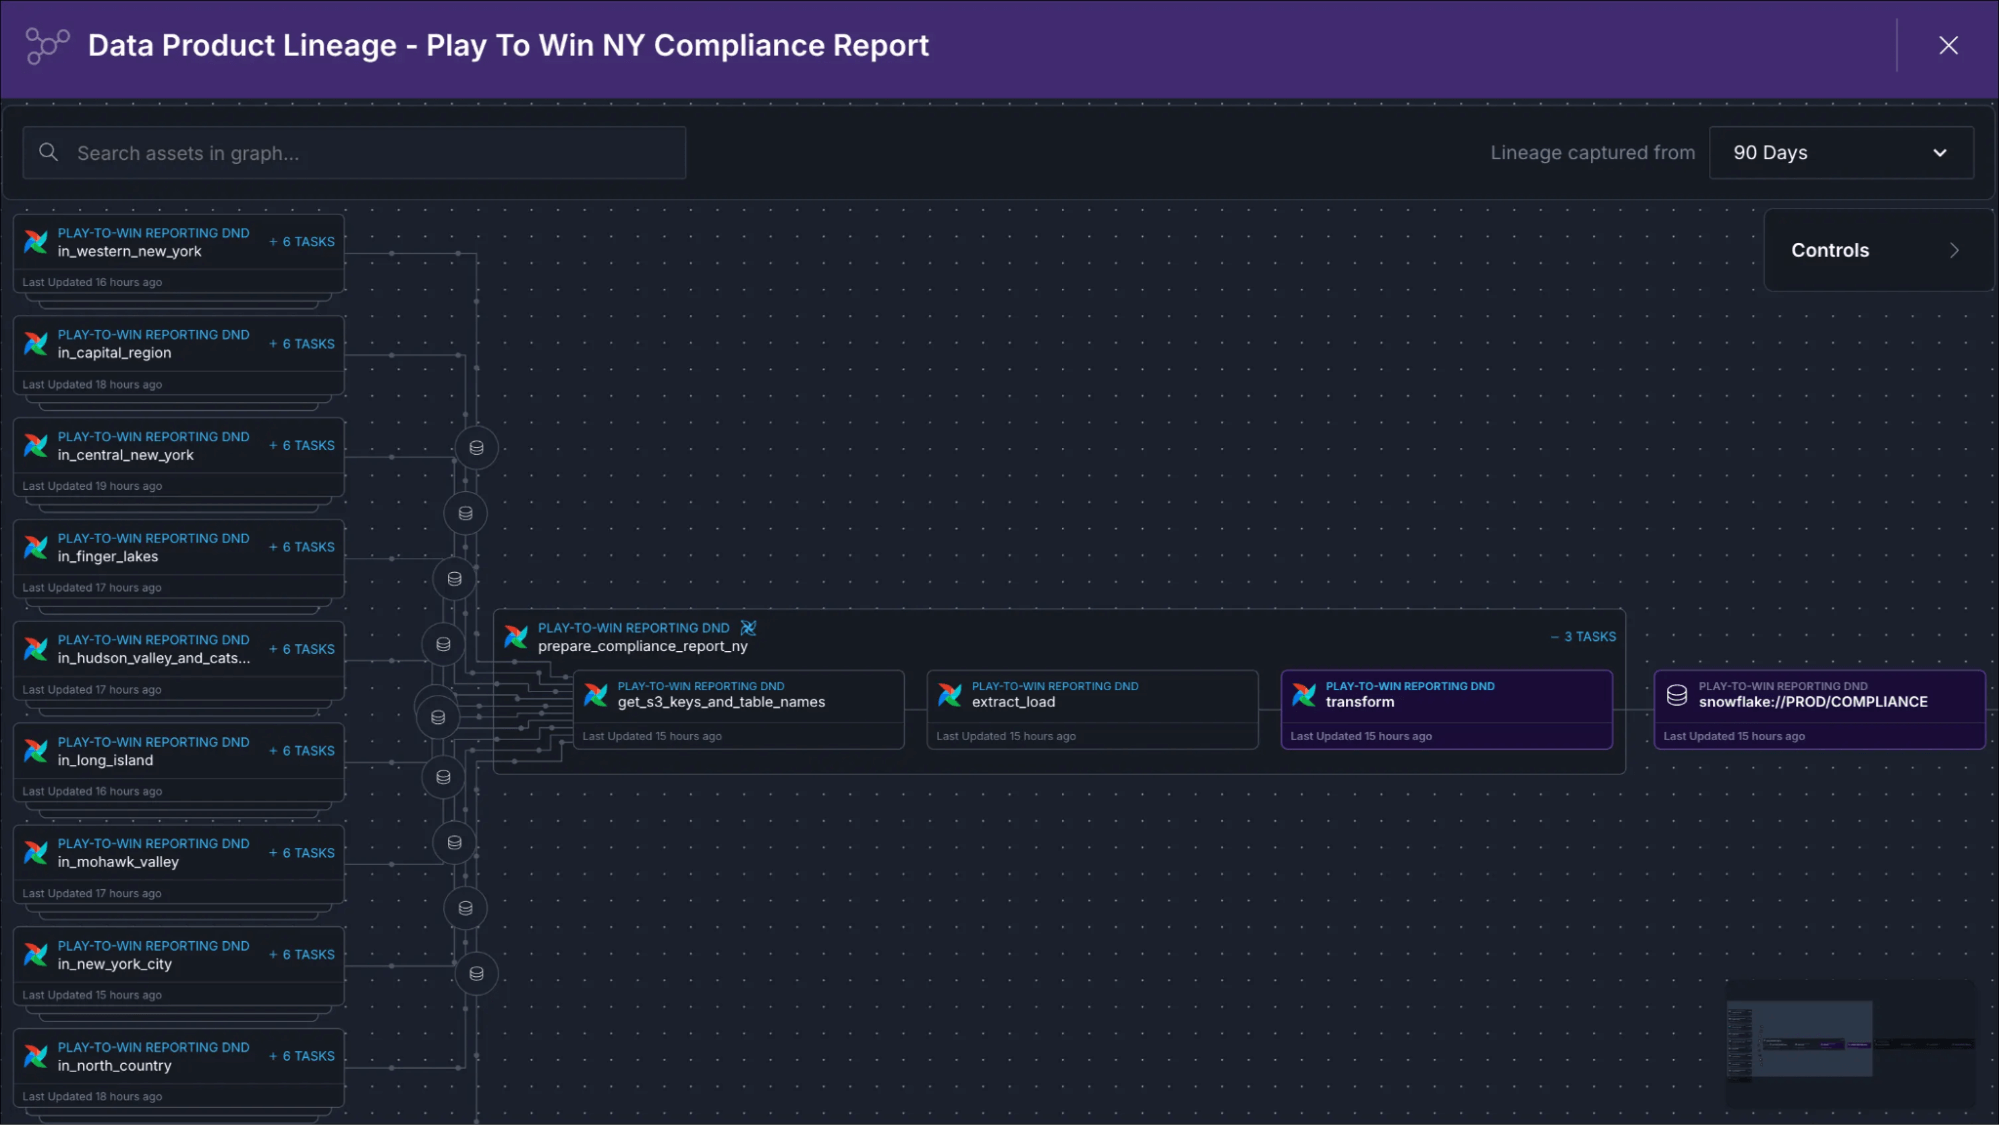
- Monitor pipeline health in real-time with automatic lineage visualization.
- Get proactive alerts before failures impact the business.
- Accelerate troubleshooting with AI-powered insights and log summaries.
- Track data quality with built-in checks linked to upstream pipelines.
- Attribute warehouse costs to specific pipelines and data products.
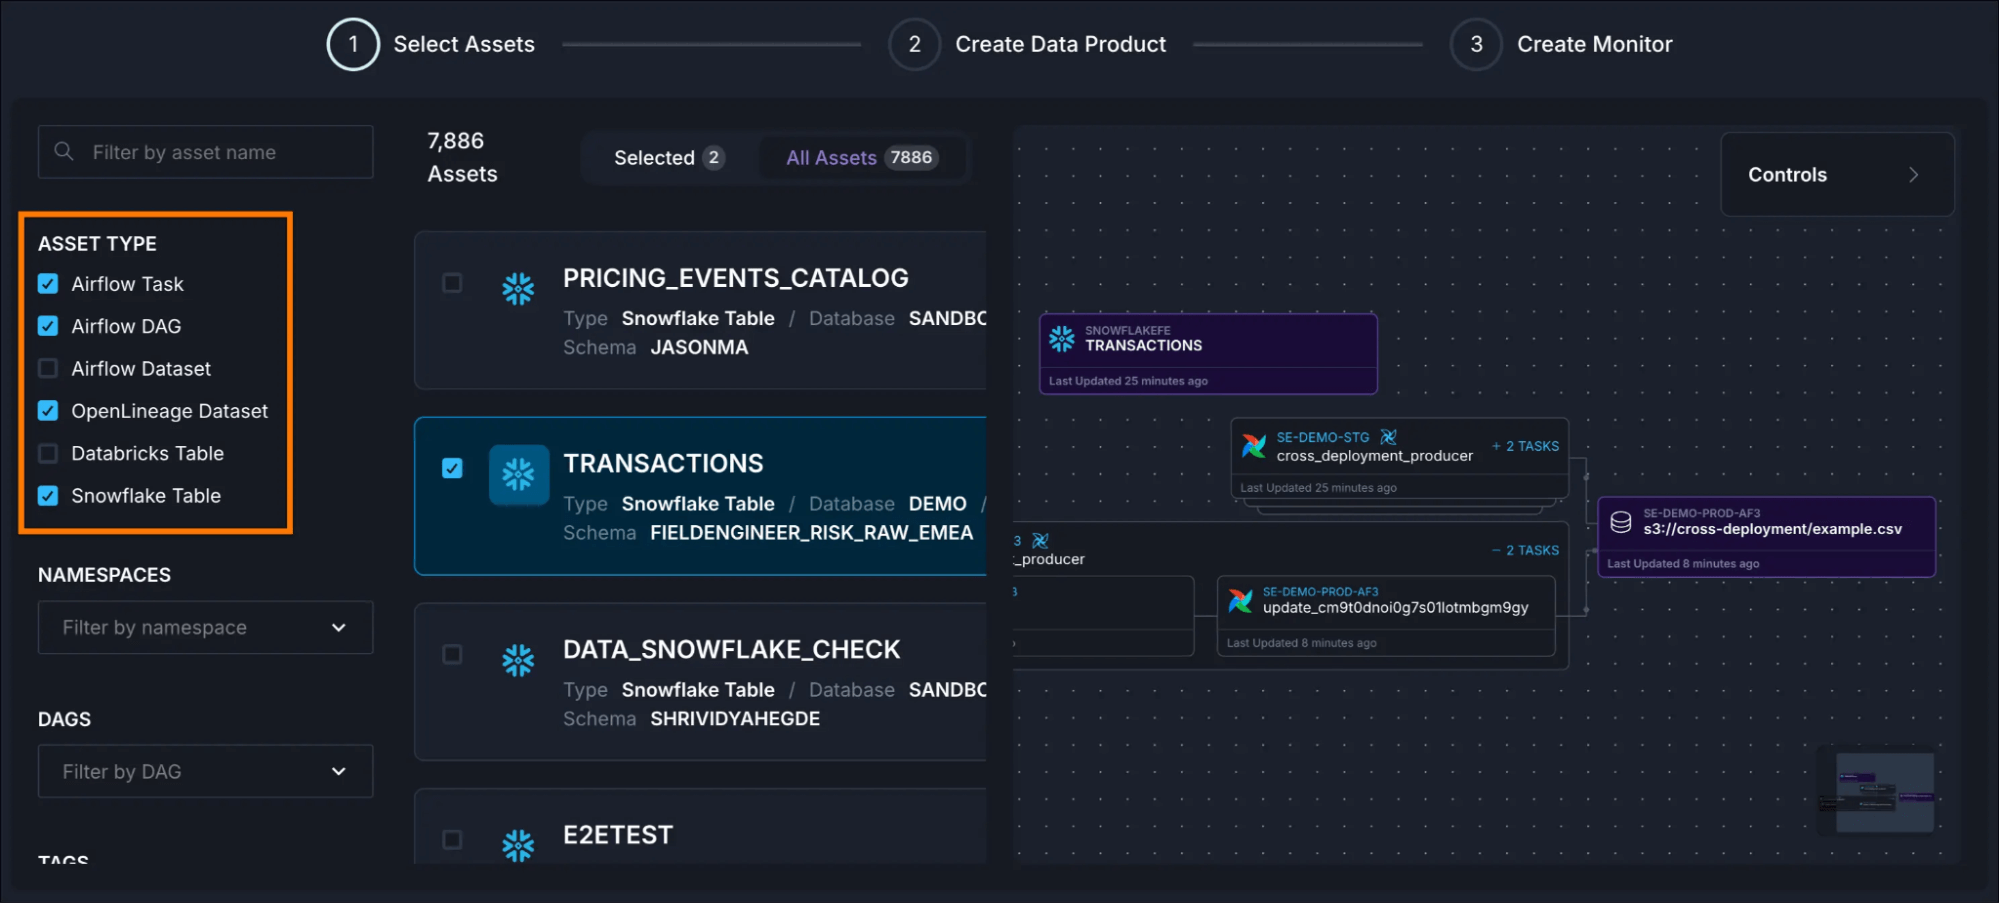
Creating a data product in Astro Observe
Defining a data product in Astro Observe is straightforward. You identify the critical assets (Dags, tasks, tables) that together deliver business value, assign ownership, set SLAs, and start monitoring. What makes this process particularly convenient in Observe is that it automatically infers upstream assets based on Airflow metadata just by running your Dags.
Combine this with the patterns and Astro IDE approach above, and start communicating value, not just pipelines.
10 rules for data products
If you are looking to shift your team's mindset, keep these tips in mind:
- The 3 AM Test: If you get called at 3 AM when the Dag fails, it is a data product 📟.
- Controller Pattern: Your master Dag triggering child Dags? That's a data product sign 🔄.
- Accountability: Accountability beats ambiguity; clear ownership saves chaos 👥.
- Translation: Visibility = Value. Translate pipelines into business outcomes 💰.
- Terminology: Frame your work as products, not Dags, tables, or models 🎤.
- Observability: Orchestration alone isn't enough; you need observability to see the flow 👀.
- The Executive Test: If executives would notice it’s missing, it's a data product 🚨.
- Funding: Products get budgets; pipelines get questioned 💵.
- Selectivity: Not every table deserves to be a data product 🎯.
- Impact: Business impact > Technical complexity 📊.
Dependencies reveal what matters. By treating your critical pipelines as products, you make the invisible visible, and you might just get the budget (and the sleep) you deserve.
Summary
Communicate value, not just pipelines
Data products help data teams demonstrate ROI. Frame work as maintaining 10 data products supporting $50M in revenue rather than technical tasks.
Data products drive business value
If pipeline failure wakes someone up, triggers executive escalation, or stops revenue, it’s a data product. Business impact is the go-to test for identifying what deserves product-level treatment.
Dependency webs indicate data products
When you see Dags triggering other Dags, Airflow assets coordinating dependencies across teams, or workflows spanning multiple domains, the orchestration complexity itself indicates that there is a data product.
Business context matters
Not every popular table is a data product. Ask: Who notices if it disappeared? Would customers be impacted? Would we lose money? Criticality and accountability matter more than usage alone.
Observability prevents cascading failures
One delay often cascades into multiple failures. Proactive monitoring with SLA tracking, lineage visualization, and proactive alerting catches issues before they impact business outcomes.
Ownership drives accountability
Clear ownership ensures someone is responsible for quality, uptime, SLAs, and evolution. It enables faster incident response, better stakeholder communication, and demonstrates who delivers value when products succeed.
Want to learn more about data products? Read our detailed learn guide about data products.
Want to see how this works in practice? Book a demo and explore how unified orchestration and observability can transform your data operations.

Get started free.
OR
By proceeding you agree to our Privacy Policy, our Website Terms and to receive emails from Astronomer.