Airflow in Action: ETL Insights from Bloomberg — Slashing Runtimes by 50%
6 min read |
Bloomberg's Data Platform Engineering team manages over 2,500 dynamic Dags orchestrating alternative financial data for hundreds of thousands of Bloomberg Terminal subscribers worldwide. At the Airflow Summit, software engineers Yu Lung Law and Ivan Sayapin shared how their team used native Apache Airflow® configuration parameters to resolve four real production issues at scale, without writing a single line of new code. This post recaps their session and provides a link to the session recording so you can learn more.
Airflow at Bloomberg
Bloomberg Terminal serves more than 350,000 subscribers across the financial services industry in 170 countries, delivering real-time market data, news, and analytics. The Data Platform Engineering team sits at the core of that, managing the ETL workflows that ingest alternative data: non-traditional, non-financial data sources that give investors and analysts a broader view of market conditions and business performance. This includes everything from satellite imagery and web traffic patterns to supply chain signals and consumer sentiment.
They convert no-code Bloomberg Terminal configurations into dynamic Airflow Dags at runtime, spinning up over 2,500 pipelines with varying parameters and different task structures, each creating a distinct data set.
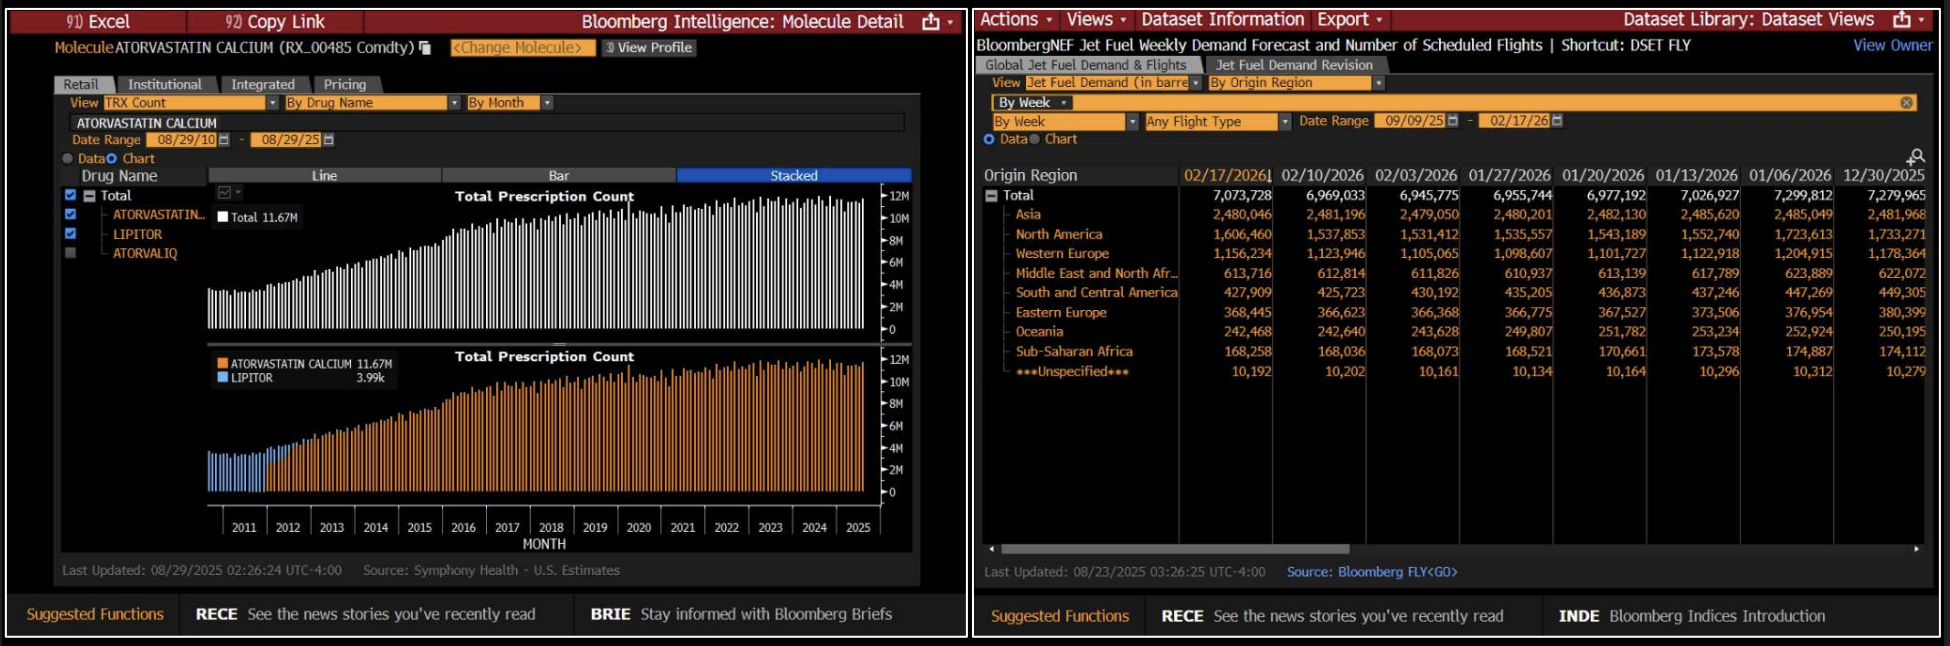
Figure 1: The Bloomberg Terminal aggregates real-time market data, news, and analytics, giving financial professionals the information they need to act on business and investment decisions. Image source.
The Controls You Already Have, But May Not Be Using
Airflow configurations are parameters that govern how the platform behaves: Dag parsing, scheduler heartbeat, metadatabase interactions, task queuing, metadata cleanup, and more. The default values are good to get started, but they often need tuning when running Airflow at scale.
As Yu Lung and Ivan explain, tuning these parameters is usually the fastest path to optimizing production performance. They also noted how Airflow 3 expands the available tooling further, introducing new configuration options specifically designed for debugging and diagnostics that did not exist in earlier versions.
Configurations in Action: Four Real World Use Cases
The speakers used their talk to illustrate how they tuned configurations to address four issues in production.
When Dag parsing stalls: The team's first issue surfaced when over 2,500 dynamic Dags stopped appearing in the Airflow UI. Investigating the Dag processor logs, they noticed the number 50 appearing repeatedly. The Dag processor was timing out at exactly 50 seconds, the default value of dag_file_processor_timeout. Their dynamic Dag generation file, which called an internal service and constructed complex task trees with over 150 tasks each, simply needed more time. Setting the timeout to 500 seconds for debugging restored all Dags immediately and bought the team time to explore longer-term solutions like splitting Dag generation across multiple files.
Cutting Dag parsing lag to near real-time: With dozens of static Dags being parsed alongside the dynamic generation file, changes to those static Dags took several minutes to propagate. The team identified two parameters under the dag_processor section: parsing_processes, which controls how many files are parsed in parallel, and min_file_process_interval, which sets how frequently files are re-parsed. By increasing parallelism and reducing the interval, they achieved near real-time Dag updates across their entire fleet. The key trade-off to manage was CPU usage: lower intervals increase refresh frequency but raise resource consumption. Finding the right balance required testing across environments.
Pinpointing a scheduler memory leak: A memory leak was causing the scheduler process to be killed and restarted, halting all Dag and task scheduling. Standard memory monitoring showed total RSS growing steadily, but gave no indication of which allocation site was responsible. The team turned to enable_tracemalloc, a configuration introduced in Airflow 3. Setting it to true and sending a SIGUSR1 signal to the scheduler triggered memory allocation tracing, logging the top 10 memory allocation sites at the error level. The culprit, a leaky plugin, was immediately visible. Removing it stabilized memory consumption. This diagnostic capability exists purely in configuration; no custom instrumentation was required.
Building observability with StatsD: After resolving these issues, the team wanted automated detection if they recurred. They enabled StatsD metrics export through Airflow's built-in integration and used the metrics_allow_list configuration to capture key signals such as when the Dag processor stalls, files taking too long to parse, or delays between the expected start of a Dag run and the actual start time of the first task in critical pipelines. This fed directly into automated alerting and ticket creation, turning reactive firefighting into proactive monitoring.
Key Learnings
The Bloomberg team closes with three practical points every Airflow operator should internalize:
- Test configuration changes in lower environments first, since many parameters involve trade-offs between performance and resource consumption.
- Use temporary configuration changes to stabilize production while you investigate permanent fixes.
- Read the documentation for your current Airflow version: capabilities like
enable_trace_malloconly exist in Airflow 3, and staying current opens up new options for diagnosis and tuning.
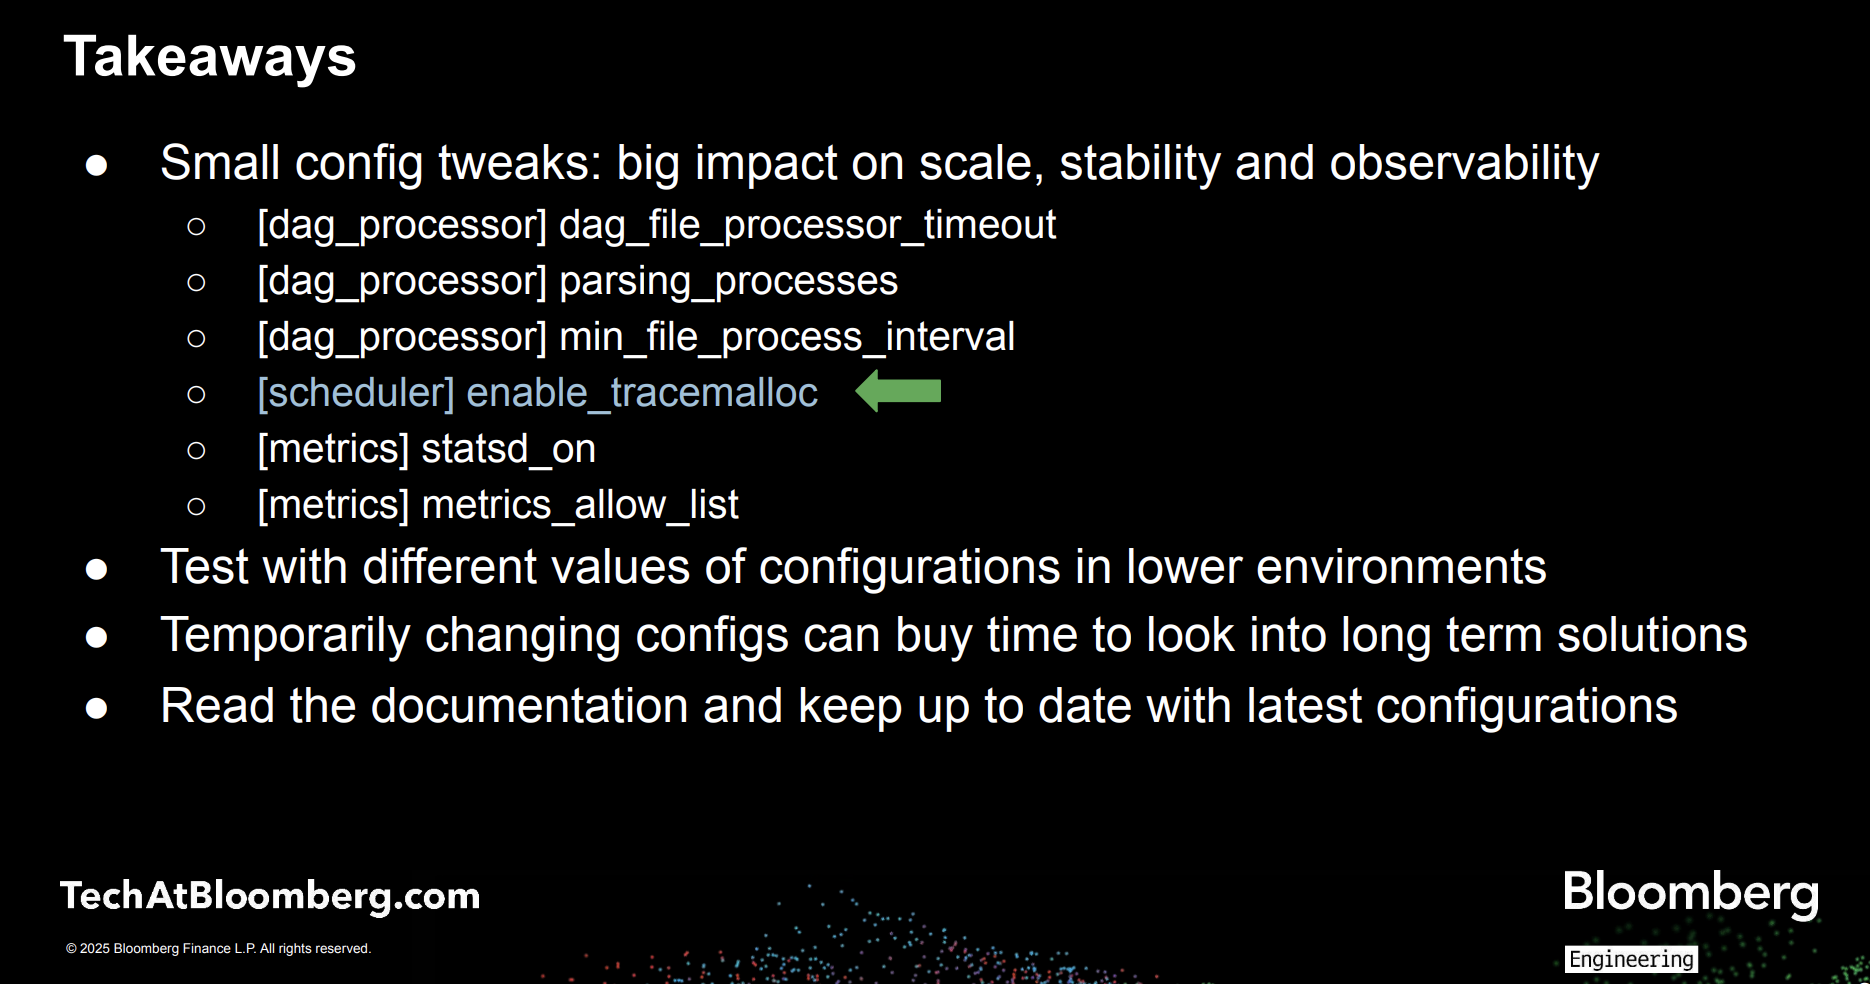
Figure 2: Summarizing key learnings from Bloomberg’s Airflow Summit session. Image source.
Watch the full session replay: Fine-Tuning Airflow: Parameters You May Not Know About to see the parameter changes, telemetry, and before-and-after results in detail.
What Astro Handles So Your Team Doesn't Have To
The monitoring setup Bloomberg describes requires deliberate configuration effort: selecting the right metrics, wiring up alerting, and maintaining those integrations over time. Astro, the fully-managed Airflow platform from Astronomer, eliminates that overhead.
Astro brings observability directly into the orchestration layer, giving teams real-time visibility into pipeline and infrastructure health across every deployment, without additional tooling or custom integrations. Astro surfaces key metrics such as Dag run success and failure rates, scheduler heartbeat, worker CPU and memory consumption, and task-level performance. With Astro Observe, teams move up the stack to their data products with real-time insights into lineage, SLAs, and data quality.
Serving as an extension to your team, Otto is Astronomer's data engineering agent, purpose built for Airflow. With Otto, you can build and debug pipelines, plan and execute upgrades, and diagnose production failures, grounded in the compatibility knowledge, failure patterns, and upgrade paths seen across hundreds of Airflow deployments. The longer your team uses it, the more it knows about how your environment works. Corrections stick, conventions propagate, and every session picks up where the last one left off.
You can try Astro and Otto out at no cost to see what it can do for your data platform.

Get started free.
OR
By proceeding you agree to our Privacy Policy, our Website Terms and to receive emails from Astronomer.