The Road to Reliability: Implementing Pipeline Observability
8 min read |
Over the past year, our team has been focused on pipeline reliability and operational confidence. In this post we wanted to share our journey: where we started, where we struggled, and where we are now.
The Beginning: Scaling Fast with Airflow
We had a backlog of data projects that needed to be operationalized. Choosing our tool was simple, Airflow (duh). Our initial implementation of Airflow was focused on operational standards and quick on-boarding.
This included implementing:
- A DAG factory
- A few key Custom TaskGroups
Which essentially created a set of pipeline templates for ETL, CreateTable, IncrementTable, and rETL.
This made for easy configurable pipeline generation that standardized processes ensuring everything met all testing, documentation, and production readiness standards. Abstracting Airflow from our day to day work means that the team can focus on their projects and not on “how to Airflow.”
This was great! We grew from 0 to nearly 200,000 weekly tasks in just over a year, with Astro’s auto-scaling making it easy to handle the increased workload.
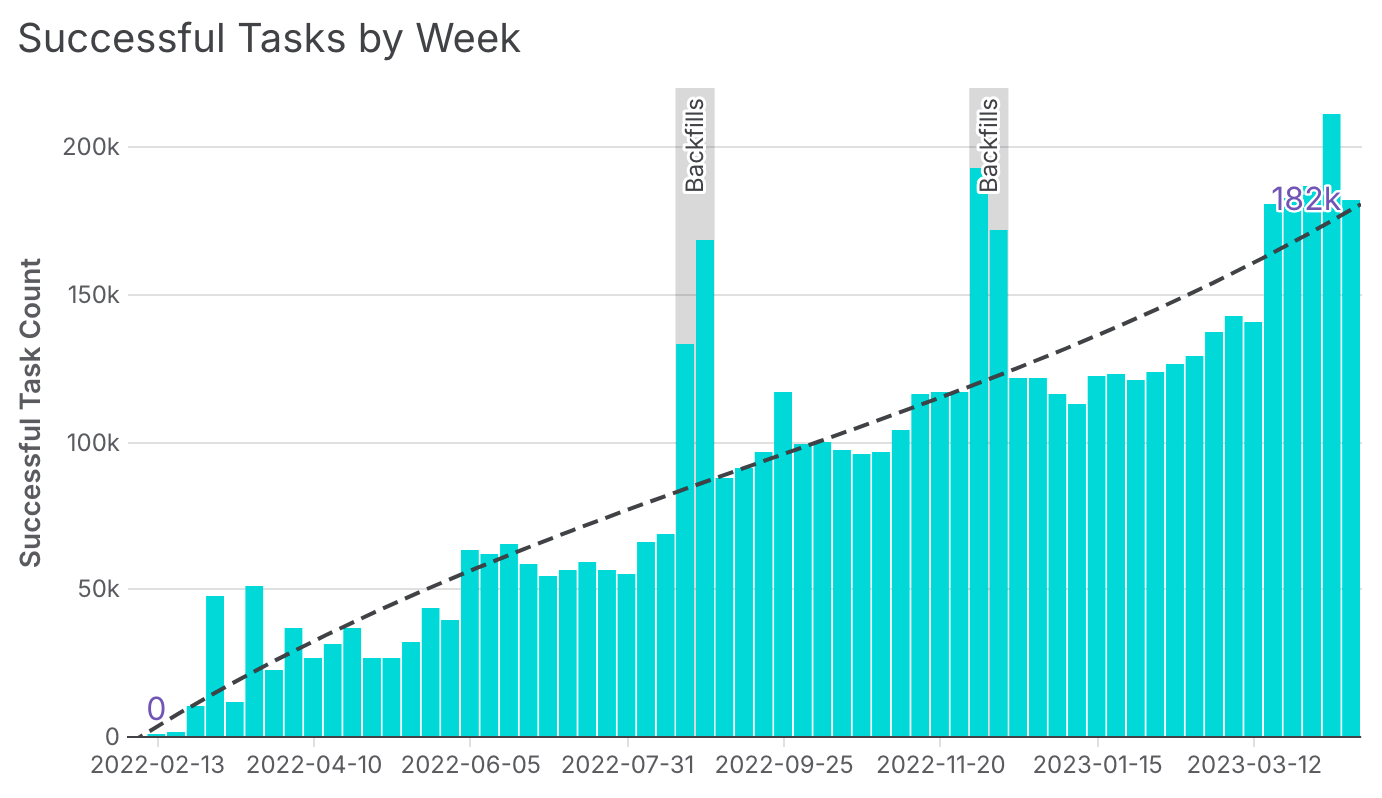
Weekly task growth in our production environment over the span of roughly a year.
Growing Pains: The Sensor Struggle
But with scale came complexity.
Our work spans every business domain. Product data enhanced with sales data, which is enriched with marketing data, and so on. Over time we grew a large web of Airflow dependencies, all managed with Airflow sensors.
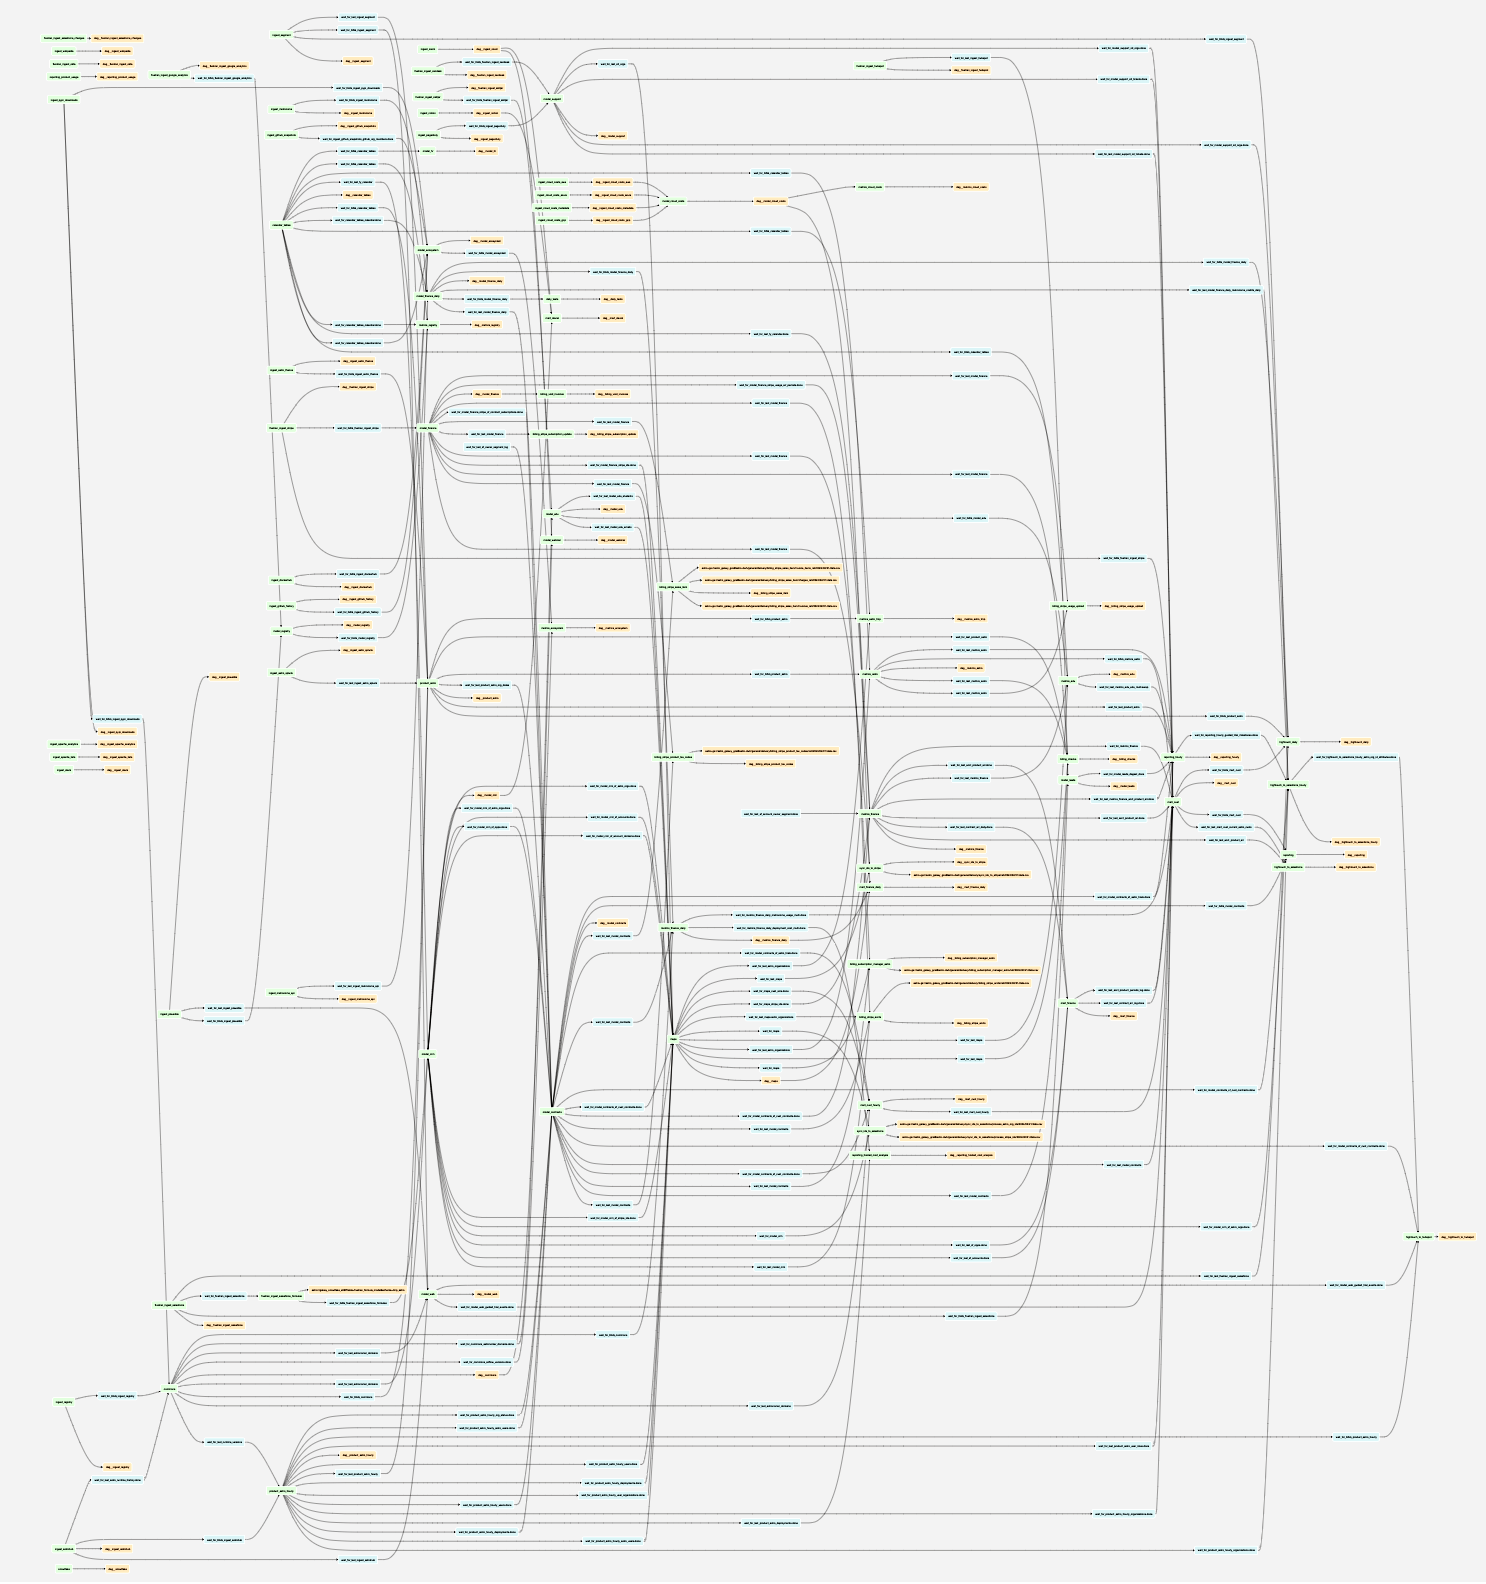
Our Airflow DAG Dependency Graph (found in the Airflow UI under the Browse menu) - Showing the interconnectivity between all our DAGs in our deployment.
Those sensors started to lead to a lot of failures (either from scheduling contention, hitting timeouts, or true data issue failures) and headaches. Consequently any sensor failure would cascade and fail all downstream pipelines as well. This made for a lot of red, and a lot of time spent getting everything back online. Finding the source of the failure was tough, unless you were deeply familiar with the entire pipeline ecosystem. Then, once the issue was identified, you had to manually clear sensors and trigger the DAGs in the right sequence just to get everything back online.
Multiple root failures in a day?… Here's hoping you weren’t on monitoring duty.
We tweaked things like sensor modes, task pools, task priority, and swapping to asynchronous sensors to help Airflow focus on compute tasks over idle sensors. While these changes helped, they didn’t address the root problem – since most days, failures cascaded due to task timeouts. Our climbing failure rate was clearly linked to our dependency management approach, which was overly reliant on sensors. It wasn’t a question of if there was a fire on a given day, but where was the fire.
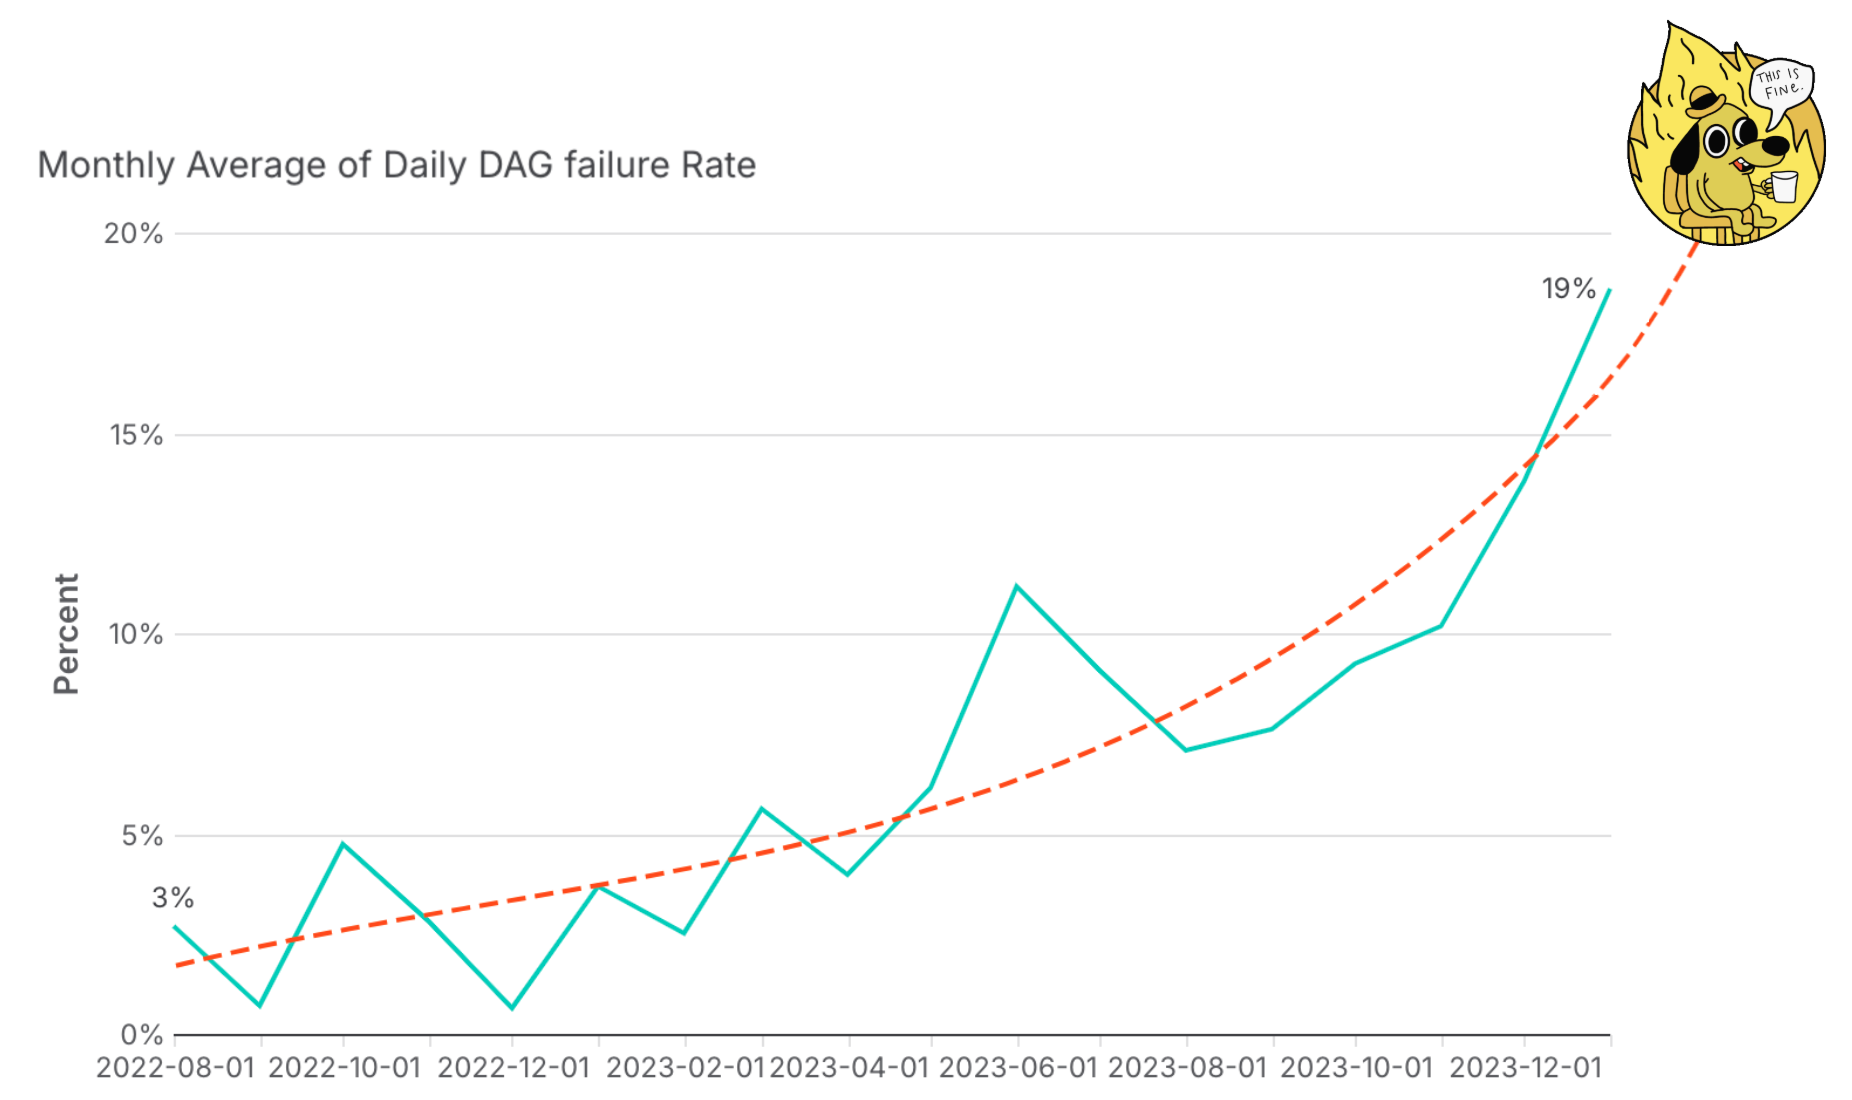
Our growing monthly average of daily DAG failure rate projecting meltdown.
Reimagining our Architecture: Goodbye Sensors, Hello Assets
As data engineers we’re the first responders to those broken pipelines, and we were spending more and more time troubleshooting and maintaining existing pipelines instead of on new interesting work.
Meanwhile demand for new interesting data didn’t slow: in fact our team was being asked to embed customer metrics directly into our product Astro (using Astro to build Astro, very meta). This would mean more DAGs, more dependencies (yikes), and increased external pressure to meet new SLAs. But we knew we couldn’t deliver on those expectations until we were confident in the stability of our pipelines. So, we took a step back to rethink our Airflow implementation, assessing what served us and what didn’t. Our DAG factory and TaskGroups still served us well but we needed a new way to manage our pipeline dependencies, because relying on sensors feels so pre-Airflow 2.4.
So how do we replace our sensors? Airflow Asset Scheduling!
Instead of coordinating dependencies with sensors, each DAG now triggers downstream DAGs automatically after completing successfully. So when there is a failure, that is the root cause. Getting things back online is just about fixing the failed DAG, and Airflow takes care of the rest. No more manual orchestrating.
That was easy! Or, was it?
New Scheduling, New Problems
Once we switched to asset scheduling, we hit an unforeseen issue. Now that all my sensors aren’t cascading red, I no longer know the blast radius or severity of any given pipeline failure. We had less red, but also less visibility.
Enter the Control DAG
So how do we solve our lack of visibility of what is online and offline at any given time? Let’s build a Control DAG - A DAG that monitors all other DAGs in the deployment. Sounds great in theory, right?
But how does one implement that in a scalable and self-sustaining way?
The answer was Airflow (again). Airflow knows our lineage; Airflow’s DAG dependency graph (shared above) is essentially a visual representation of our end-to-end pipeline across DAGs. So we leveraged the API behind it to build what we jokingly call our DAG of DAGs.
This was key for it to be scalable and self-sustaining. Every new dependency (sensor/asset/trigger) declared in our deployment, is auto-detected and monitored by the Control DAG without any additional work from the engineer.
We run it on our shortest scheduled interval, giving us real-time visibility into where we are in our end-to-end pipeline (what’s running, what’s about to run, what failed, what can’t run because something upstream failed, etc.). This gives us a sense of clarity in what used to be chaos.
Unexpected Shifts
The combination of switching to asset scheduling and the Control DAG led to a new DAG paradigm.
As a small team it is hard to manage a large number of DAGs, so initially we were incentivized to have fewer DAGs but with a lot of tasks. By a few we still mean ~100 — no one wants to page through DAGs to monitor.
With the Control DAG we’re now managing one DAG that is monitoring and reporting on all our other DAGs. So we're actually incentivized to break down our DAGs into smaller modular pipelines. Which means when things fail they tend to have a smaller blast radius.
These three changes led to a big drop in our failure rate, and our cortisol levels.
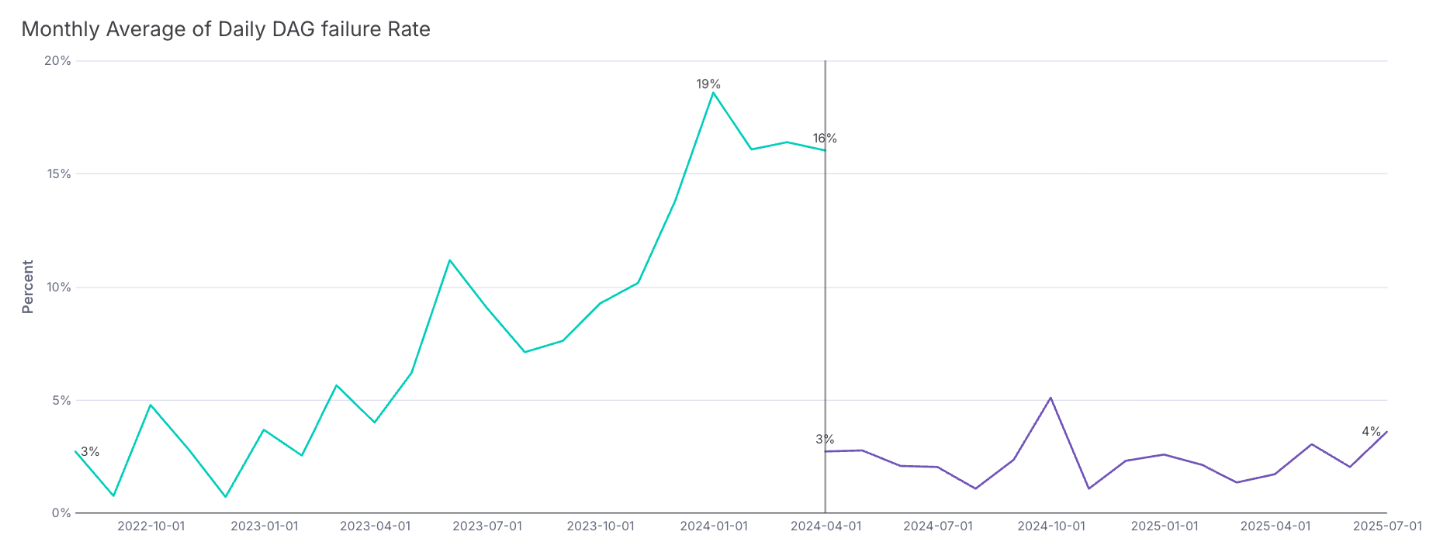
Our previous growing monthly average of daily DAG failure rate, with the average rate post- Control DAG/Asset Scheduling/Dependency Decoupling.
Enter Astro Observe
While our Control DAG has been working well for our team, our need for pipeline reliability and visibility isn’t unique to us. And it’s not the most scalable solution for every team to implement for themselves. Astronomer’s product team observed (😉) this and introduced Astro Observe, because every Airflow user should understand their pipeline health.
To implement, we configured our key deliverables which are essentially a collection of Airflow objects (either asset, DAG, or task granularity) or Data Warehouse tables as data products – i.e. your rETLs, model updates, dashboards, etc.
The data product page gives us a snapshot of our pipeline health by business context. It simplifies our complex cross-DAG dependencies into easily digestible, stakeholder-aligned deliverables. There’s no native, actionable view for cross-DAG dependencies unless you’re running 100% asset-driven pipelines in Airflow 3+ (in which case, congrats), or you’ve invested in building a custom Control DAG.
This view has become a one-stop shop for surfacing what really matters to the business. It helps us quickly identify which deliverables are delayed or impacted by pipeline failures, making it easier to prioritize fixes and keep stakeholders informed.
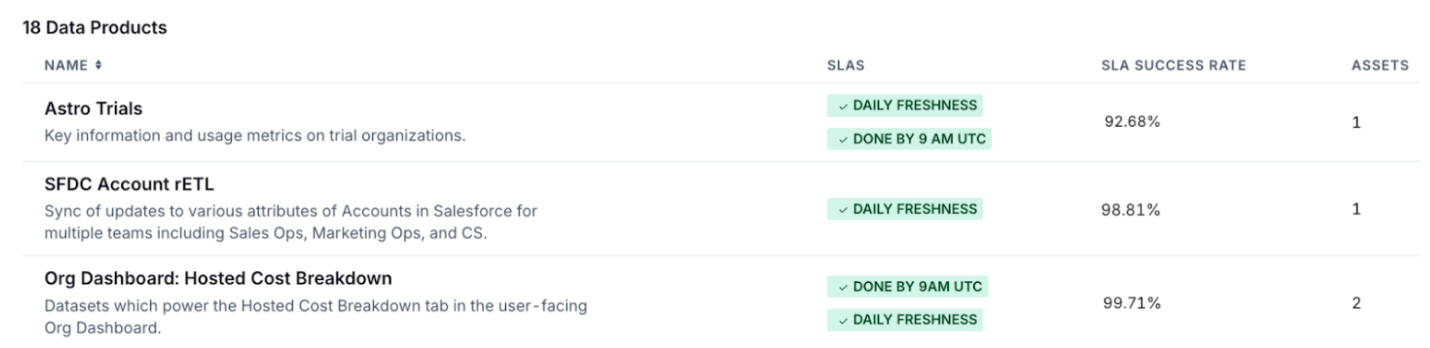
Sneak peak at 3 of our 18 data products.
For each data product we’ve set up SLAs and alerts for each so that we can be notified of failures or missed SLAs. Including proactive alerts to help notify you before you even have an SLA breach.
When these alerts are triggered they send a link that allows you to quickly open the affected data product and see the suggested root cause(s) in the timeline view, where you can see the most upstream failure(s) related to the data product and a log summary of what happened.
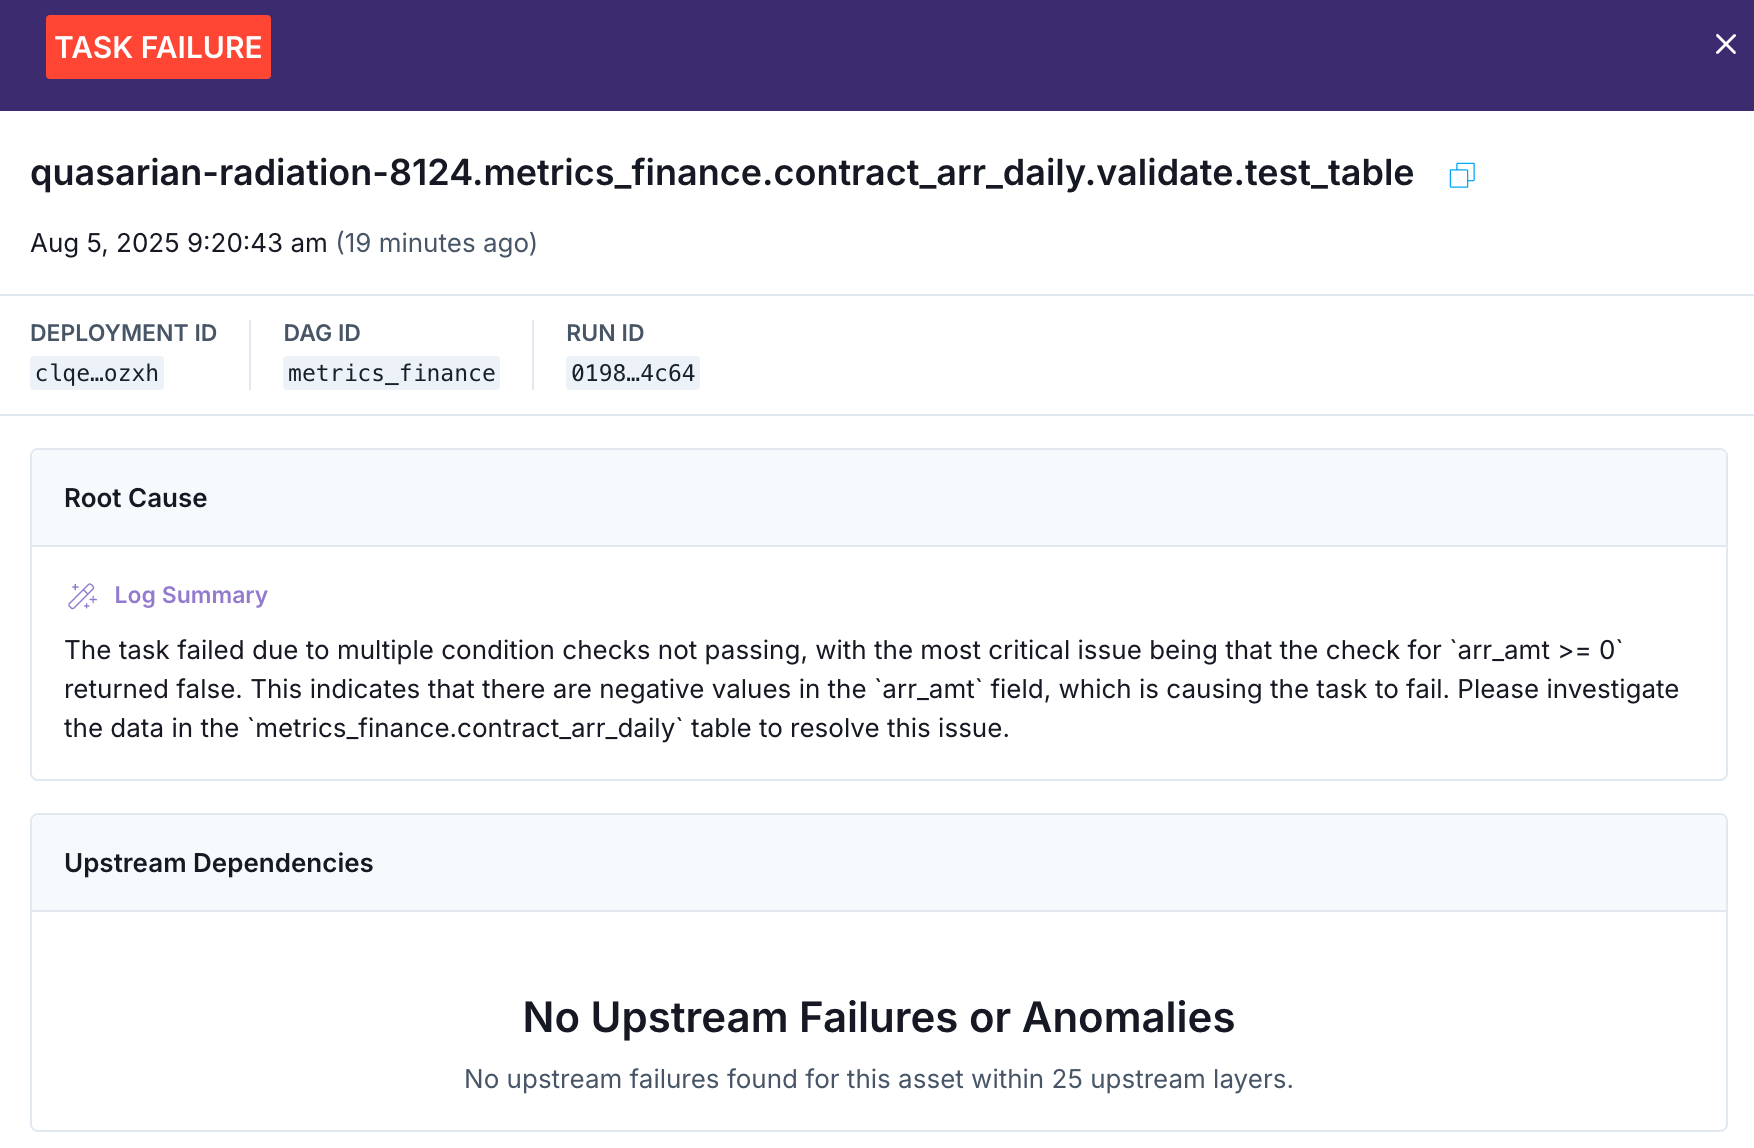
Astro Observe’s RCA View
With Astro Observe’s alert functionality plus contextual grouping of Airflow pipelines, we’ve now switched from relying on the Control DAG for our pipeline health monitoring to Astro Observe.
The Control DAG does still remain but for secondary operational benefits but we can save that for a different blog post.
Conclusion
The road to a reliable Airflow architecture isn’t always linear, and your implementation priorities can change as you scale. While what we needed to be confident in our pipelines didn’t exist when we endeavored building the Control DAG, maybe you can skip our intertrim step and go directly to Astro Observe.
Want to hear more about our reliability journey? Join me on August 21st for a live webinar — register here.
Curious about how Astro Observe can support your team? Check out this quick product tour.

Get started free.
OR
By proceeding you agree to our Privacy Policy, our Website Terms and to receive emails from Astronomer.