This is feature is only available if you are on the Enterprise tier or above. See Astro Plans and Pricing.
- Organization Overview
- Deployment Detail
- Cost Breakdown
- Operator Use
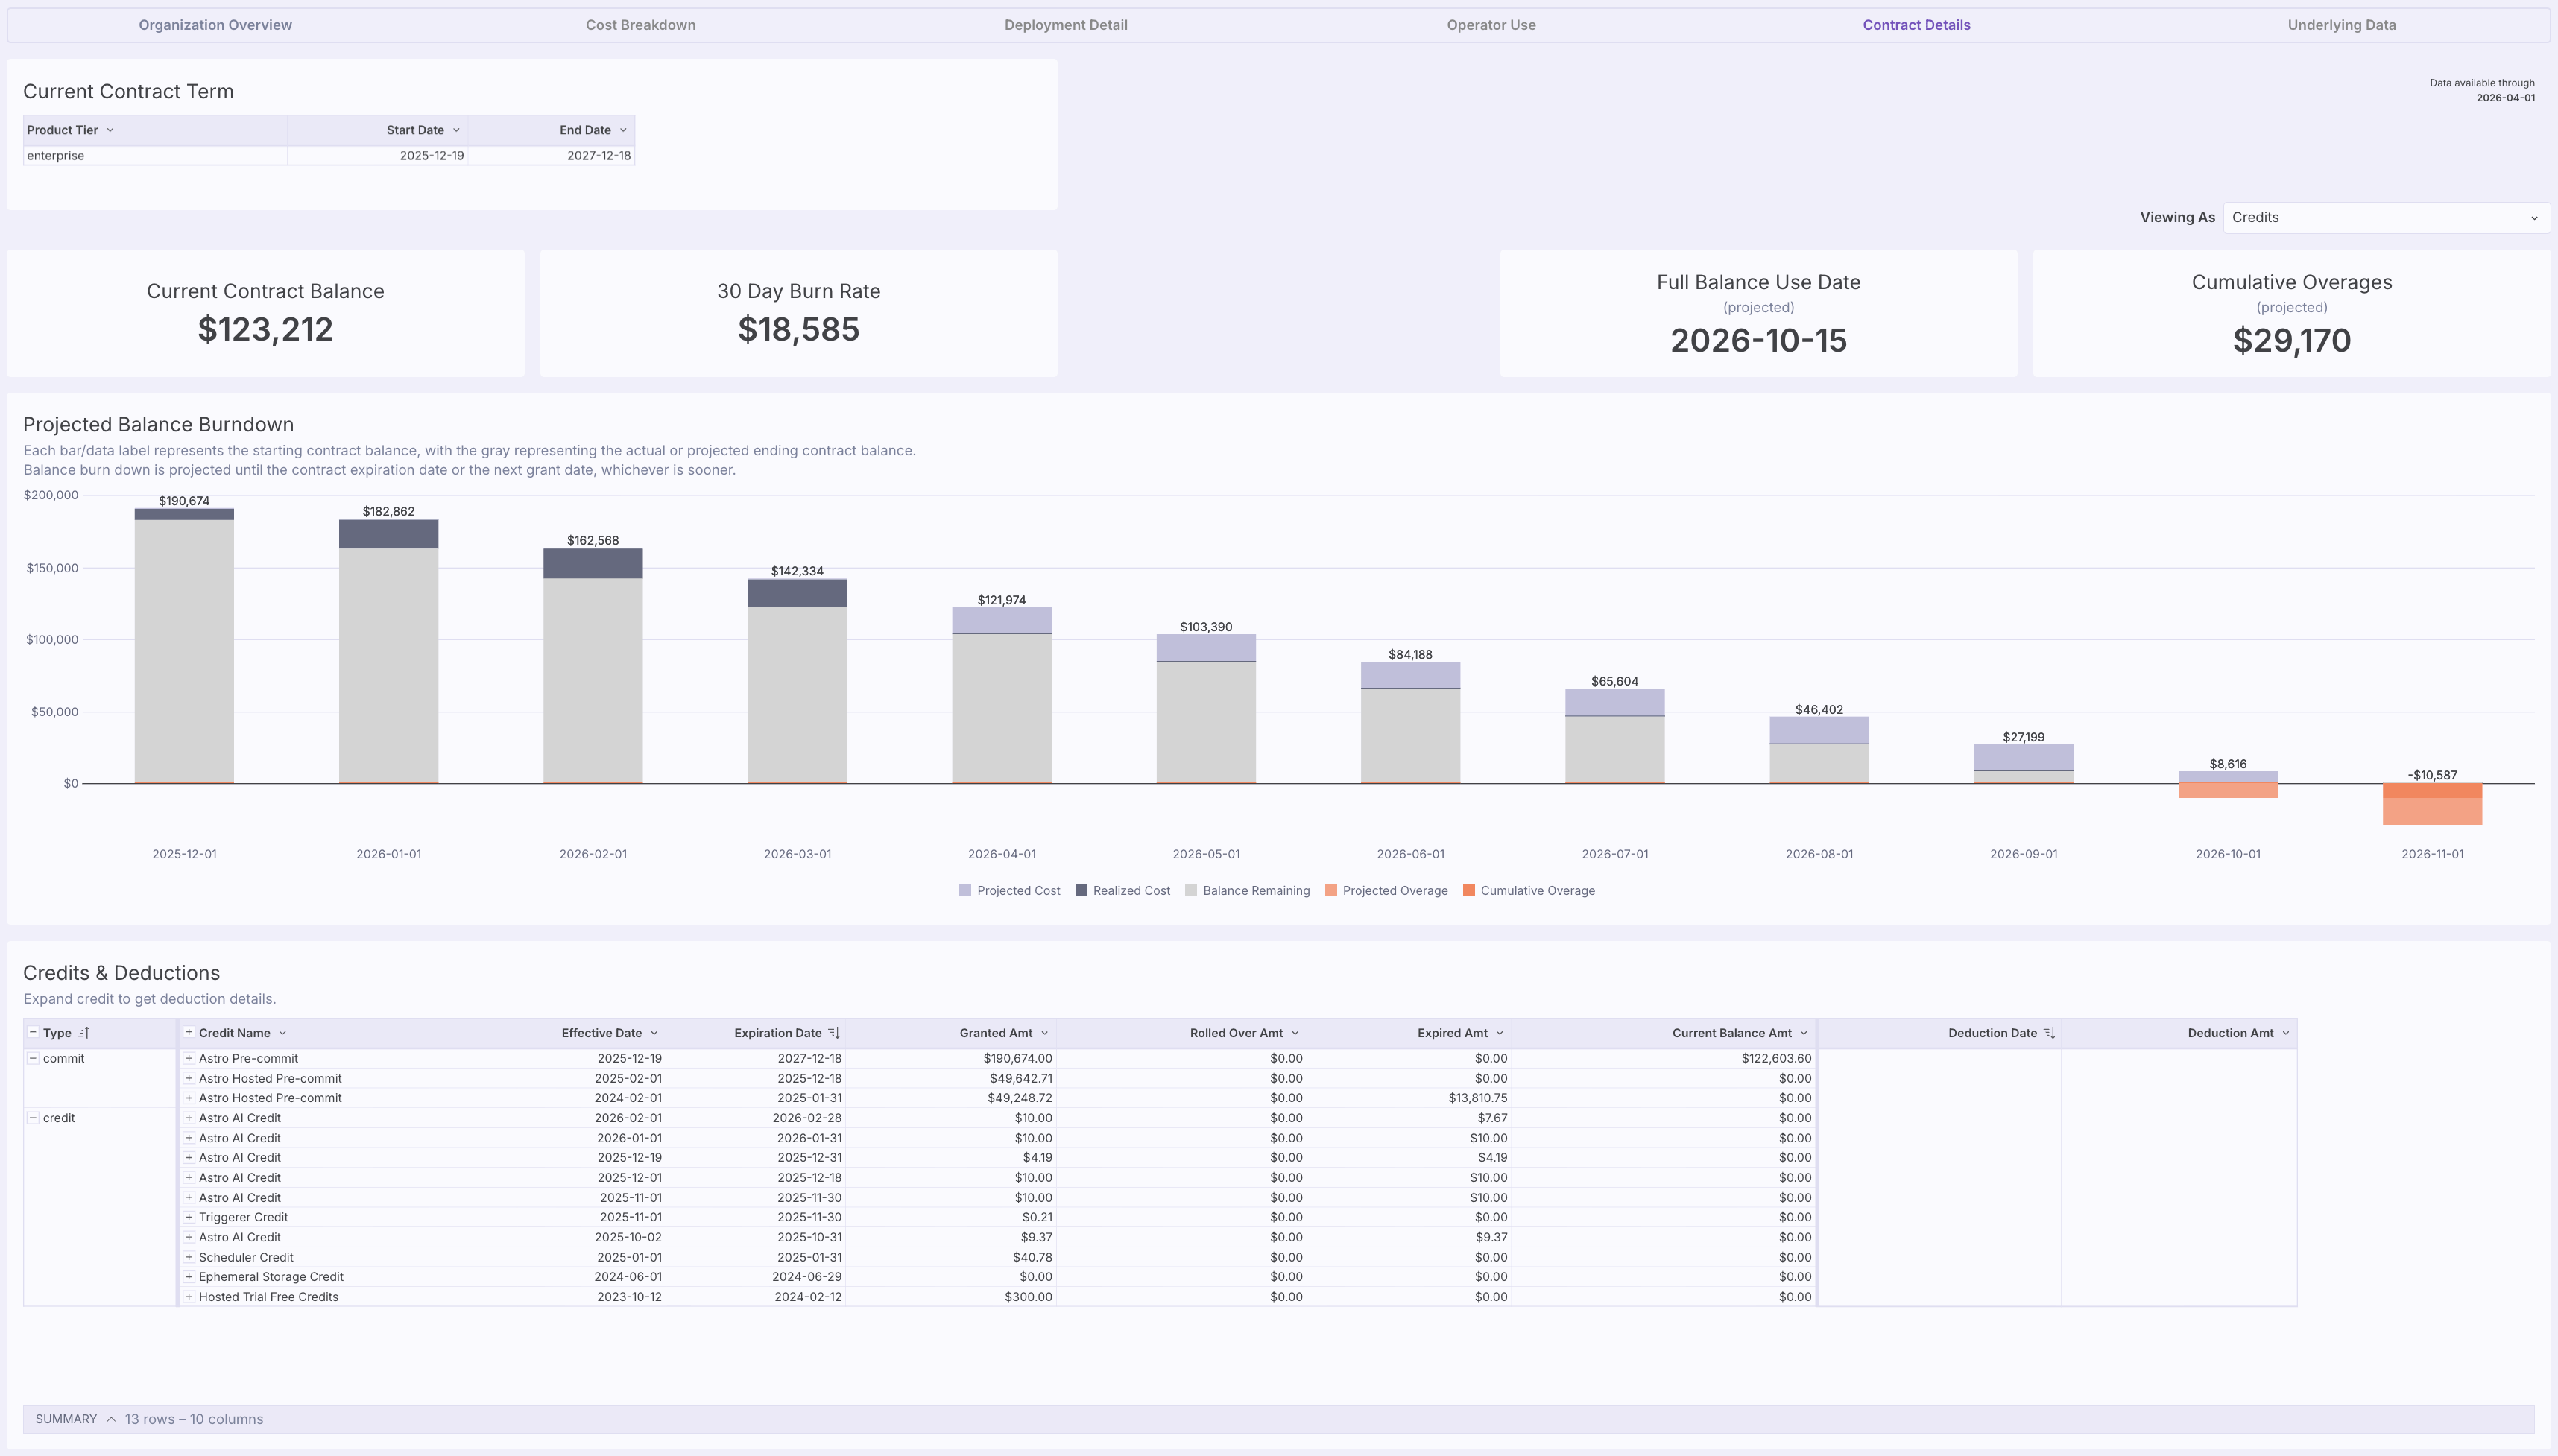
- Contract Details
Only users with Organization Billing Admin user permissions can access Organization dashboards.
Organization overview
The Organization Overview dashboard provides at-a-glance summaries about activity across your Organization’s Deployments. You can also filter to view summaries for specific Workspaces or Deployments. This dashboard allows you to compare the activity and performances of Deployments to one another. You can identify Deployments, dags, or tasks that have had recent behavior changes or are performing in an unexpected way. For example, you can filter the data shown by time period, Workspace name, or Deployment name, to view data such as the number of successful or failed tasks within Workspaces or Deployments. Hovering your cursor over any of the charts brings up a detailed view of the data, indexed by date. By examining your data at the Organization level, you can identify Deployments with large numbers of failing tasks by looking at the graphs or charts for outliers. Then, you can filter by time period to see if there have been similar events in the past and when.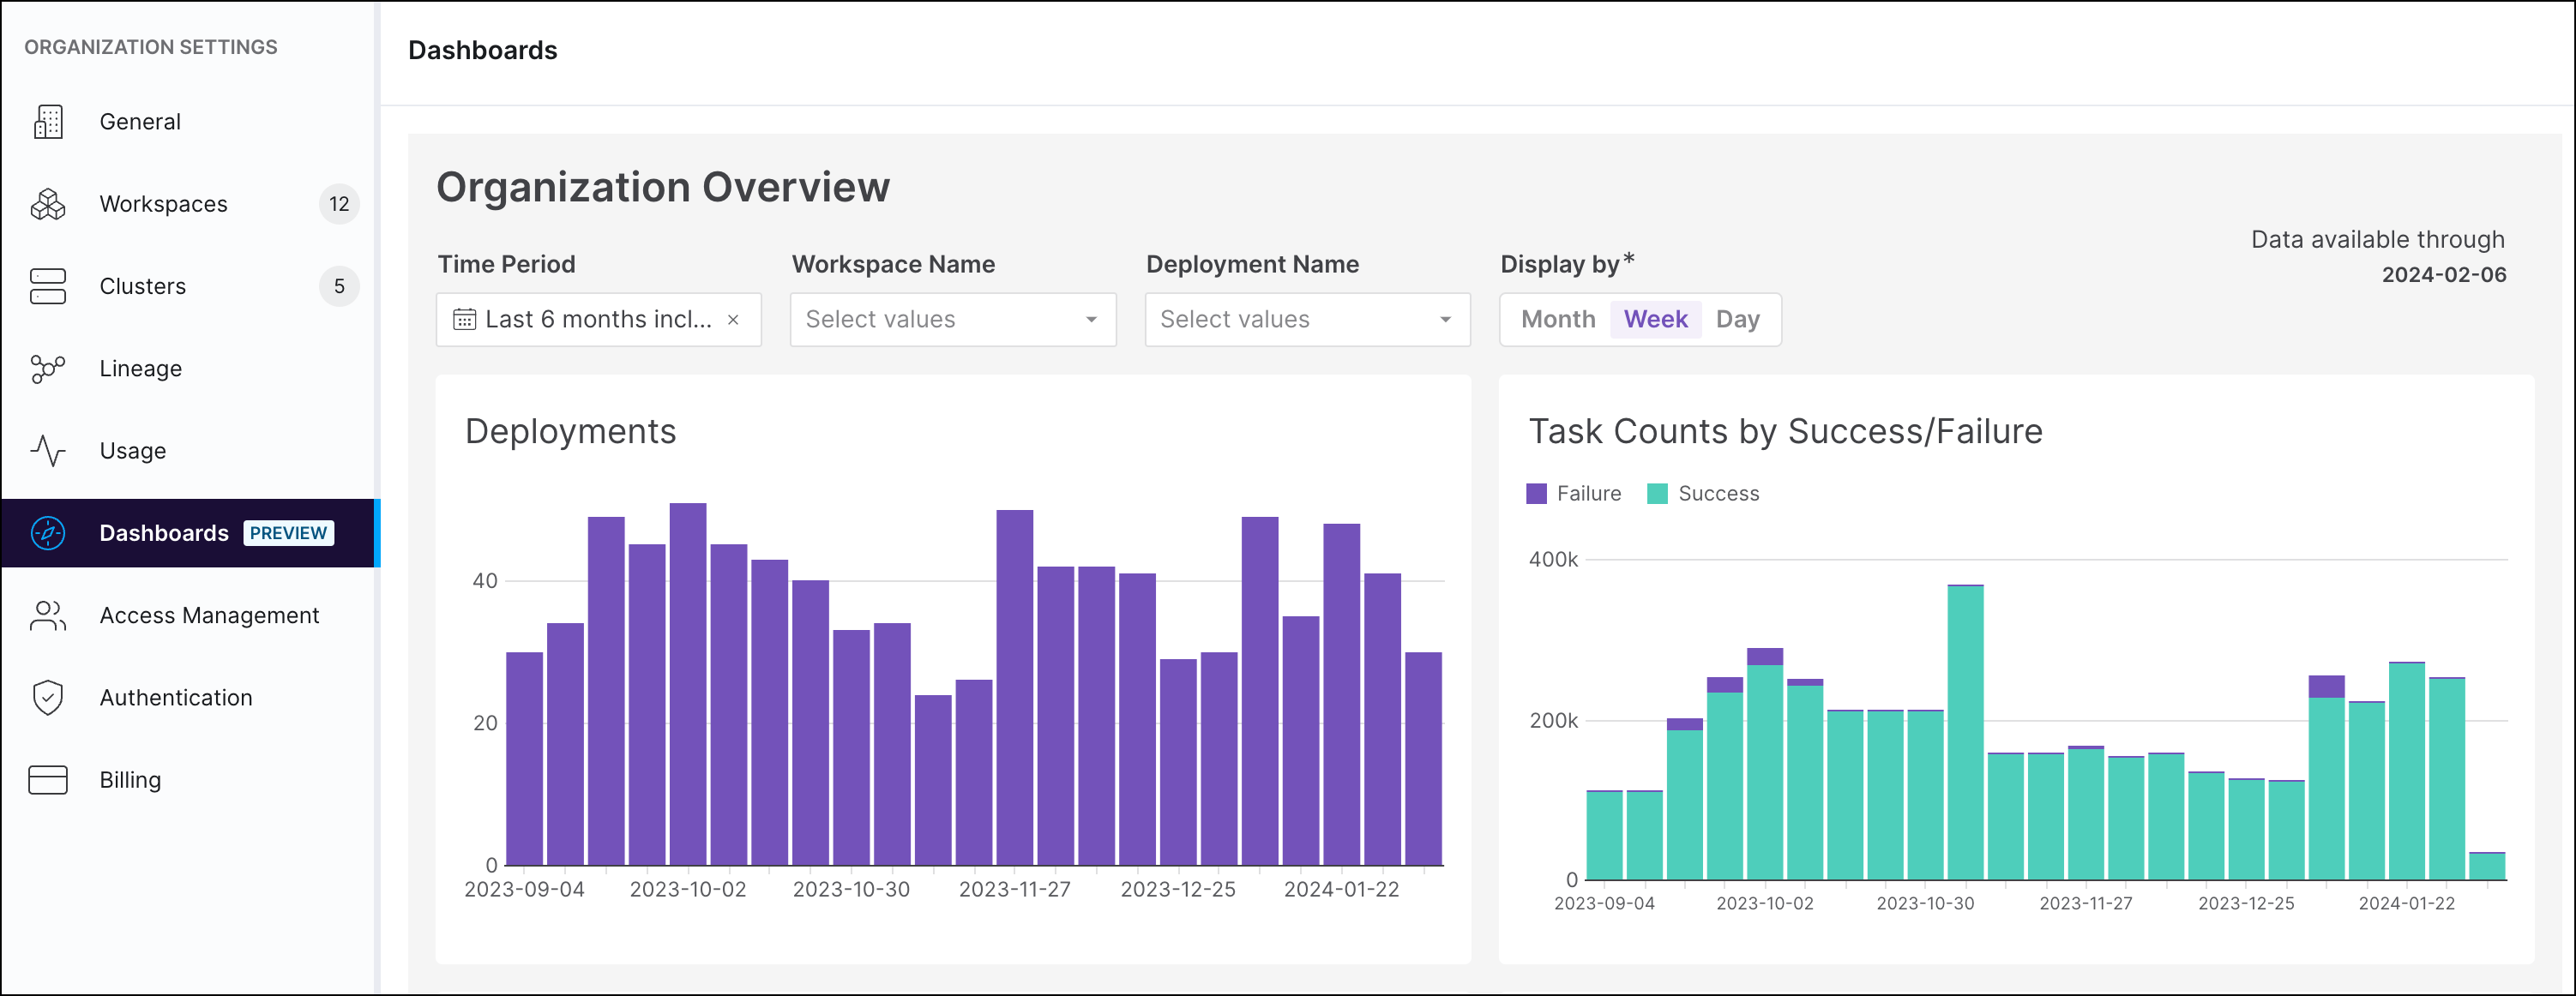
Deployment Detail
The Deployment Detail dashboard shows a table of all Deployments in your Organization, indexed by Workspace name. For each Deployment, the dashboard shows your Deployment configurations as well as use metrics like task run counts, dag run counts, and operator counts. Use this dashboard to check that your Deployment has the appropriate resources based on the number of dags it runs. You can also use this dashboard to check whether a Deployment’s Astro Runtime version is currently supported.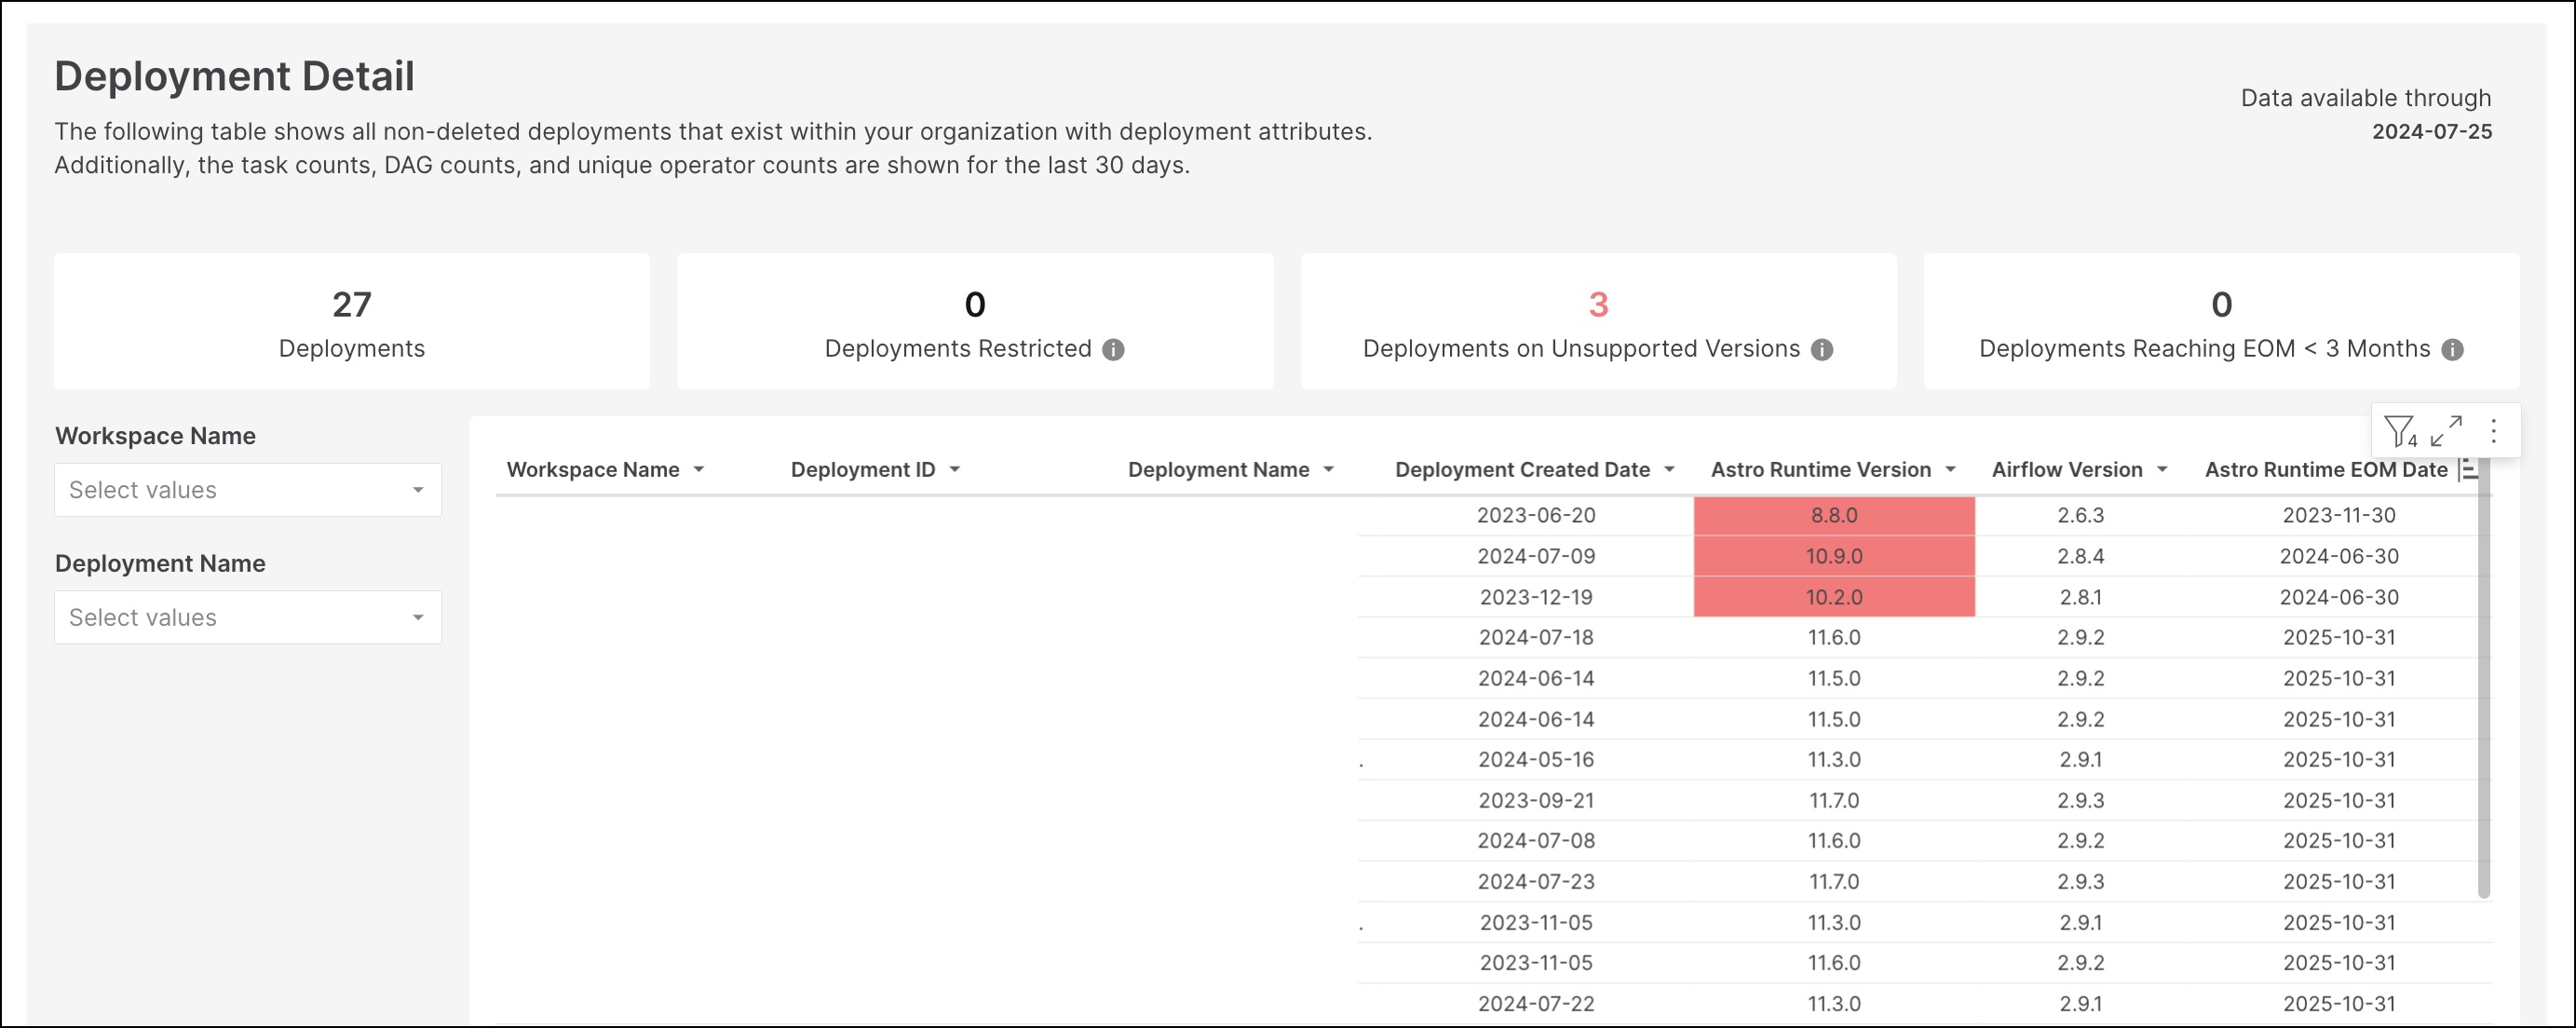
Cost Breakdown
The Cost Breakdown dashboard displays your Astro spending over time across the following cost categories, which you can filter by time period, Workspace name, or Deployment name:- Deployment
- Cluster
- Compute
- Network
- Remote Execution
- AI Tokens
- Observe
- Triggerer
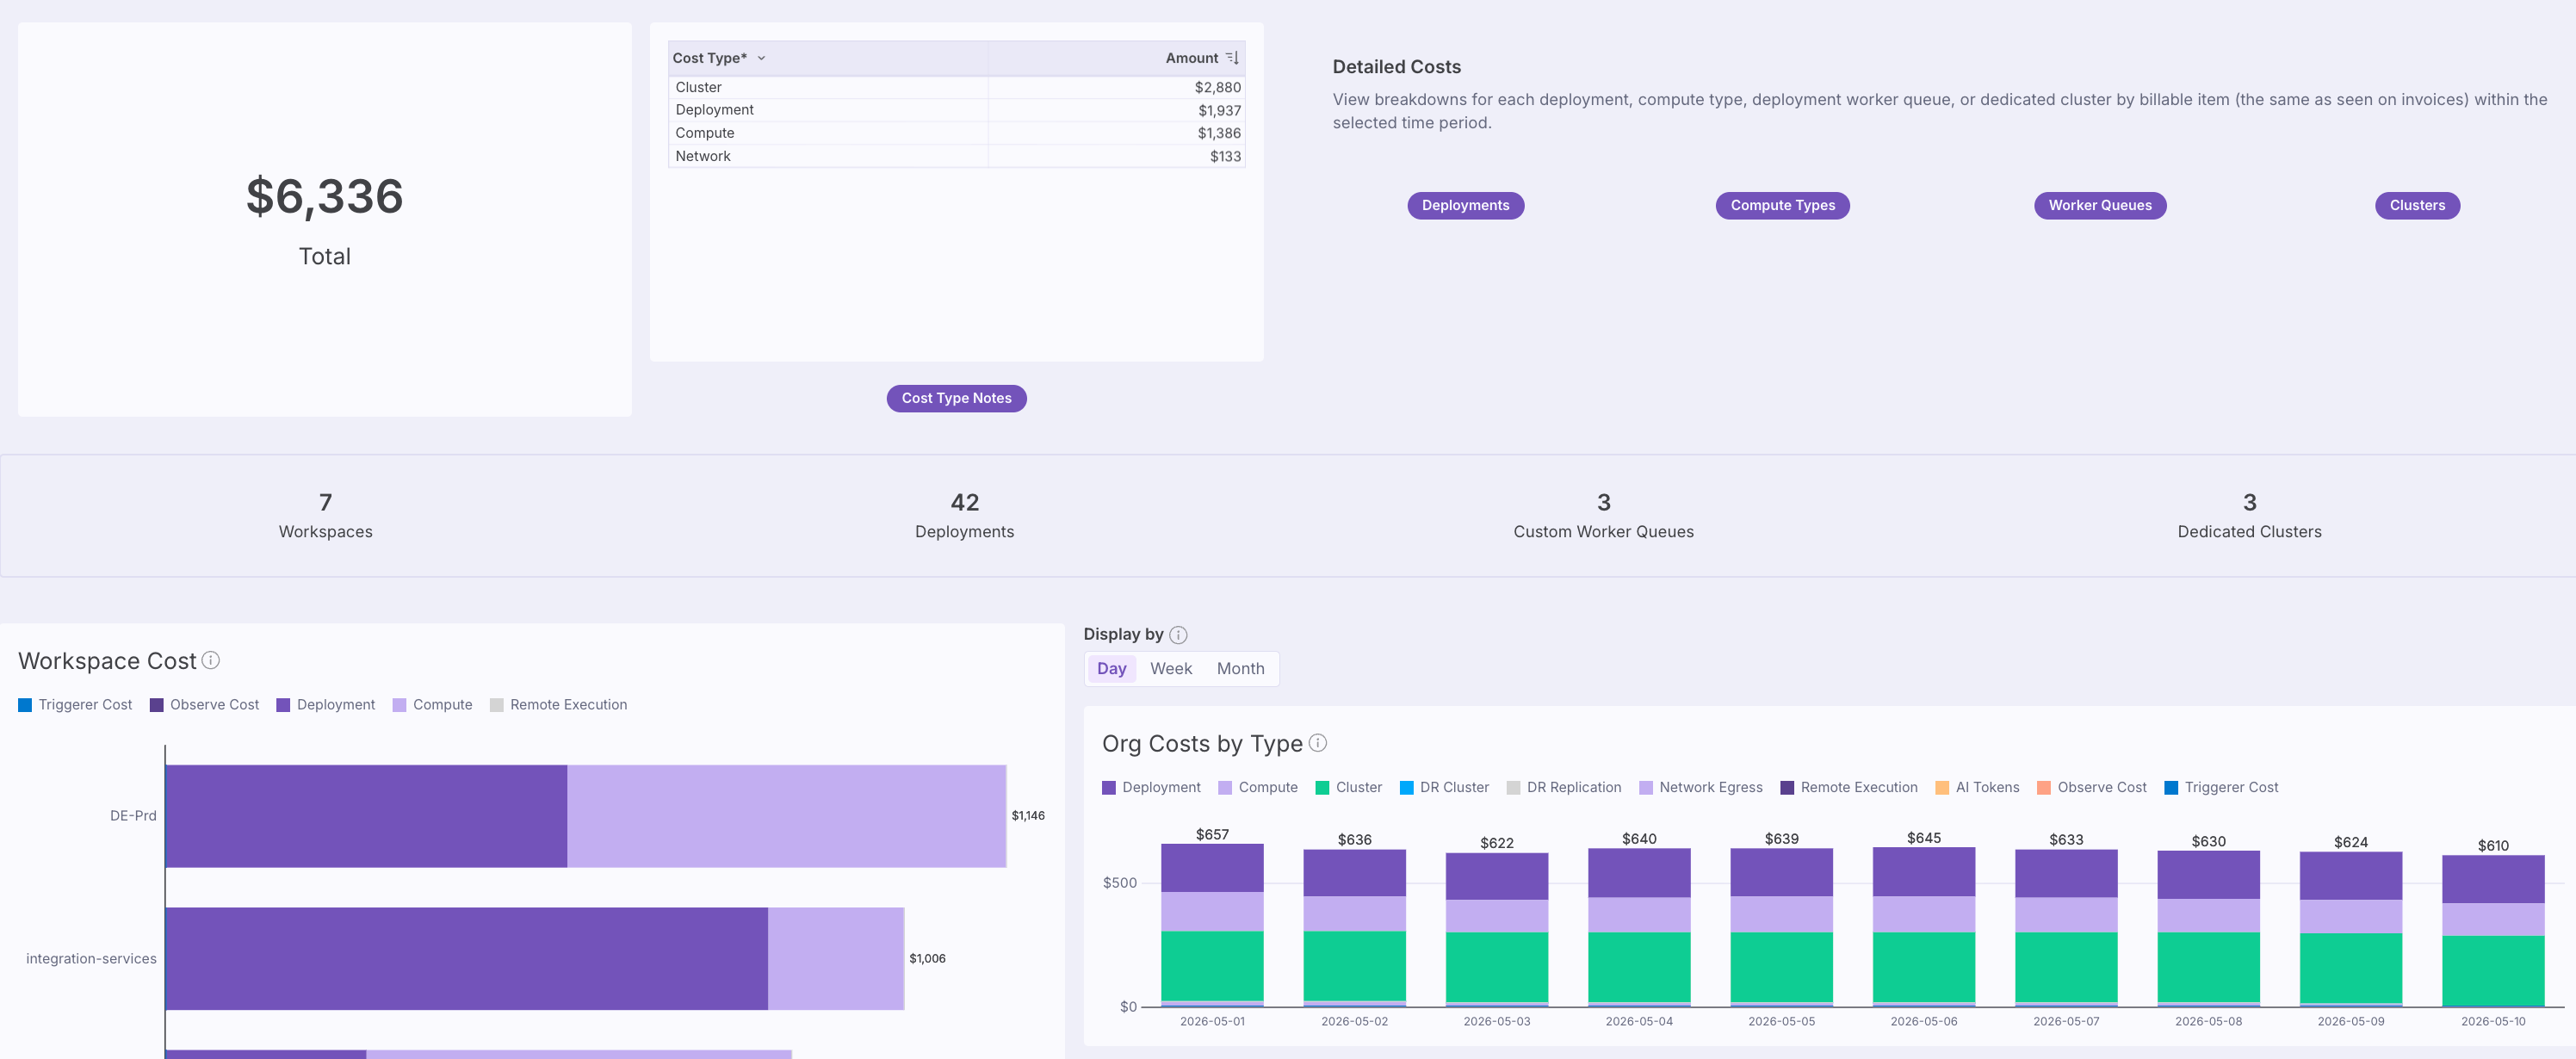
Detailed Costs
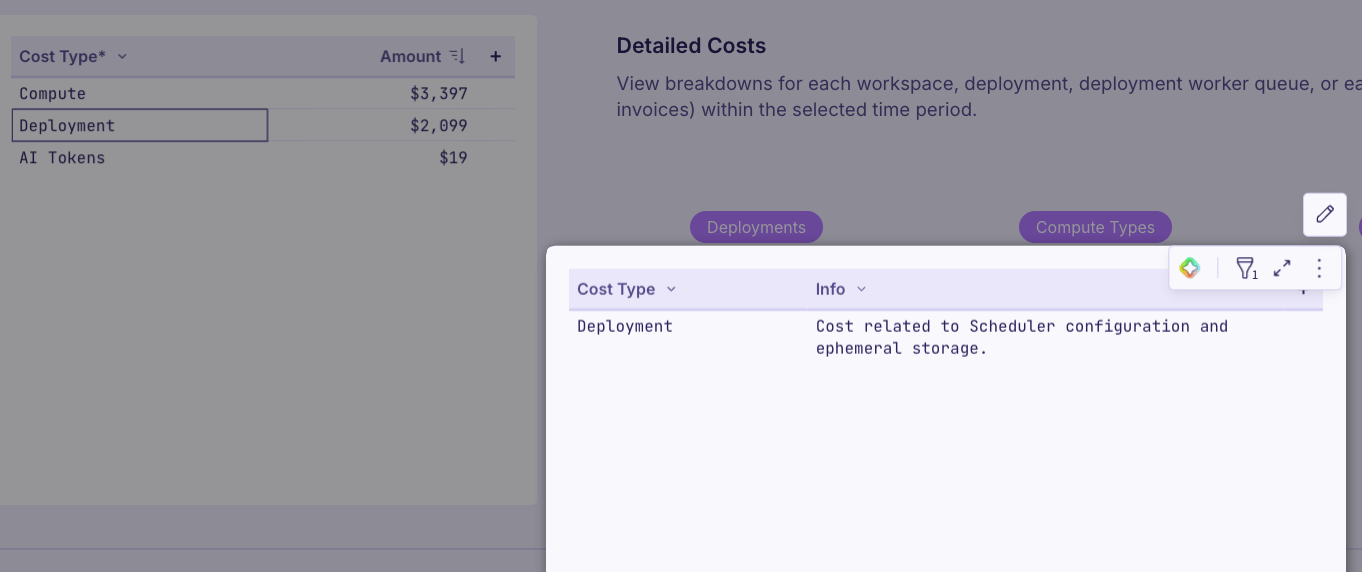
The Detailed Costs view provides granular breakdowns for each Workspace, Deployment, Deployment worker queue, or each dedicated cluster by billable item (the same as seen on invoices) within the selected time period. Use the Deployments, Compute Types, Worker Queues, and Clusters tabs to switch between breakdowns. Each breakdown displays a Cost Type table that groups your spending into billable categories such as Compute, Deployment, and AI Tokens, alongside the total amount for the selected time period. Select a cost type to see a description or relevant notes about what that cost type includes. For example, the Deployment cost type covers costs related to Scheduler configuration and ephemeral storage.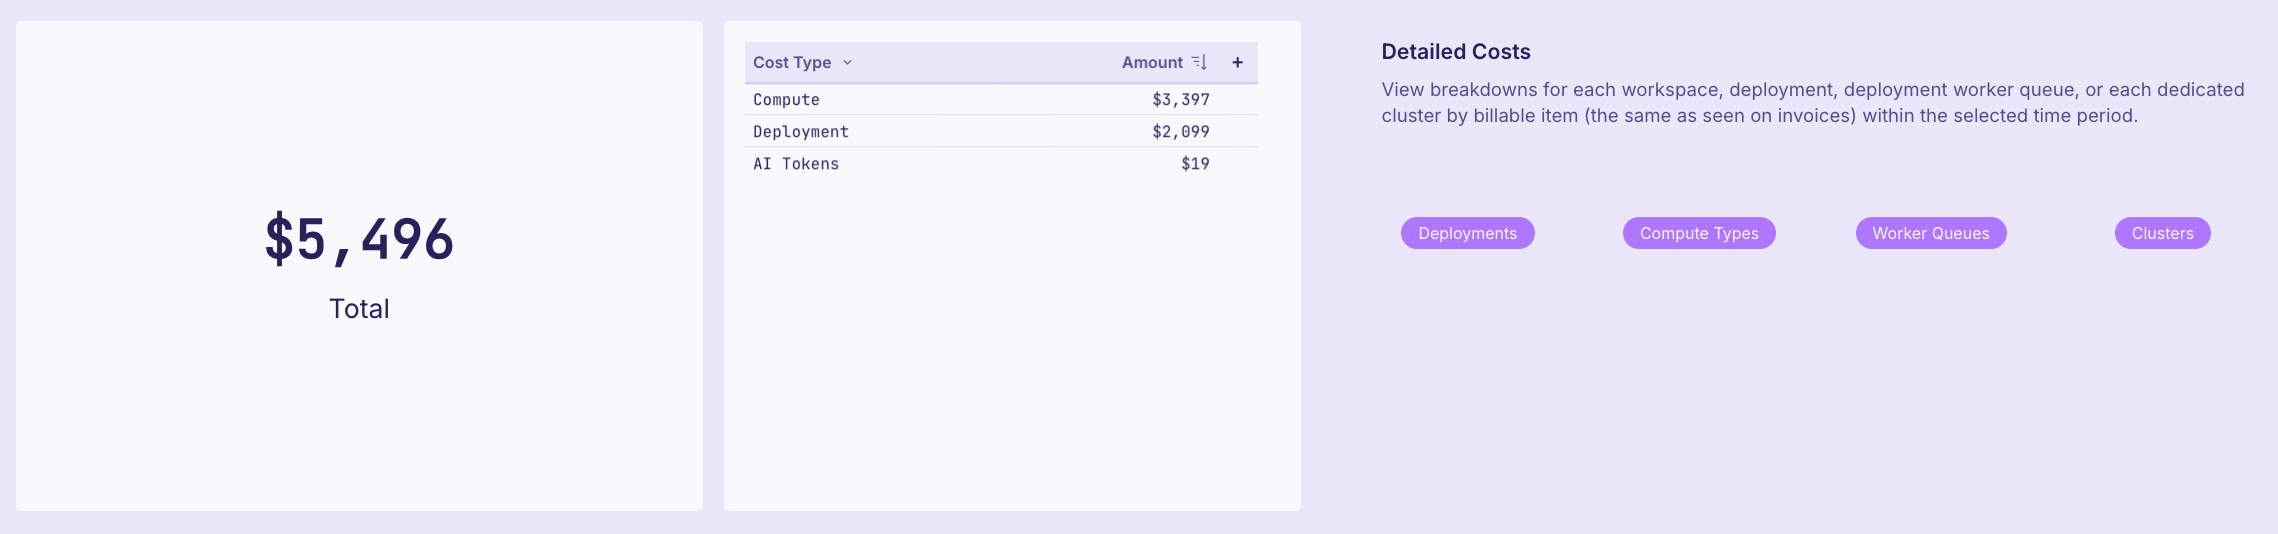
Detailed Cost for Astro AI
The Detailed Cost for Astro AI view breaks down your Astro AI spend, including Otto usage, by billable item within the selected time period. Astro AI has two billable items:- Model Chargeback: The cost to run a model through the Astronomer LLM gateway.
- Otto Intelligence Fee: A flat fee on the tokens that pass through the Astronomer LLM gateway.
- Source: Where the usage came from, such as Astro CLI or Investigation.
- Model: The model that processed the request.
- Subject Type: The type of identity that made the request, such as User or Servicekey.
- Subject ID: The ID of the user or service key that made the request.
- Source, Subject Type, and Subject ID attribution isn’t available for Model Chargeback items before September 15, 2026.
- The view doesn’t show user emails or service key names. To find the usage of a specific user or service key, filter by Subject ID. To find the ID of each user in your Organization, run
astro organization user list. To find the ID of each service key, runastro organization token list. - You can also look up a Subject ID in the Astro UI. Go to Organization Settings, then select Users (for User subjects) or Tokens (for Servicekey subjects), and search for the subject by its ID.
Operator Use
The Operator Use dashboard shows how your Deployments and Workspaces use Operators, as well as how often tasks succeed and fail when using specific operators. Use this data to identify types of operators that could be replaced with more efficient alternatives, or to find operators that fail more than expected. This dashboard provides data to answer the questions, What are the top operators used across my organization? and Which workspace is using the selected operators the most?.Contract Details
The Contract Details dashboard shows your Organization’s credit or dollar usage against your current contract. Use this dashboard to monitor your remaining balance, view your projected burn rate through the end of your contract term or until your next grant, and review individual credit and deduction history.