Lineage
Astro visualizes real-time lineage based on Airflow run metadata. You can view the lineage for a specific data product or asset to understand data dependencies and run history.
View lineage
To view lineage, navigate to a data product or asset and click Open Lineage.
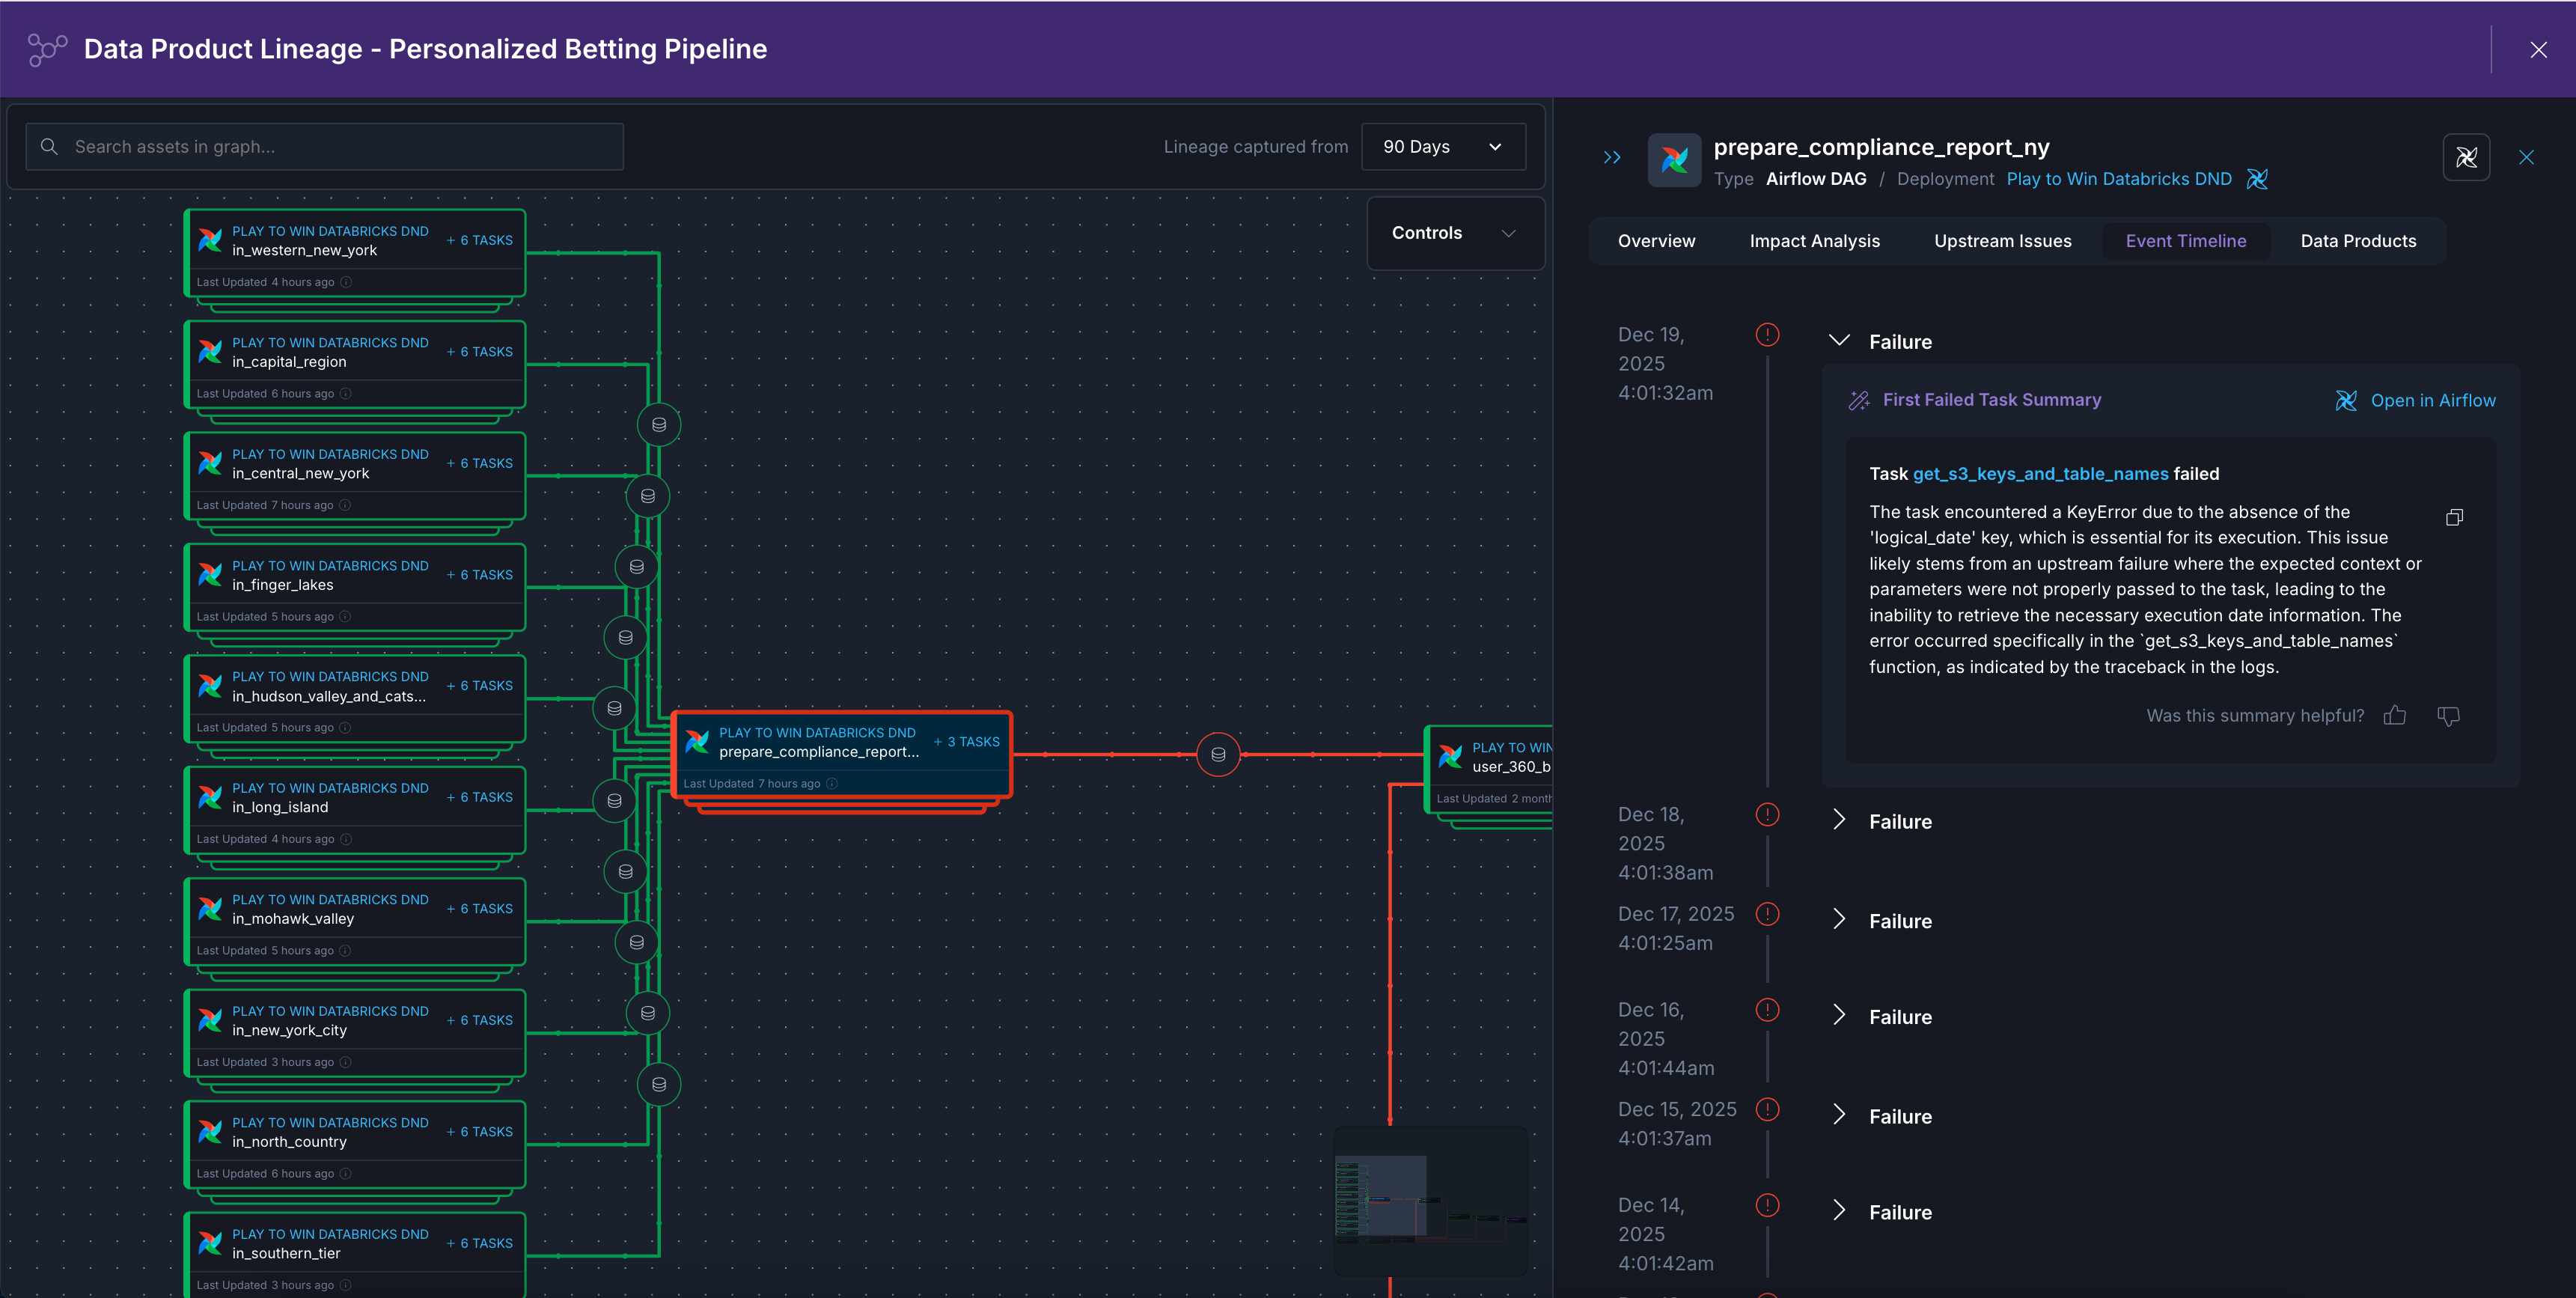
By default, the lineage graph displays dags, tasks, datasets, and tables that ran or were updated any time in the last 90 days. You can update this time range by changing the Lineage captured from filter in the top right of the lineage graph. Click any asset to highlight its upstream and downstream dependencies in the graph and see asset metadata, like an Event Timeline of its run or update history and which Data Products the asset belongs to.
Search and filter lineage
Use the controls to customize your view of the lineage graph:
- Search: Use the search box in the upper left of the graph to find specific assets by name.
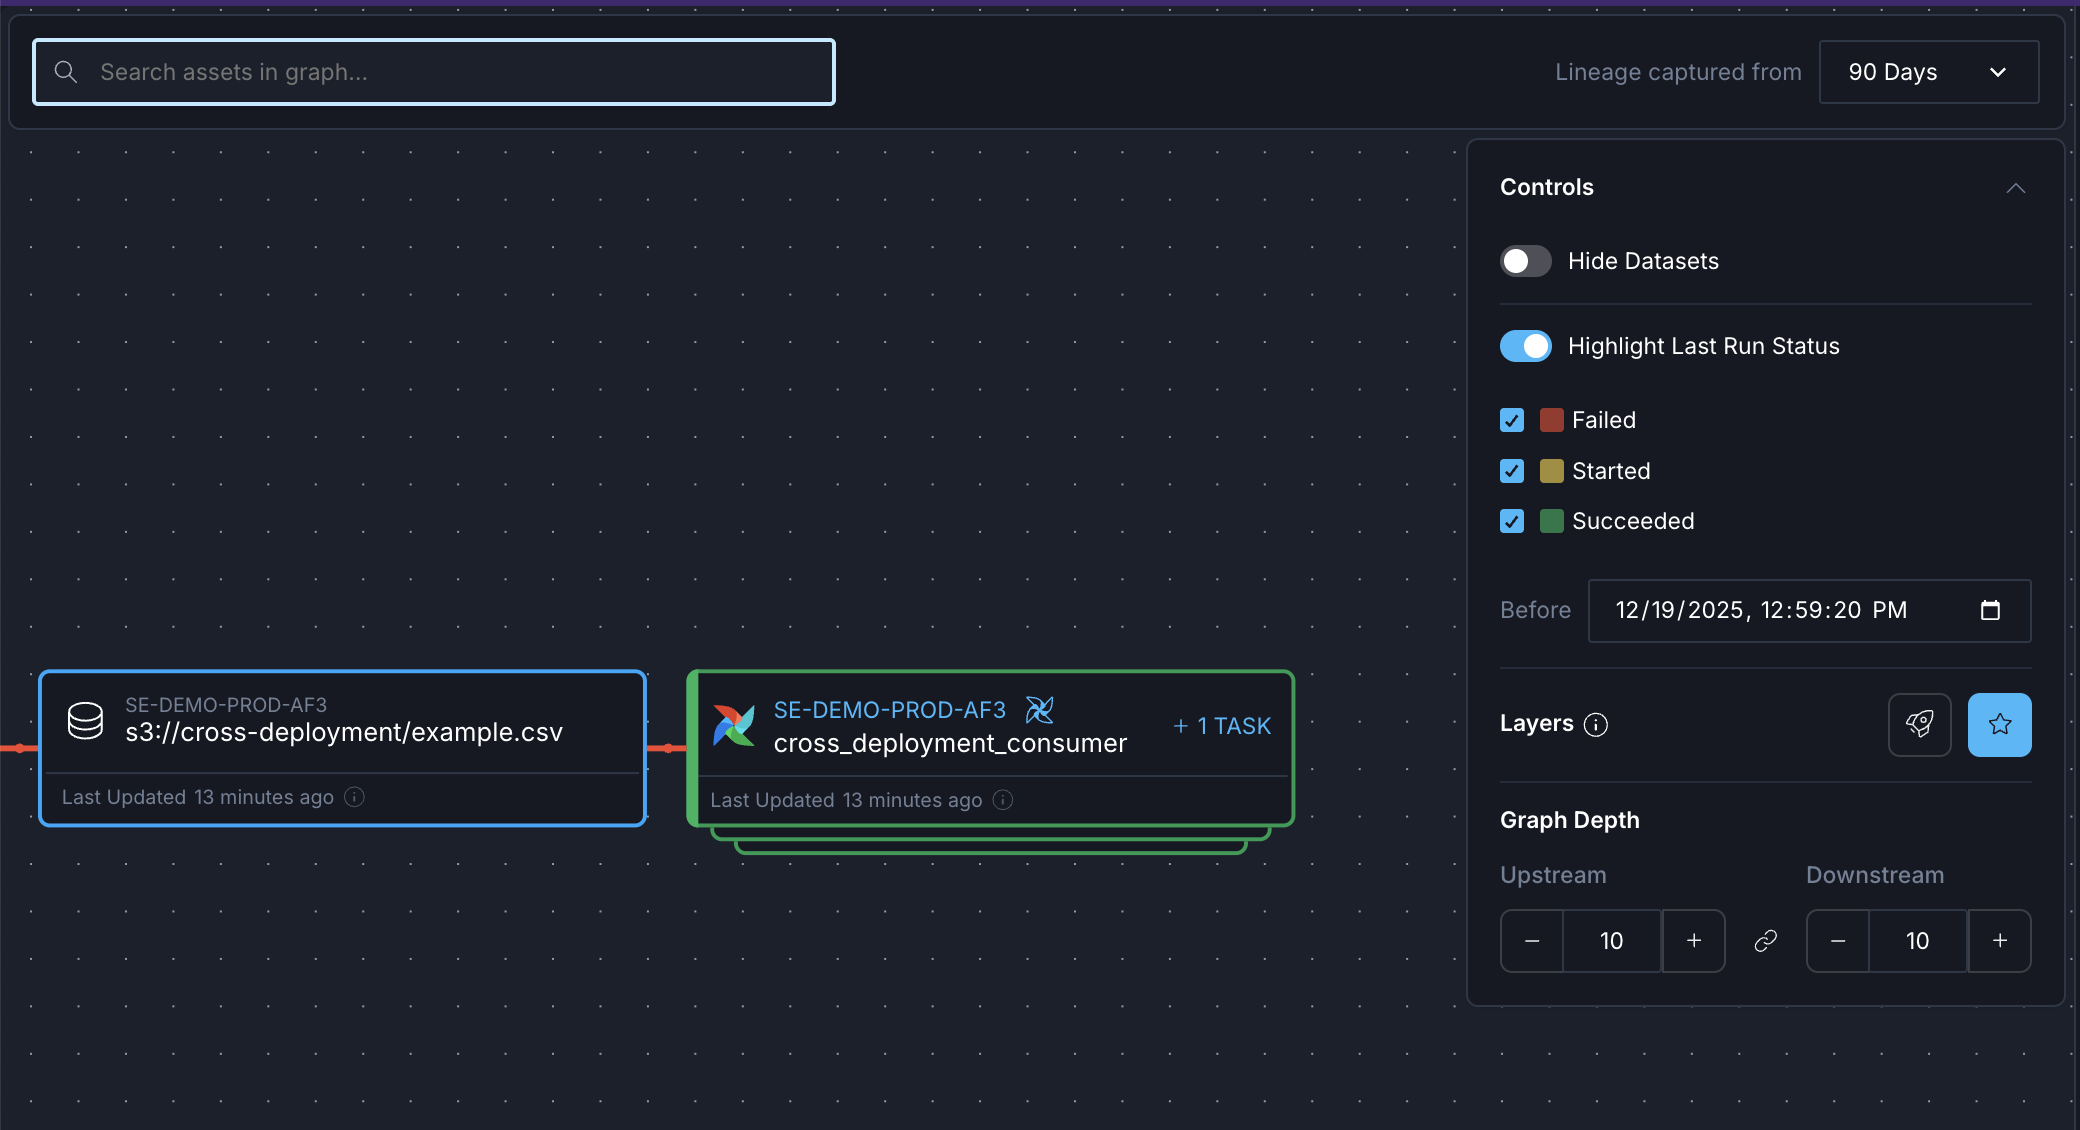
- Lineage captured from: Determines which assets appear in the graph. Any asset with a run or update event in the selected time range will appear in the graph.
- Hide Datasets: Toggle to hide or show dataset nodes from the graph to reduce noise.
- Highlight Last Run Status: Toggle to highlight assets based on their last run status. The Before filter allows you to see run status before a specific point in time. For example, you can view the last run status before the timestamp of a known failure to see which exactly task in your pipeline failed. This time filter also affects which events show up in the Event Timeline tab of a selected asset.
- Layers: Highlight Deployments highlights Astro Deployments across the lineage graph. Highlight Key Assets highlights the final assets in data product graphs, and the primary asset in asset graphs.
Adjust graph depth
By default, data product graphs include 10 levels upstream of the selected final assets. In asset graphs, you can control how many levels of dependencies to display:
- Upstream: Adjust the number of upstream dependency levels to show using the + and - buttons.
- Downstream: Adjust the number of downstream dependency levels to show using the + and - buttons.
The graph depth controls help you focus on the most relevant dependencies for your analysis.
View asset details in lineage
Click any asset in the lineage graph to open a side panel with detailed information, including:
- Basic: Asset metadata including FQDN, Name, and Namespace
- Dag Metadata: Owner and Tags (for Airflow assets)
- Source: Last updated timestamp and last updated by information
The side panel also includes tabs for:
- Impact Analysis: View assets downstream of the selected asset. By default, this view only shows leaf nodes, or nodes with no further downstream assets. You can change this by toggling the Only Leaf Assets control.
- Upstream Issues: See any issues in upstream dependencies. By default, this view only shows upstream issues that had a failure or anomaly. You can change this by toggling the Only Problems control.
- Event Timeline: View a history of run events or update events for this asset. Failed dag and task runs display a summary of the failure logs for troubleshooting.
- Data Products: See which data products this asset is part of to understand the potential impact across the business.