Data quality and Airflow
Data quality is fundamental to trustworthy analytics and AI. Silent data issues, like missing records, schema changes, or duplicate entries, can go undetected until dashboards break or models fail. By then, the damage is done.
This guide covers Dag-level checks with SQL check operators, platform-level checks with Astro Observe, and third-party frameworks, giving you the tools to build a comprehensive data quality strategy.
SQL check operators that run as part of your pipeline, with full control over failure behavior and notifications.
Astro Observe monitors that run independently of Dag execution, with table-level lineage and event-driven checks.
Great Expectations, dbt tests, and Soda Core for additional validation capabilities.
Types of data quality challenges
- Volume anomalies: Unexpected spikes or drops in row counts.
- Schema drift: Column types changing without notice.
- Completeness issues: Null values in critical fields.
- Duplicate records: Compromising uniqueness constraints.
- Business rule violations: Negative amounts, invalid dates, orphaned records.
Two approaches to data quality
Data quality checks can be implemented at two levels. You often need both: Dag-level checks catch issues before bad data propagates, while platform-level checks provide coverage even when Airflow itself has problems. This also includes checks when data lands, before any Dag processes potentially problematic data.
Dag-level checks do not have to stop your pipeline
You have several options to control failure behavior:
- Trigger rules: Use trigger rules like
all_doneornone_failed_min_one_successon downstream tasks to continue despite failed checks. See Airflow trigger rules. - Shell exit code handling: When calling third-party frameworks via
@task.bash, append|| trueor|| exit 0to prevent non-zero exit codes from failing the task. - Skip instead of fail: Set
skip_on_exit_codein@task.bash(...)to mark tasks as skipped rather than failed.
Important: Even when a task fails but the Dag succeeds (via trigger rules), task-level on_failure_callback still fires, ensuring you can get notified about check failures without blocking your pipeline.
Choosing a tool
Which tool you choose is determined by the needs and preferences of your organization. Astronomer recommends using Dag-level checks with SQL check operators if you want to:
- Write checks without needing to set up software in addition to Airflow.
- Write checks as Python dictionaries and in SQL.
- Use any SQL statement that returns a single row of booleans as a data quality check.
- Implement many different downstream dependencies depending on the outcome of different checks.
- Have full observability of which checks failed from within Airflow task logs, including the full SQL statements of failed checks.
Astronomer recommends using Dag-level checks with a data validation framework such as Great Expectations or Soda in the following circumstances:
- You want to collect the results of your data quality checks in a central place.
- You prefer to write checks in JSON (Great Expectations) or YAML (Soda).
- Most or all of your checks can be implemented by the predefined checks in the solution of your choice.
- You want to abstract your data quality checks from the Dag code.
In both cases, Astronomer recommends running platform-level checks for Airflow-independent data quality checks across your business-critical data products.
Dag-level checks with Airflow
When to use each operator
SQL check operators
To access the SQL check operators, install the Common SQL provider:
Import and use them within your Dag:
SQLCheckOperator
The SQLCheckOperator is the most generic check operator. It runs any SQL query and evaluates the result, giving you enough freedom to cover complex business rules. The check fails if any returned value evaluates to False in Python (e.g., 0, None, empty string).
SQLColumnCheckOperator
The SQLColumnCheckOperator validates individual columns using built-in check types. Define a column_mapping dictionary to run multiple checks in a single task.
Built-in check types:
Comparison options:
equal_to,greater_than,geq_to(>=)less_than,leq_to(<=)tolerance(percentage threshold, as a fraction:0.1= 10%)
partition_clause
The optional partition_clause is an additional WHERE filter applied before the checks. It can be added at the operator level (partitions all checks), at the column level in the column mapping (partitions all checks for that column), or at the check level (partitions just that check).
SQLTableCheckOperator
The SQLTableCheckOperator runs custom SQL expressions against a given table that must evaluate to true. It is suited for business rules spanning multiple columns or requiring aggregations.
The SQLTableCheckOperator also supports an optional partition_clause on check level for an additional WHERE filter applied before the check.
SQLValueCheckOperator
Performs a simple value check by comparing a SQL result to an expected value (pass_value). The value can be of any type. For numerical values, you can set an additional tolerance percentage.
SQLIntervalCheckOperator
Verify that metrics defined as SQL expressions remain within tolerance compared to those from previous days (days_back). This utility helps track how values change over time and identify potential outliers.
Defaults
The default for days_back is -7, and ds for the date_filter_column. Always set date_filter_column explicitly to your table’s actual date column.
SQLThresholdCheckOperator
Performs a value check against a minimum and maximum threshold.
SQL expression thresholds
Thresholds can also be SQL expressions, not just numeric values. For example: min_threshold="SELECT MIN(target_avg) FROM benchmarks".
Notifications
Detecting data quality issues is only part of the story. The other part is raising awareness. To be notified when a data quality check fails, combine the on_failure_callback task parameter with Airflow notifiers.
Slack example:
To use the SlackNotifier, install the following package:
In the templated text field, you can access the table via task.table and the actual quality issue via exception.
SlackNotifier
The SlackNotifier requires a properly configured Slack connection. In this case, the connection ID is slack_default.
AppriseNotifier
The AppriseNotifier supports 100+ notification services (Slack, Email, PagerDuty, Teams, etc.) through a unified interface. Install it via apache-airflow-providers-apprise.
Check patterns
Astronomer recommends running column checks first (field-level validation), followed by table checks (business logic), and then proceed with downstream processing.
Additionally, use task groups to organize your data quality checks and leverage the default_args parameter to configure notifications for all checks at once.
Platform-level checks with Astro Observe
Astro Observe delivers pipeline-aware data observability purpose-built for Airflow, giving your team visibility into the health, quality, and performance of your business-critical data products across the modern data stack.
Astro Observe data quality helps you monitor tables to ensure data accuracy, completeness, and integrity across your pipelines. It allows you to track key metrics such as column null percentages, schema changes, and table row counts to detect anomalies or unexpected shifts in your data.
Astro Observe is only available to Astro customers.
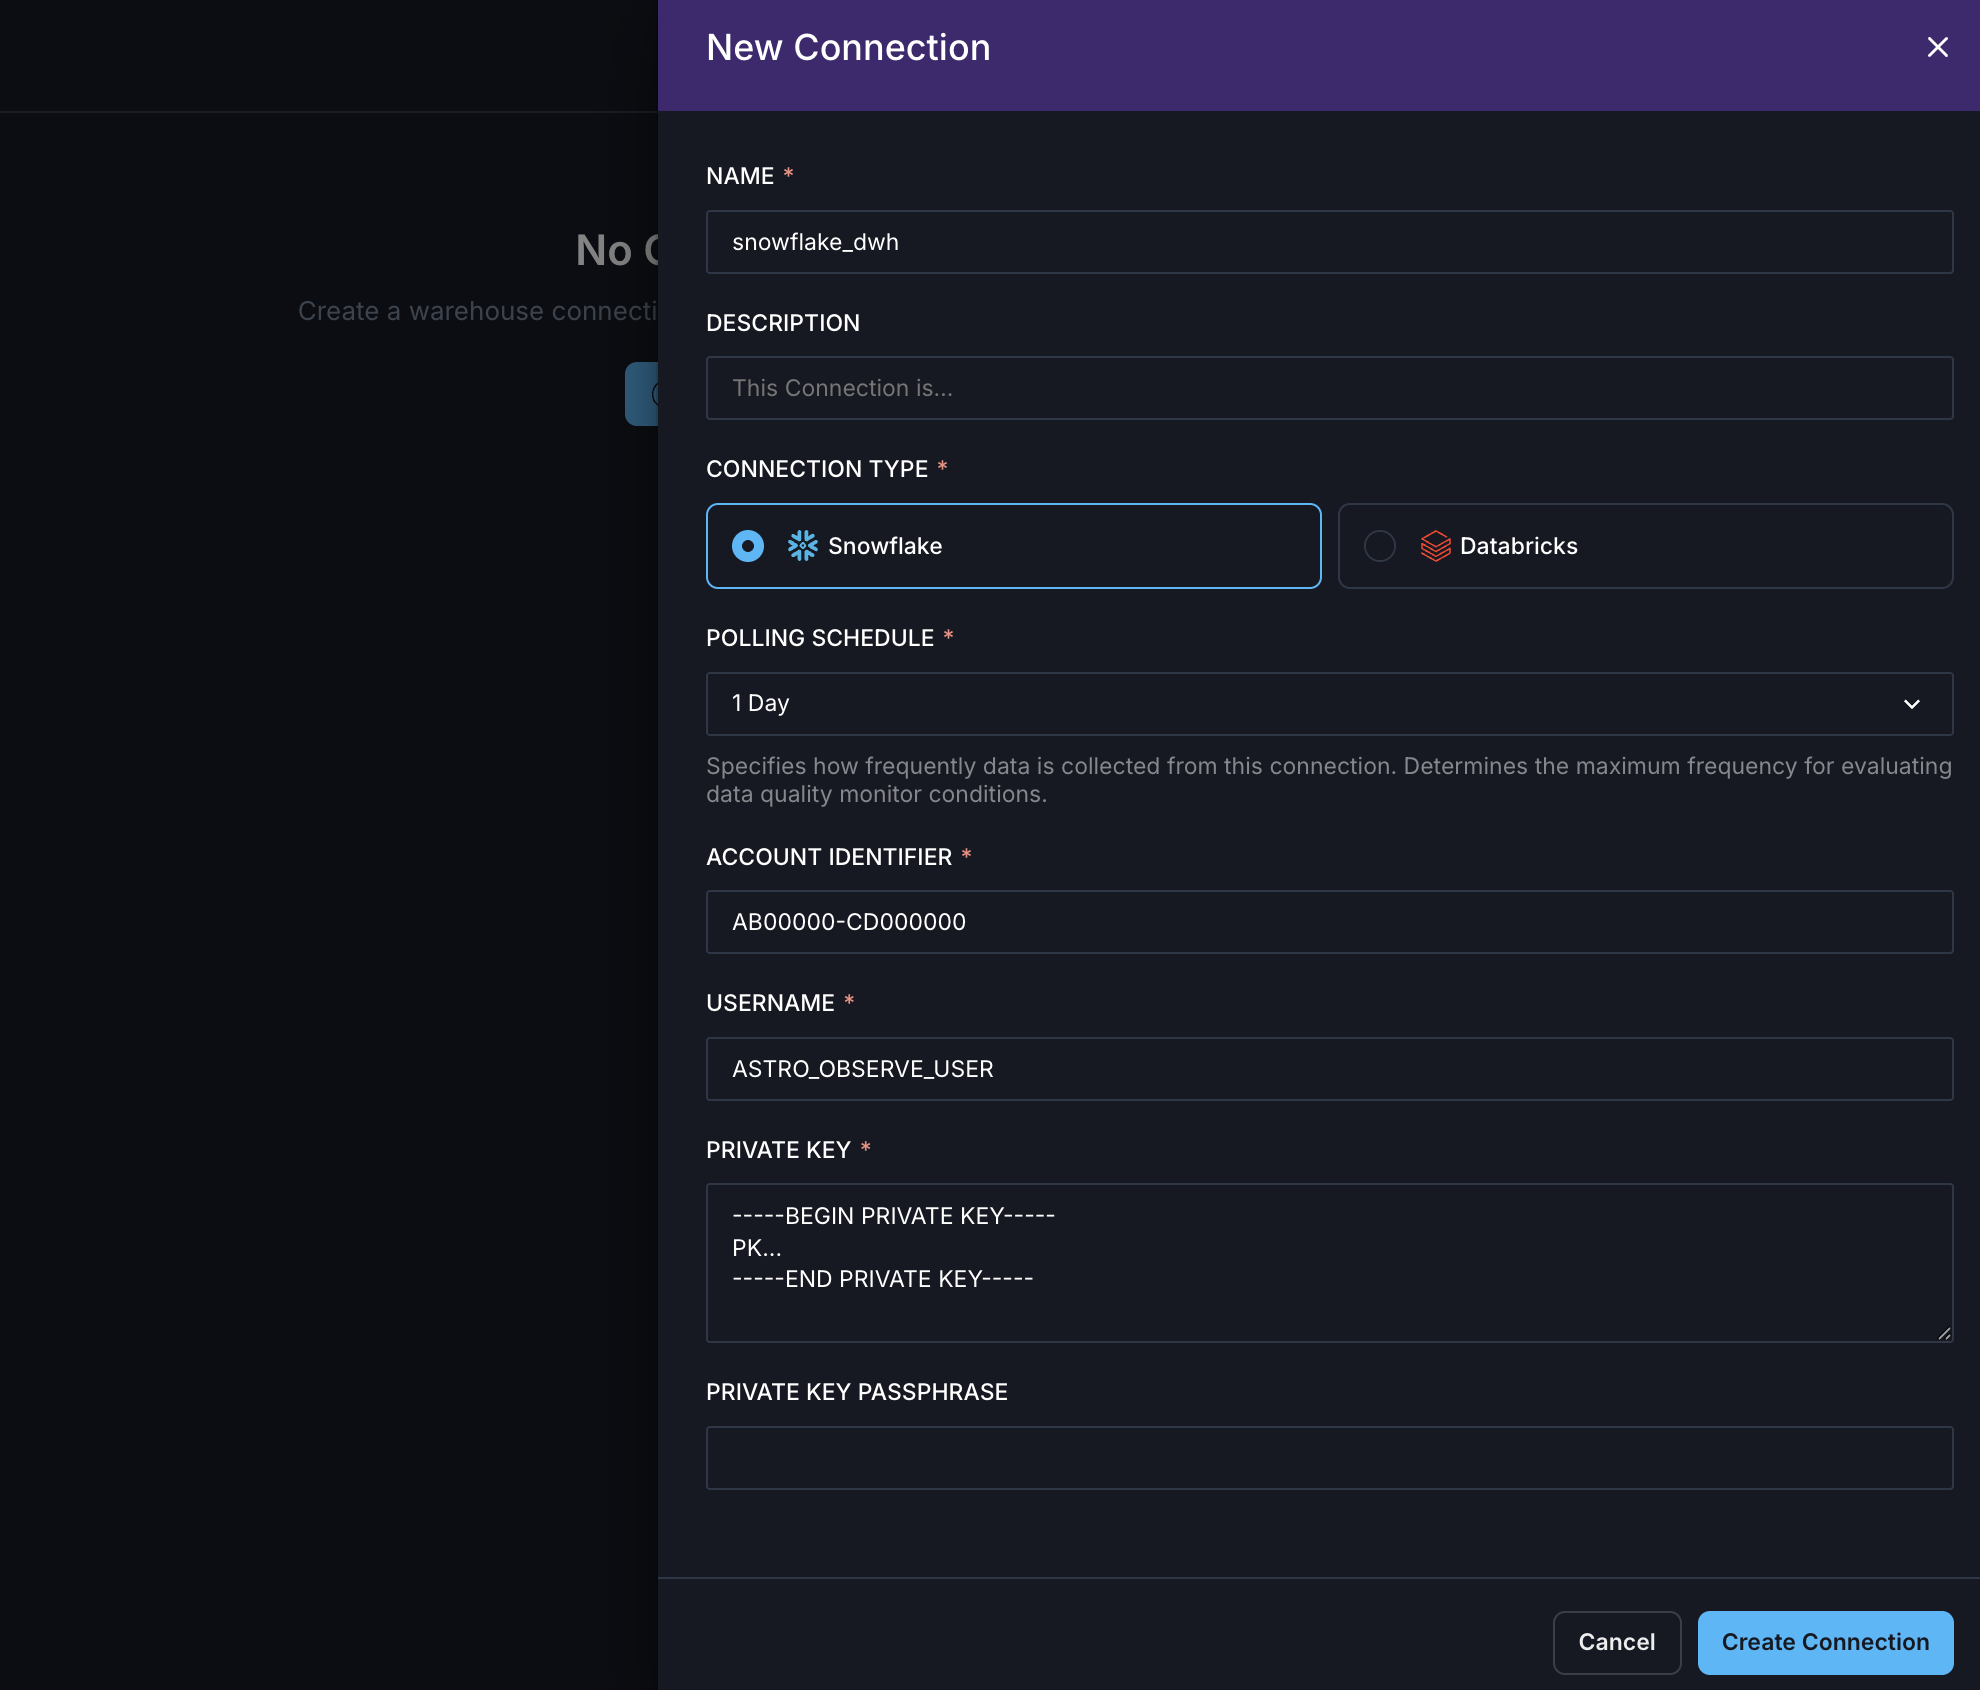
Create a connection
Before connecting to Astro Observe, configure the necessary permissions for your data platform. Navigate to Observe → Connections to create a new connection.
Asset catalog
Once connected, warehouse tables appear in the Asset Catalog alongside Airflow Dags, tasks, and datasets. Each table shows:
- Table popularity score: Helping you prioritize monitoring on frequently accessed tables.
- Schema details: Column names and types.
- Lineage: Upstream assets and downstream dependencies.
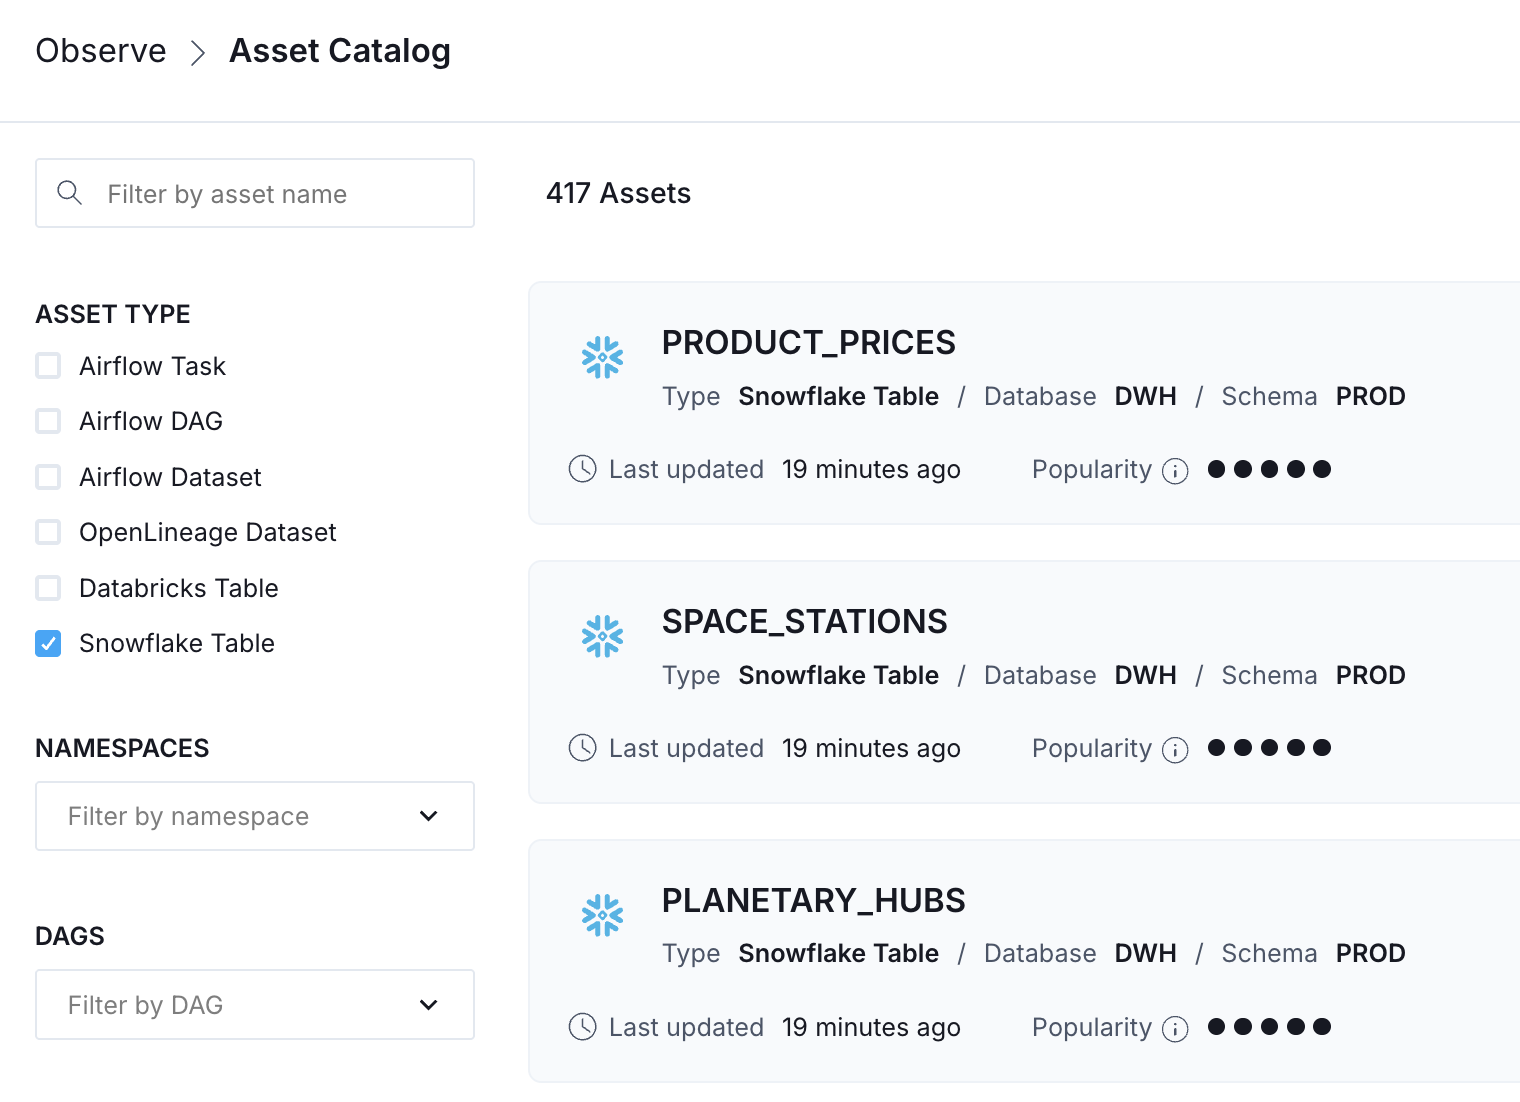
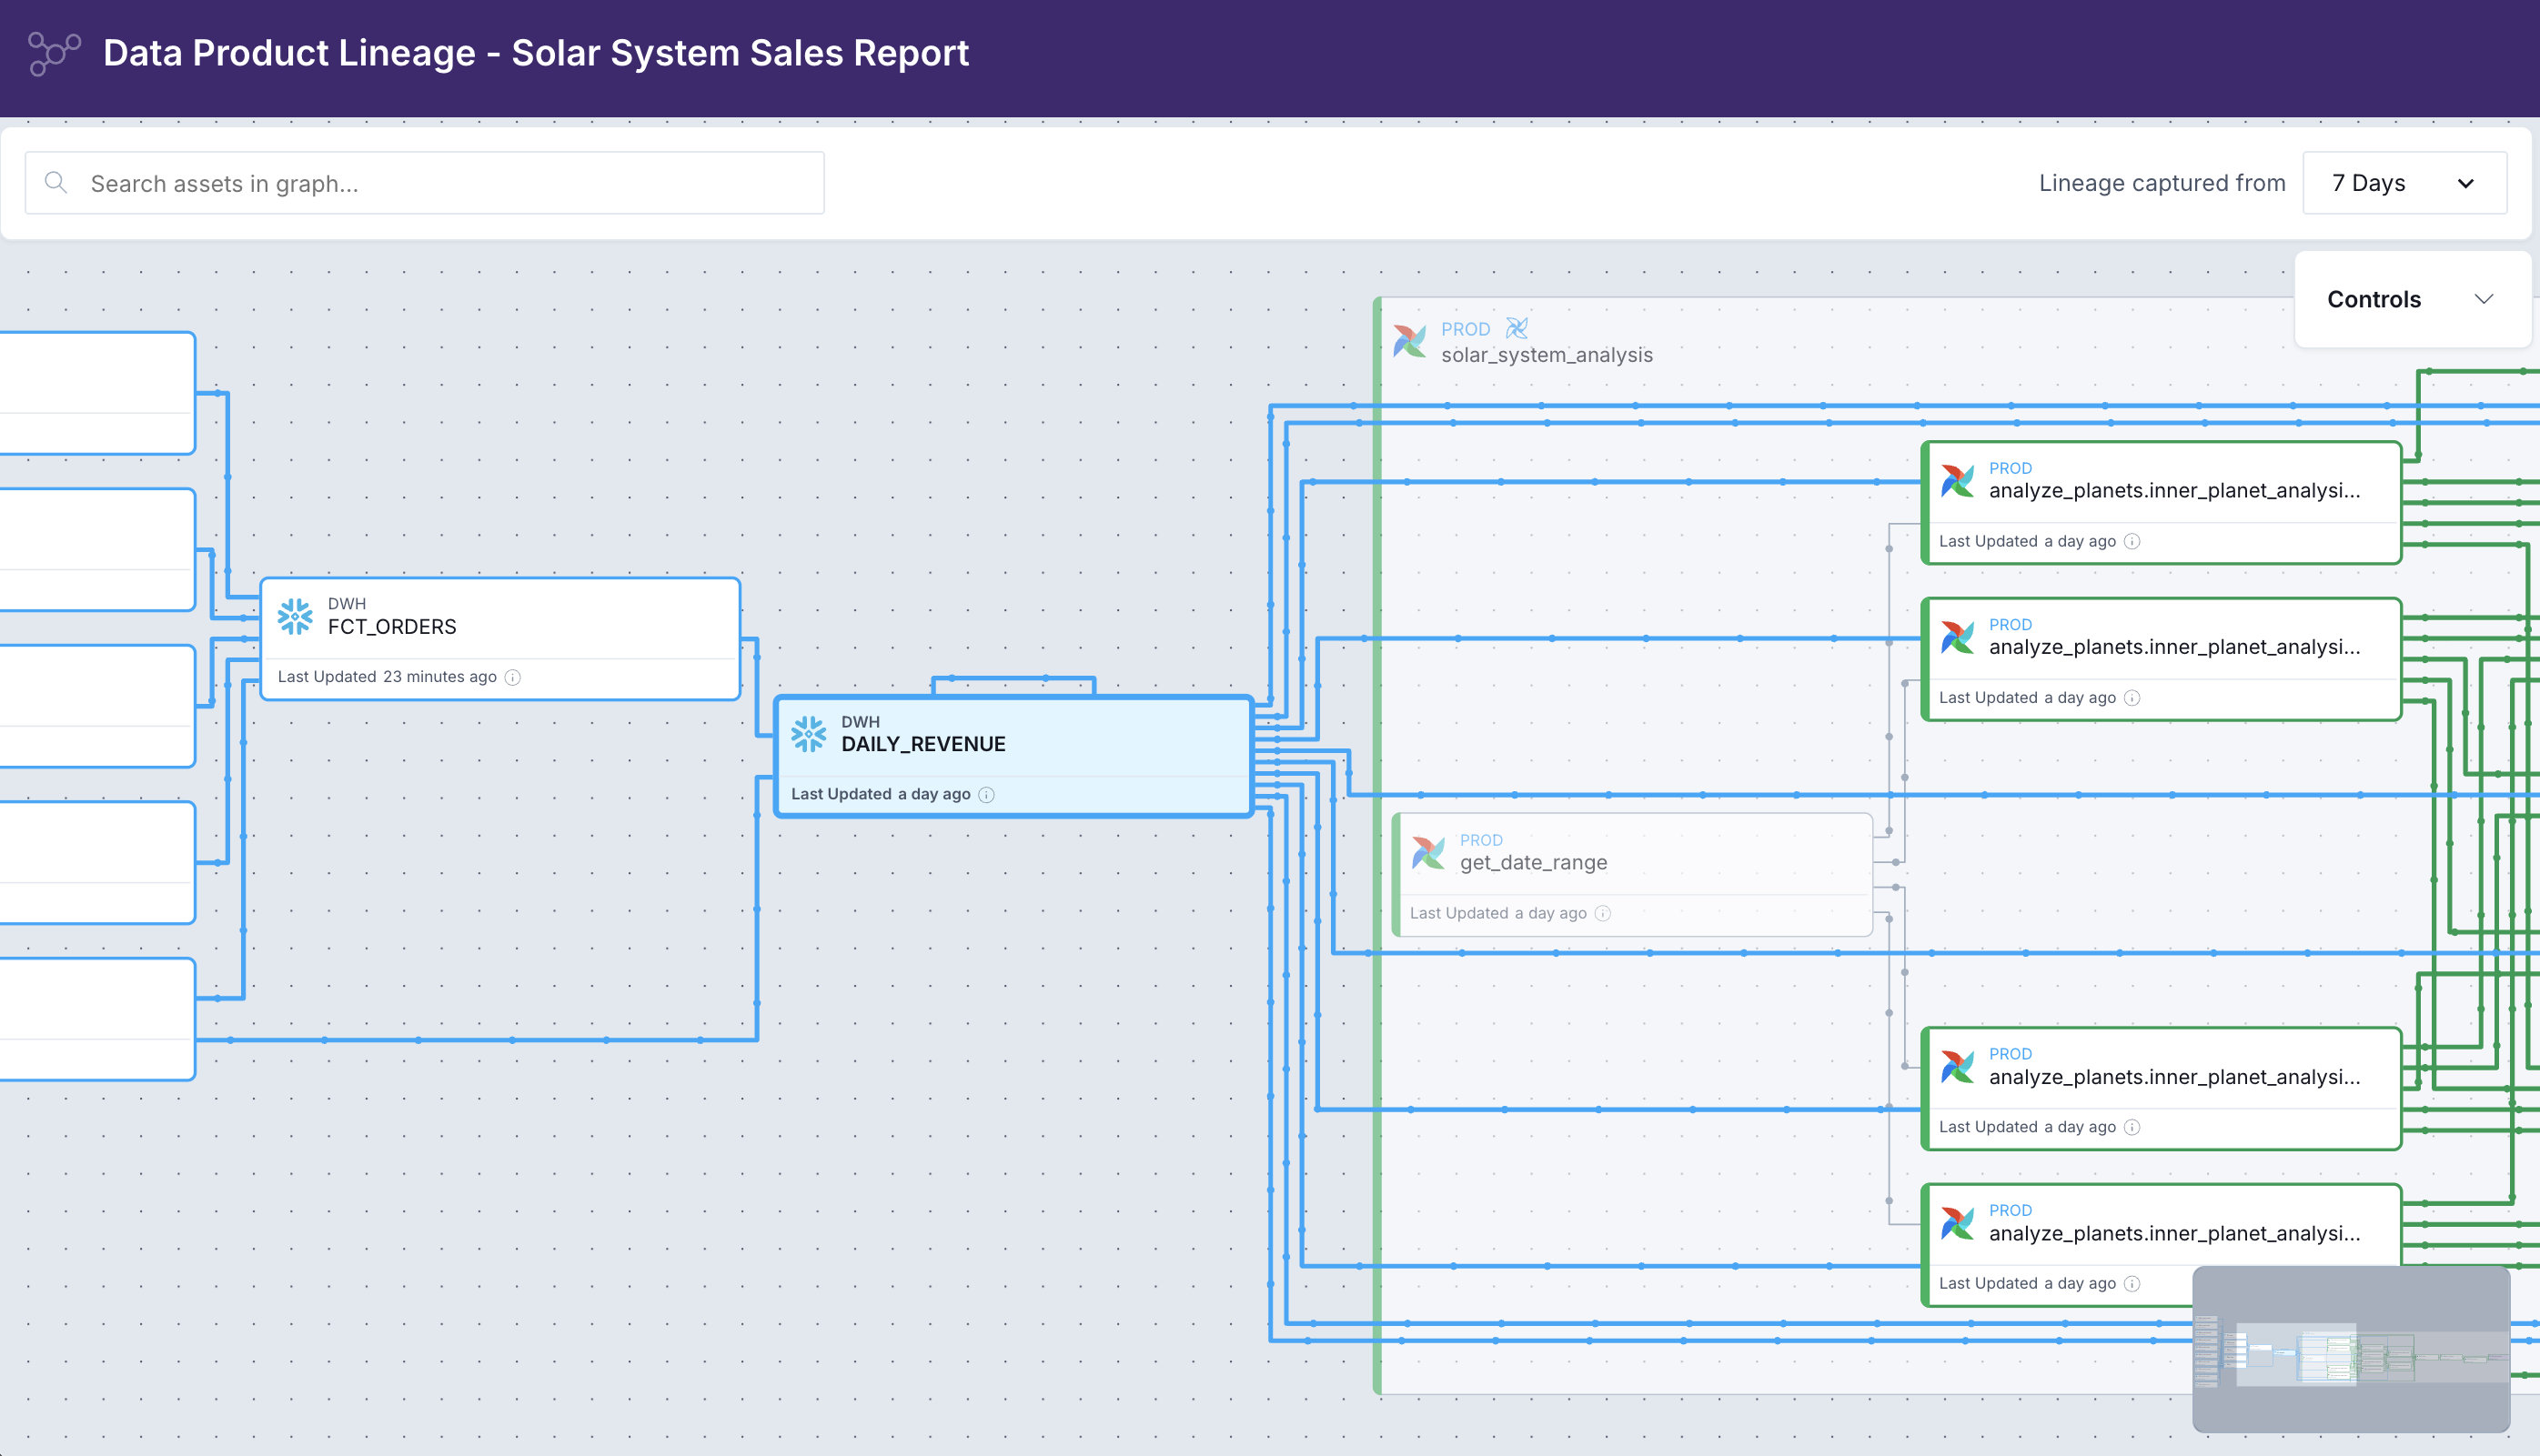
Table-level lineage
Data quality is also about context and understanding dependencies across Dag borders. Astro Observe’s table-level lineage starts where Airflow stops. It spans across Dags and shows upstream and downstream assets, including other Dags, tags, and tables from your warehouse.
With impact analysis for upstream and downstream assets, you gain platform-level data quality insights.
When a data quality alert fires, Astro Observe shows you which Airflow Dag and task wrote the failing table, what upstream dependencies fed into it, and which data products downstream are now at risk.
Monitors
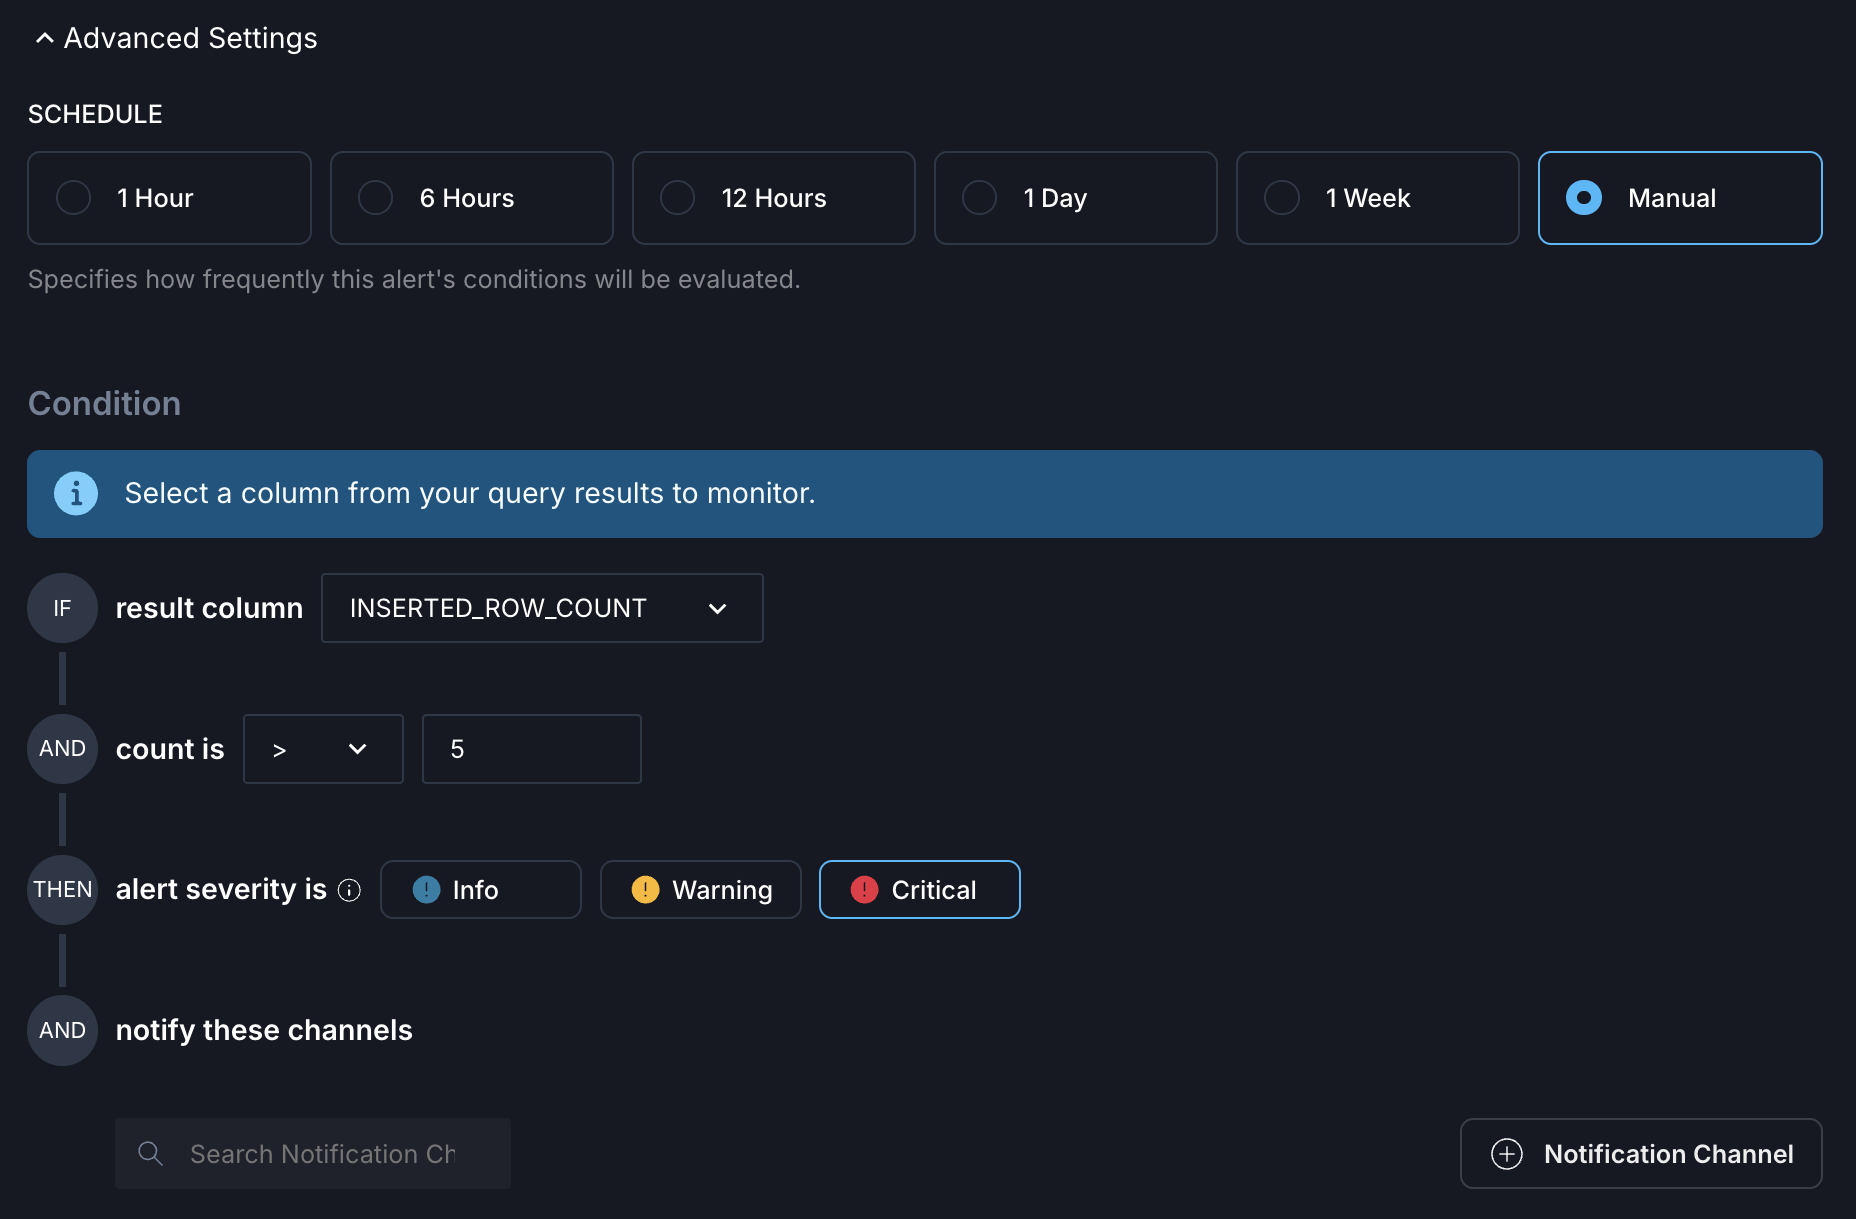
Navigate to Observe → Data Quality → Monitors to see an overview of existing monitors, and to create new ones via + Monitor.
Monitors are configurable data quality checks that run against your warehouse tables. Each monitor defines what to check, when to run, and how to alert. Astro Observe supports three scopes of monitors:
- Table monitors: Monitor data quality metrics for database tables.
- Data product monitors: Monitor data product health and pipeline failures.
- Custom SQL: Monitor custom data quality or business logic using SQL queries.
When a monitor’s condition is breached, it creates an alert with a severity level and notifies you through your configured channels.
Table monitors
Table monitors check data quality for one specific table and support the following types:
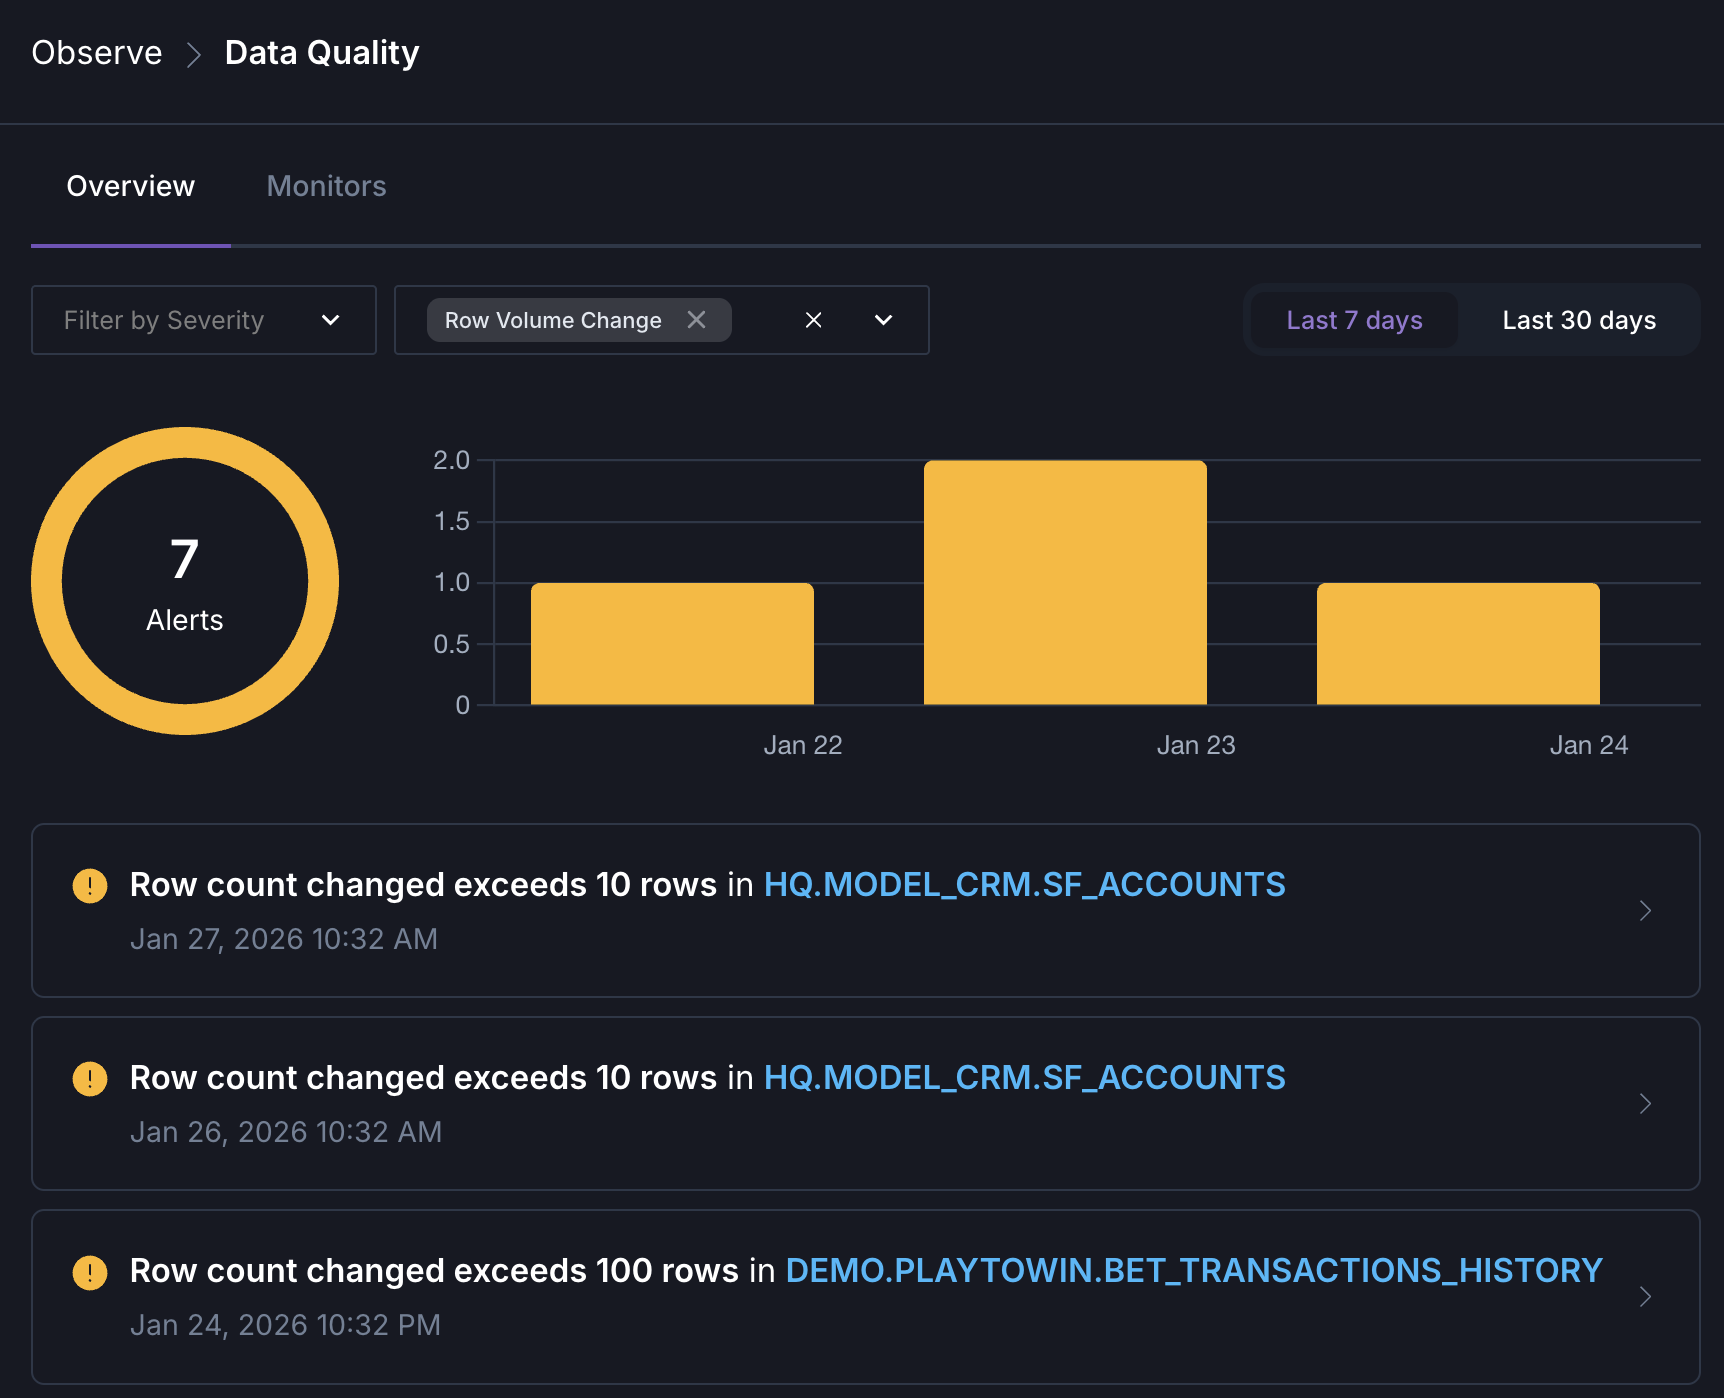
- Row volume change: Send an alert when any query causes a change in number of rows above the specified range.
- Column null percentage: Monitor the percentage of null values in specific columns.
- Table schema change: Track schema changes and detect modifications in column types or structures.
For each type, you can configure conditions, such as how large the difference in row count must be before triggering an alert or which columns to check for null values. In addition, you can select a schedule to define how frequently the conditions should be evaluated. You can also select notification channels. Observe supports Email, Slack, PagerDuty, Dag triggers, and Opsgenie out of the box.
Data product monitors
A data product is a composition of assets that, taken together, deliver a result with business relevance. It captures the end-to-end data lifecycle, and all elements that are involved in creating the product. Dags, tasks, and tables can all be assets of data products.
Data product monitors check data product health and pipeline failures. They send alerts when any upstream or final Dag in the data product fails.
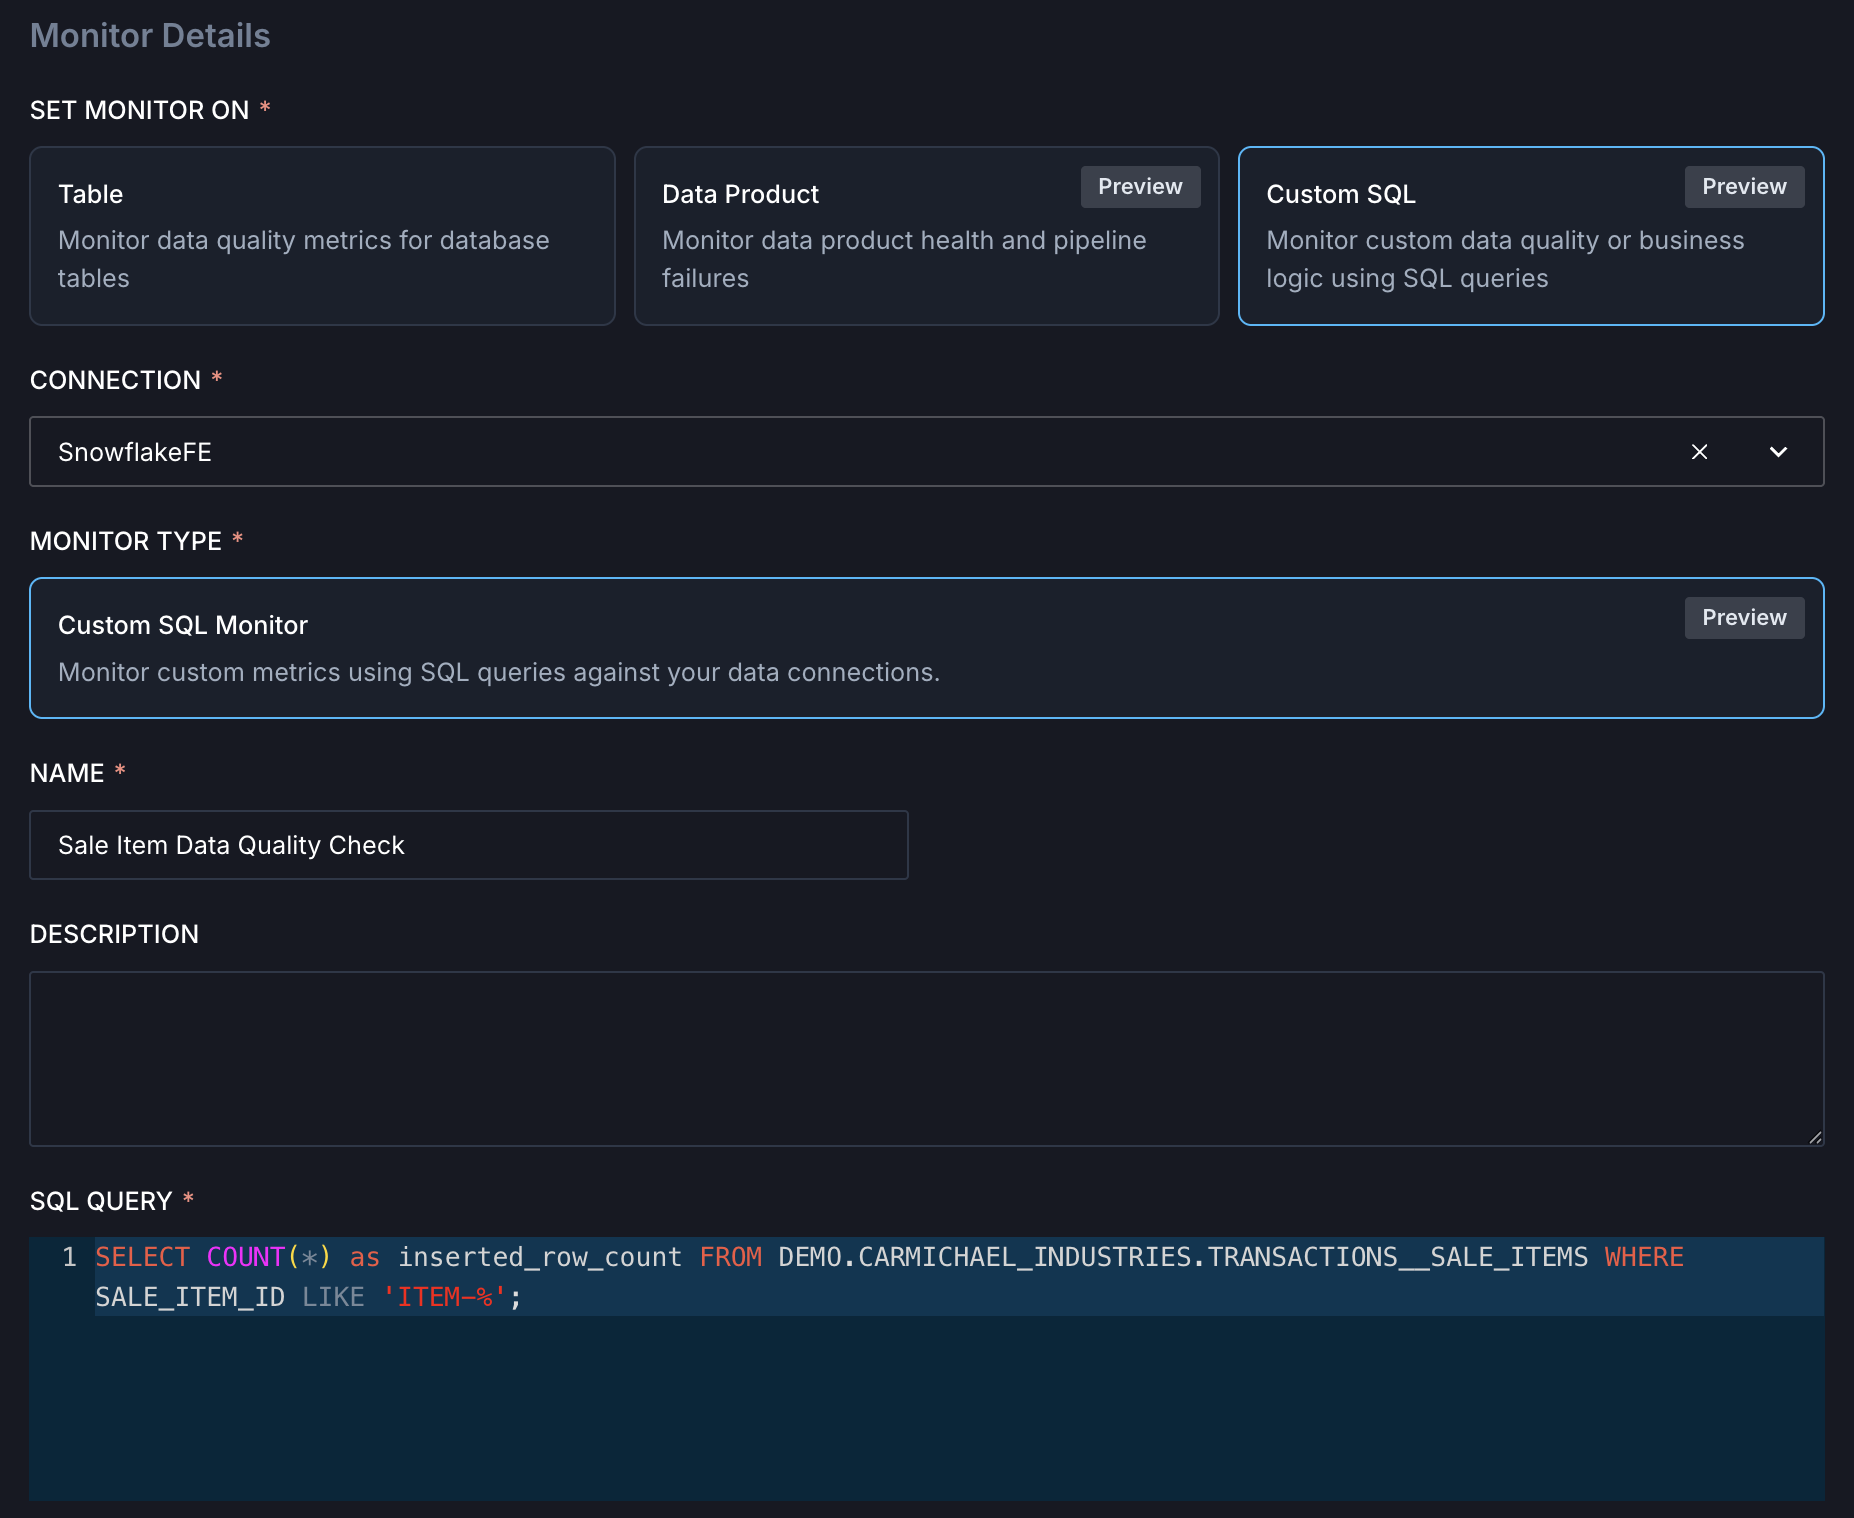
Custom SQL monitors
Custom SQL monitors are currently available for Snowflake only.
Custom SQL monitors check data quality or business logic using SQL queries against your data connections. Write a SQL query that returns a numerical value you want to monitor. The query results are then used to configure conditions.
Custom SQL monitors can also run when data lands in a table, allowing downstream consumers to be notified of data quality issues immediately.
Alerts overview
In addition to proactive alerting, you can get an overview of alerts triggered by your monitors by navigating to Observe → Data Quality.
Third-party frameworks
Great Expectations
The airflow-provider-great-expectations package provides operators for running Great Expectations validations directly in your Dags.
When deciding which operator fits your use case, consider:
- Where is your data? In memory as a DataFrame, or in an external data source?
- Do you need to trigger actions? Such as sending notifications or updating external systems based on validation results.
- What Data Context do you need? Ephemeral for stateless validations, or persistent to track results over time.
See Orchestrate Great Expectations with Airflow to learn how to use these operators in your Dag.
dbt tests
If you use dbt with Airflow via Cosmos, leverage dbt’s built-in testing framework:
- Schema tests:
unique,not_null,accepted_values,relationships. - Custom tests: SQL-based assertions for business-specific validation.
See Orchestrate dbt Core with Airflow for integration patterns.
Soda Core
Run Soda checks via @task.bash:
Quick reference
Conclusion
Data quality is a continuous practice that evolves with your data ecosystem. Dag-level checks give you precise control within your pipelines, catching issues before bad data propagates downstream.
Platform-level checks with Astro Observe extend that coverage beyond your Dags, monitoring data the moment it lands, tracing issues through table-level lineage, and providing the full context needed to assess impact and resolve problems fast.
The most resilient data teams use both. Dag-level SQL check operators for your critical validations, then layer on platform-level monitors in Astro Observe for broader coverage, event-driven checks, and the observability context that connects data quality to your entire DataOps ecosystem.