> ## Documentation Index
> Fetch the complete documentation index at: https://astronomer.io/docs/llms.txt
> Use this file to discover all available pages before exploring further.
# Airflow logging
Airflow provides an extensive logging system for monitoring and debugging your data pipelines. Your webserver, scheduler, metadata database, and individual tasks all generate logs. You can export these logs to a local file, your console, or to a specific remote storage solution.
In this guide, you'll learn the basics of Airflow logging, including:
* Where to find logs for different Airflow components.
* How to add custom task logs from within a DAG.
* When and how to configure logging settings.
* How to set up remote logging in OSS Airflow.
In addition to standard logging, Airflow provides observability features that you can use to collect metrics, trigger callback functions with task events, monitor Airflow health status, and track errors and user activity. For more information, see:
* [Deployment metrics](/docs/astro/deployment-metrics) for Astro customers to use built-in features providing you with detailed metrics about how your tasks run and use resources in your cloud.
* [Metrics Configuration](https://airflow.apache.org/docs/apache-airflow/stable/administration-and-deployment/logging-monitoring/metrics.html) for monitoring options for self-hosted Airflow including StatsD and OpenTelemetry.
## Assumed knowledge
To get the most out of this guide, you should have an understanding of:
* Basic Airflow concepts. See [Introduction to Apache Airflow](/docs/learn/2.x/intro-to-airflow).
* Airflow core components. See [Airflow's components](/docs/learn/2.x/airflow-components).
## Airflow logging
Logging in Airflow leverages the [Python stdlib `logging` module](https://docs.python.org/3/library/logging.html). The `logging` module includes the following classes:
* Loggers (`logging.Logger`): The interface that the application code directly interacts with. Airflow defines 4 loggers by default: `root`, `flask_appbuilder`, `airflow.processor` and `airflow.task`.
* Handlers (`logging.Handler`): Send log records to their destination. By default, Airflow uses `RedirectStdHandler`, `FileProcessorHandler` and `FileTaskHandler`.
* Filters (`logging.Filter`): Determine which log records are emitted. Airflow uses `SecretsMasker` as a filter to prevent sensitive information from being printed into logs.
* Formatters (`logging.Formatter`): Determine the layout of log records. Two formatters are predefined in Airflow:
* `airflow_colored`: `"[%(blue)s%(asctime)s%(reset)s] {%(blue)s%(filename)s:%(reset)s%(lineno)d} %(log_color)s%(levelname)s%(reset)s - %(log_color)s%(message)s%(reset)s"` (this formatting relates to [colored logs in a TTY terminal](https://airflow.apache.org/docs/apache-airflow/stable/configurations-ref.html#colored-log-format))
* `airflow`: `"[%(asctime)s] {%(filename)s:%(lineno)d} %(levelname)s - %(message)s"` (this format is used to display logs in the Airflow UI)
See [Logging facility for Python](https://docs.python.org/3/library/logging.html) for more information on the methods available for these classes, including the attributes of a LogRecord object and the 6 available levels of logging severity (`CRITICAL`, `ERROR`, `WARNING`, `INFO`, `DEBUG`, and `NOTSET`).
The four default loggers in Airflow each have a handler with a predefined log destination and formatter:
* `root` (level: `INFO`): Uses `RedirectStdHandler` and `airflow_colored`. It outputs to `sys.stderr/stout` and acts as a catch-all for processes that have no specific logger defined.
* `flask_appbuilder` (level: `WARNING`): Uses `RedirectStdHandler` and `airflow_colored`. It outputs to `sys.stderr/stout`. It handles logs from the webserver.
* `airflow.processor` (level: `INFO`): Uses `FileProcessorHandler` and `airflow`. It writes logs from the scheduler to the local file system.
* `airflow.task` (level: `INFO`): Uses `FileTaskHandlers` and `airflow`. It writes task logs to the local file system.
By default, log file names have the following format:
* For standard tasks: `dag_id={dag_id}/run_id={run_id}/task_id={task_id}/attempt={try_number}.log`
* For [dynamically mapped tasks](/docs/learn/2.x/dynamic-tasks): `dag_id={dag_id}/run_id={run_id}/task_id={task_id}/map_index={map_index}/attempt={try_number}.log`
These filename formats can be reconfigured using `log_filename_template` in `airflow.cfg`.
You can view the full default logging configuration under `DEFAULT_LOGGING_CONFIG` in the [Airflow source code](https://github.com/apache/airflow/blob/main/airflow/config_templates/airflow_local_settings.py).
The Airflow UI shows logs using a `read()` method on task handlers that isn't part of stdlib. `read()` checks for available logs and displays them in a predefined order:
* Remote logs (if remote logging is enabled)
* Logs on the local filesystem
* Logs from [worker specific webserver subprocesses](https://airflow.apache.org/docs/apache-airflow/stable/configurations-ref.html#worker-log-server-port)
When using the Kubernetes Executor and a worker pod still exists, `read()` shows the first 100 lines from the Kubernetes pod logs. If a worker pod spins down, the logs are no longer available. For more information, see [Logging Architecture](https://kubernetes.io/docs/concepts/cluster-administration/logging/).
## Log locations
By default, Airflow outputs logs to the `base_log_folder` configured in `airflow.cfg`, which is located in your `$AIRFLOW_HOME` directory.
Airflow also makes event logs/audit logs available. For example, listing which user triggered a DAG run.
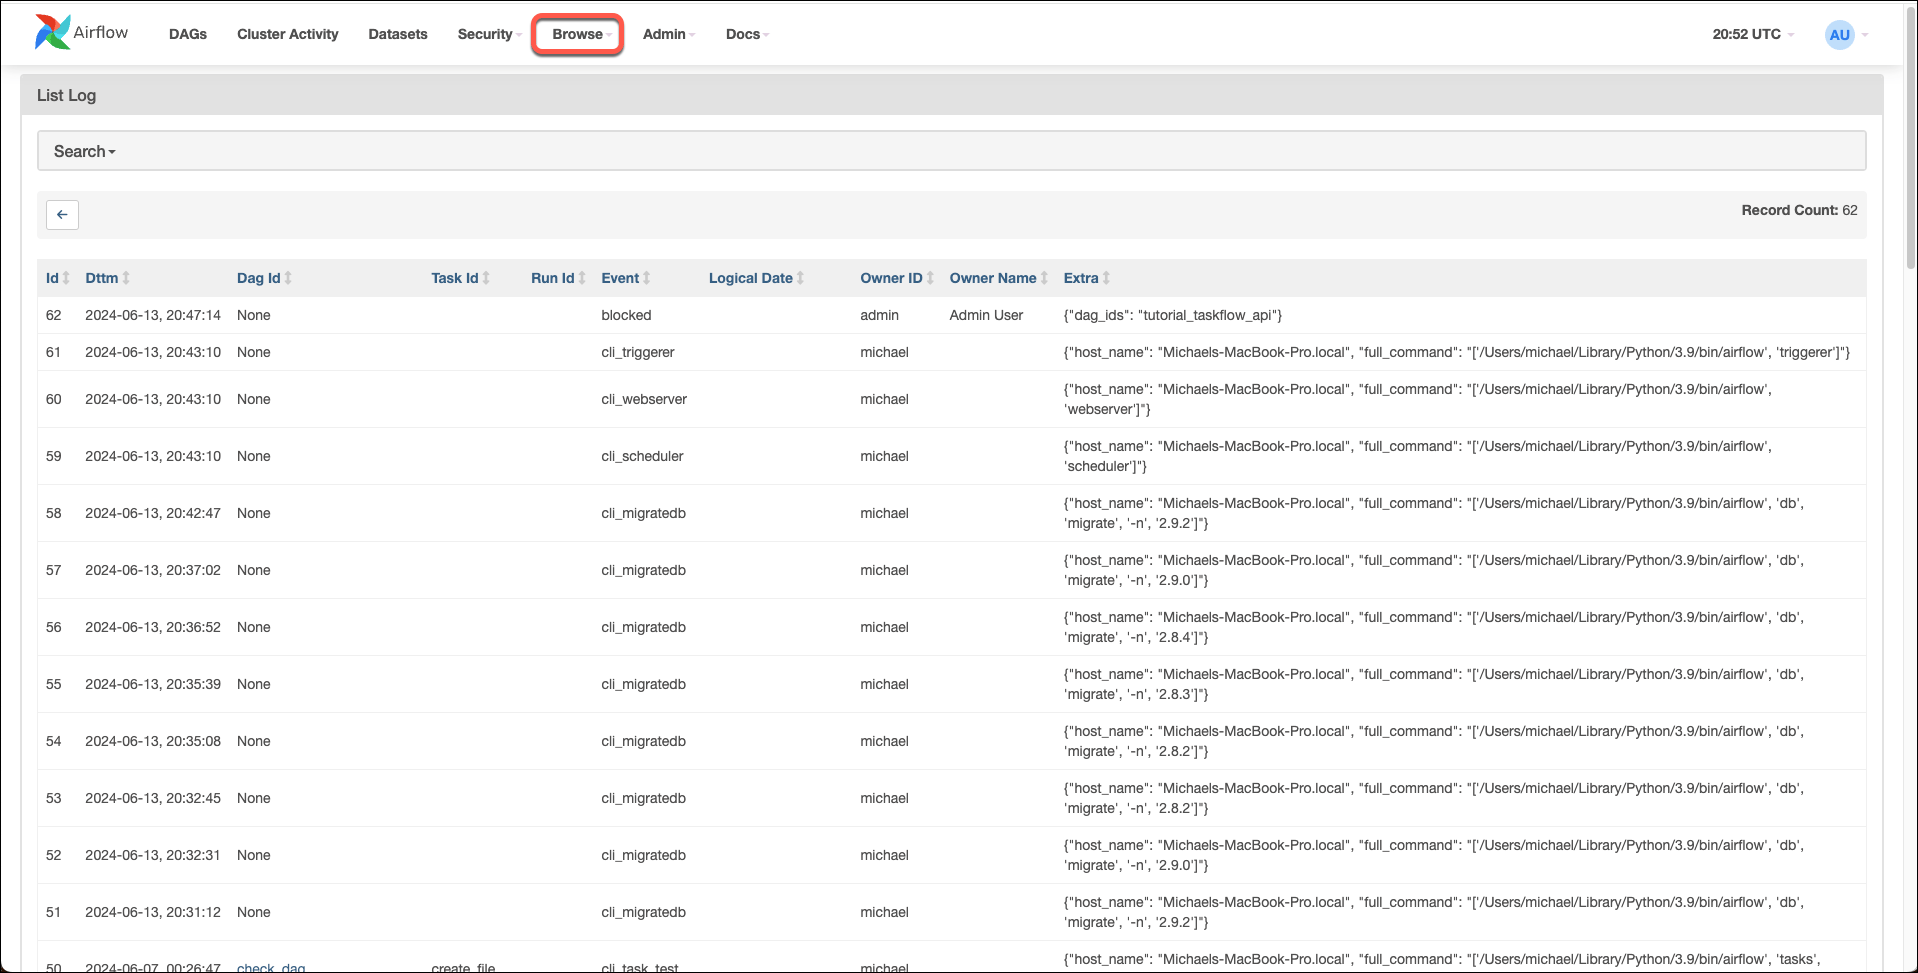
You can view the full cluster Audit log containing all audit logs for your Airflow instance under the "Browse" tab.
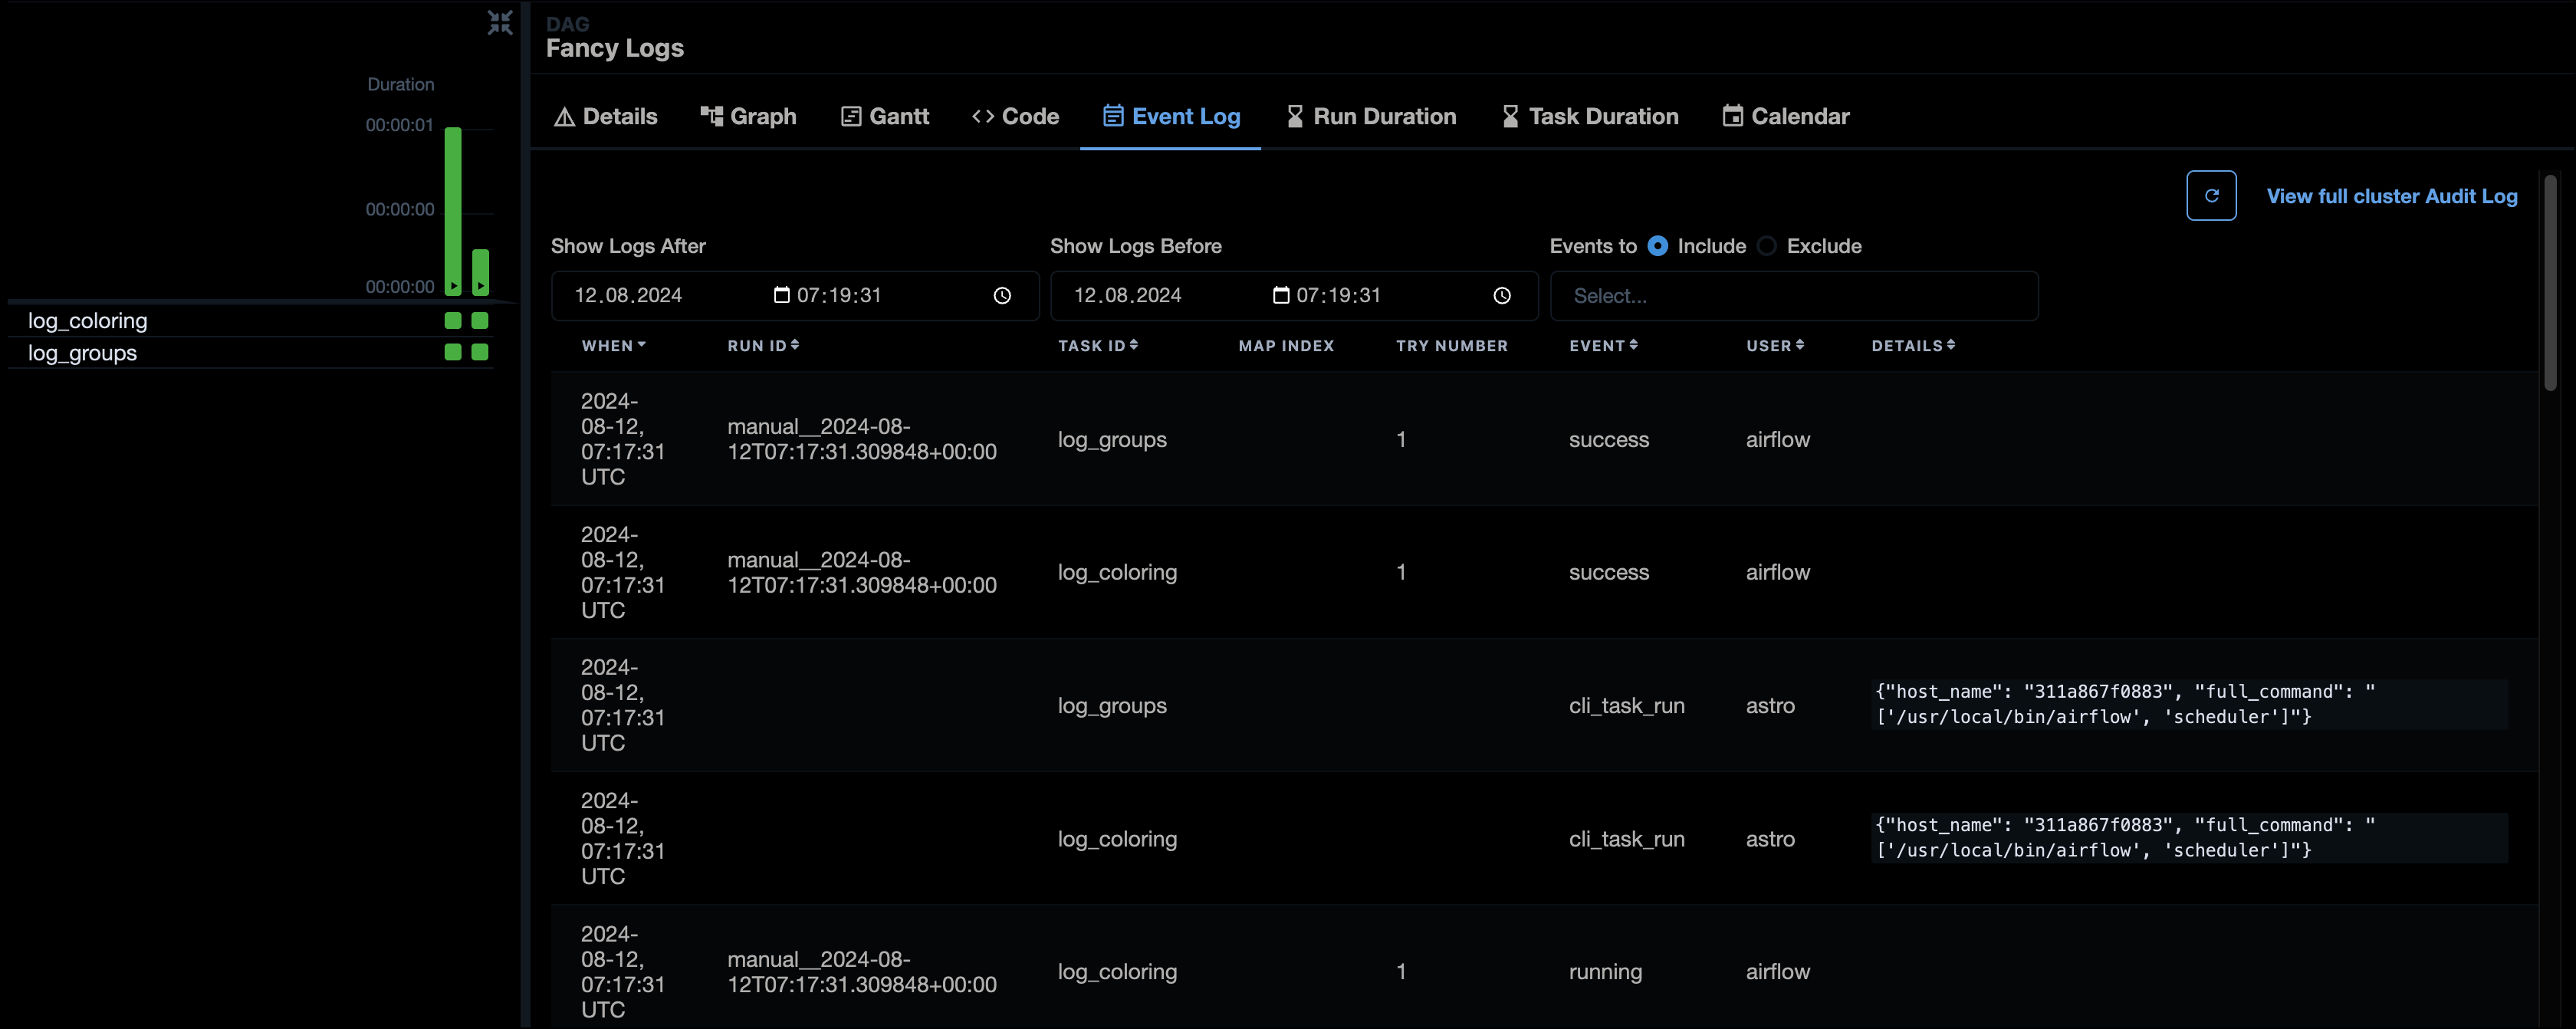
 Audit logs for individual DAGs, DAG runs and tasks can be found in the `Event Log` tab after selecting the DAG, DAG run or task. This view offers advanced filtering options such as filtering for time periods or including/excluding types of events.
 For details about the log levels and events tracked, see [Audit logs in Airflow](https://airflow.apache.org/docs/apache-airflow/stable/security/audit_logs.html).
### Local Airflow environment
If you run Airflow locally, logging information is accessible in the following locations:
* Scheduler: Logs are printed to the console and accessible in `$AIRFLOW_HOME/logs/scheduler`.
* Webserver and Triggerer: Logs are printed to the console. Individual triggers' log messages can be found in the logs of tasks that use deferrable operators.
* Task: Logs can be viewed in the Airflow UI or at `$AIRFLOW_HOME/logs/`. To view task logs directly in your terminal, run `astro dev run tasks test ` with the [Astro CLI](/docs/cli/v1.43/overview) or `airflow tasks test ` if you are running Airflow with other tools. Note that as of Airflow 2.9, `Pre task execution logs` and `Post task execution logs` are grouped in the Airflow UI and need to be expanded to view the full logs, see [Airflow task log customization](#airflow-task-log-customization).
* Metadata database: Logs are handled differently depending on which database you use.
### Containerized Airflow environment
If you run Airflow in containers using the [Astro CLI](/docs/cli/v1.43/install-cli), you can find the logs for each Airflow component in the following locations:
* Scheduler: Logs are in `/usr/local/airflow/logs/scheduler` within the scheduler container by default. To enter a container in a bash session, run `podman exec -it /bin/bash` (or `docker exec -it /bin/bash` if you are using Docker).
* Webserver: Logs appear in the console by default. You can access the logs by running `podman logs `.
* Metadata database: Logs appear in the console by default. You can access the logs by running `podman logs `.
* Triggerer: Logs appear in the console by default. You can access the logs by running `podman logs `. Individual triggers' log messages can be found in the logs of tasks that use deferrable operators.
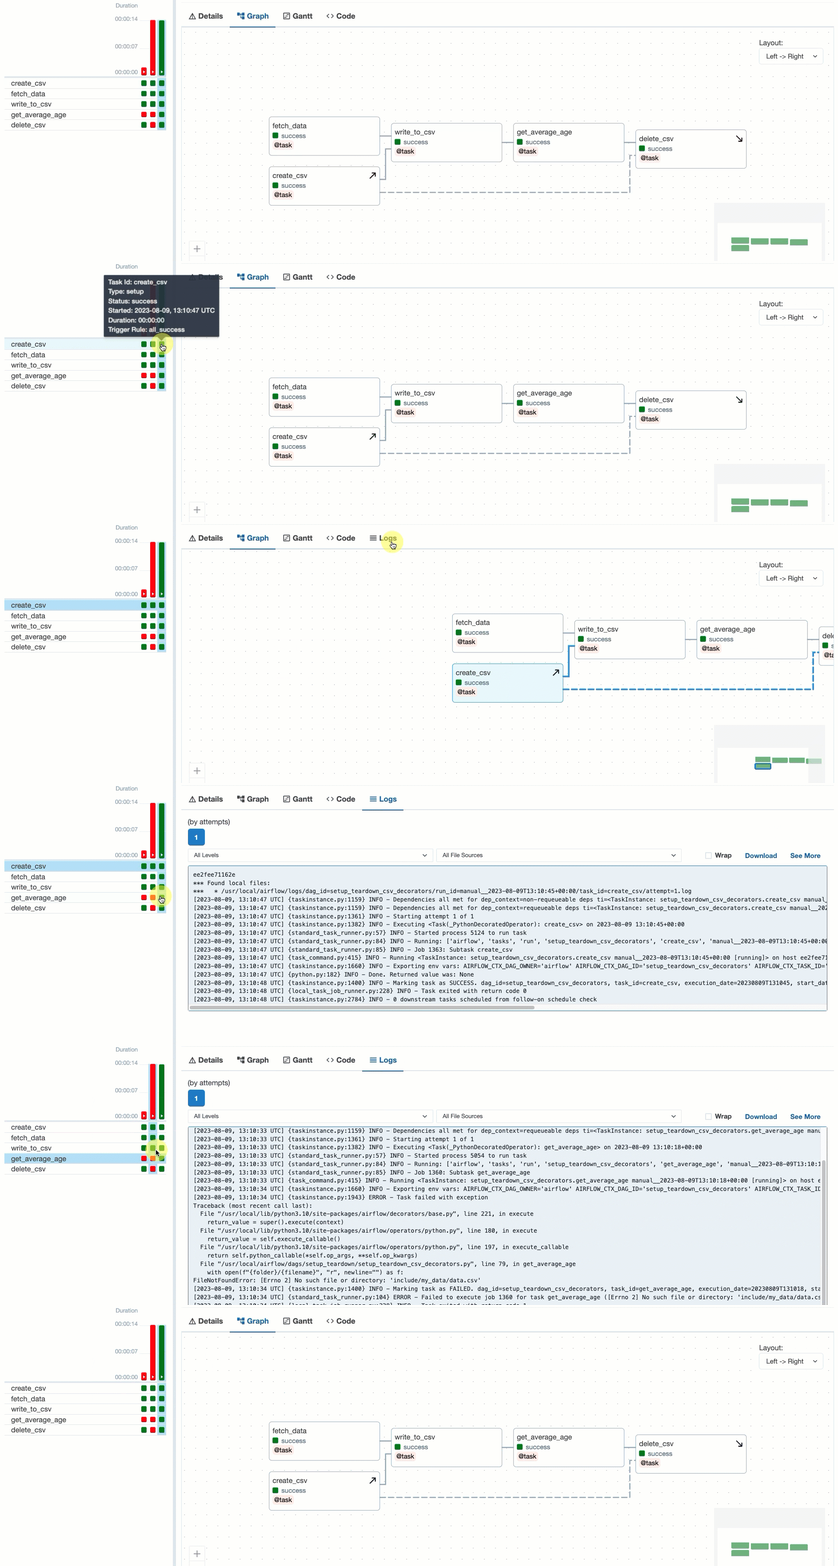
* Task: Logs appear in `/usr/local/airflow/logs/` within the scheduler container. To access task logs in the Airflow UI, click the square of a task instance in the **Grid** view and then select the **Logs** tab.
For details about the log levels and events tracked, see [Audit logs in Airflow](https://airflow.apache.org/docs/apache-airflow/stable/security/audit_logs.html).
### Local Airflow environment
If you run Airflow locally, logging information is accessible in the following locations:
* Scheduler: Logs are printed to the console and accessible in `$AIRFLOW_HOME/logs/scheduler`.
* Webserver and Triggerer: Logs are printed to the console. Individual triggers' log messages can be found in the logs of tasks that use deferrable operators.
* Task: Logs can be viewed in the Airflow UI or at `$AIRFLOW_HOME/logs/`. To view task logs directly in your terminal, run `astro dev run tasks test ` with the [Astro CLI](/docs/cli/v1.43/overview) or `airflow tasks test ` if you are running Airflow with other tools. Note that as of Airflow 2.9, `Pre task execution logs` and `Post task execution logs` are grouped in the Airflow UI and need to be expanded to view the full logs, see [Airflow task log customization](#airflow-task-log-customization).
* Metadata database: Logs are handled differently depending on which database you use.
### Containerized Airflow environment
If you run Airflow in containers using the [Astro CLI](/docs/cli/v1.43/install-cli), you can find the logs for each Airflow component in the following locations:
* Scheduler: Logs are in `/usr/local/airflow/logs/scheduler` within the scheduler container by default. To enter a container in a bash session, run `podman exec -it /bin/bash` (or `docker exec -it /bin/bash` if you are using Docker).
* Webserver: Logs appear in the console by default. You can access the logs by running `podman logs `.
* Metadata database: Logs appear in the console by default. You can access the logs by running `podman logs `.
* Triggerer: Logs appear in the console by default. You can access the logs by running `podman logs `. Individual triggers' log messages can be found in the logs of tasks that use deferrable operators.
* Task: Logs appear in `/usr/local/airflow/logs/` within the scheduler container. To access task logs in the Airflow UI, click the square of a task instance in the **Grid** view and then select the **Logs** tab.
 The Astro CLI includes a command to show webserver, scheduler, triggerer and Celery worker logs from the local Airflow environment. For more information, see [astro dev logs](/docs/cli/v1.43/astro-dev-logs).
In newer Airflow versions, logs from other Airflow components, such as the scheduler (2.8+) or executor (2.10+), will be forwarded to the task logs if an error in the component causes the task to fail. For example, if a task runs out of memory, causing a [zombie process](https://airflow.apache.org/docs/apache-airflow/stable/core-concepts/tasks.html#zombie-undead-tasks), information about the zombie is printed to the task logs. You can disable this behavior by setting [`AIRFLOW__LOGGING__ENABLE_TASK_CONTEXT_LOGGER=False`](https://airflow.apache.org/docs/apache-airflow/stable/configurations-ref.html#enable-task-context-logger).
## Add custom task logs from a DAG
All hooks and operators in Airflow generate logs when a task is run. You can't modify logs from within other operators or in the top-level code, but you can add custom logging statements from within your Python functions by accessing the `airflow.task` logger.
The advantage of using a logger over print statements is that you can log at different levels and control which logs are emitted to a specific location. For example, by default the `airflow.task` logger is set at the level of `INFO`, which means that logs at the level of `DEBUG` aren't logged. To see `DEBUG` logs when debugging your Python tasks, you need to set `AIRFLOW__LOGGING__LOGGING_LEVEL=DEBUG` or change the value of `logging_level` in `airflow.cfg`. After debugging, you can change the `logging_level` back to `INFO` without modifying your DAG code.
The following example DAG shows how to instantiate an object using the existing `airflow.task` logger, how to add logging statements of different severity levels from within a Python function, and what the log output would be with default Airflow logging settings. There are many use cases for adding additional logging statements from within DAGs, ranging from logging warnings when a specific set of conditions appear over additional debugging messages to catching exceptions but still keeping a record of their having occurred.
```python expandable wrap theme={null}
from pendulum import datetime, duration
from airflow.decorators import dag, task
from airflow.operators.bash import BashOperator
# import the logging module
import logging
# get the airflow.task logger
task_logger = logging.getLogger("airflow.task")
@task
def extract():
# with default airflow logging settings, DEBUG logs are ignored
task_logger.debug("This log is at the level of DEBUG")
# each of these lines produces a log statement
print("This log is created with a print statement")
task_logger.info("This log is informational")
task_logger.warning("This log is a warning")
task_logger.error("This log shows an error!")
task_logger.critical("This log shows a critical error!")
data = {"a": 19, "b": 23, "c": 42}
# Using the Task flow API to push to XCom by returning a value
return data
# logs outside of tasks will not be processed
task_logger.warning("This log will not show up!")
# command to create a file and write the data from the extract task into it
# these commands use Jinja templating within {{}}
commands = """
touch /usr/local/airflow/{{ds}}.txt
echo {{ti.xcom_pull(task_ids='extract')}} > /usr/local/airflow/{{ds}}.txt
"""
@dag(
start_date=datetime(2022, 6, 5),
schedule="@daily",
dagrun_timeout=duration(minutes=10),
catchup=False,
)
def more_logs_dag():
write_to_file = BashOperator(task_id="write_to_file", bash_command=commands)
# logs outside of tasks will not be processed
task_logger.warning("This log will not show up!")
extract() >> write_to_file
more_logs_dag()
```
The Astro CLI includes a command to show webserver, scheduler, triggerer and Celery worker logs from the local Airflow environment. For more information, see [astro dev logs](/docs/cli/v1.43/astro-dev-logs).
In newer Airflow versions, logs from other Airflow components, such as the scheduler (2.8+) or executor (2.10+), will be forwarded to the task logs if an error in the component causes the task to fail. For example, if a task runs out of memory, causing a [zombie process](https://airflow.apache.org/docs/apache-airflow/stable/core-concepts/tasks.html#zombie-undead-tasks), information about the zombie is printed to the task logs. You can disable this behavior by setting [`AIRFLOW__LOGGING__ENABLE_TASK_CONTEXT_LOGGER=False`](https://airflow.apache.org/docs/apache-airflow/stable/configurations-ref.html#enable-task-context-logger).
## Add custom task logs from a DAG
All hooks and operators in Airflow generate logs when a task is run. You can't modify logs from within other operators or in the top-level code, but you can add custom logging statements from within your Python functions by accessing the `airflow.task` logger.
The advantage of using a logger over print statements is that you can log at different levels and control which logs are emitted to a specific location. For example, by default the `airflow.task` logger is set at the level of `INFO`, which means that logs at the level of `DEBUG` aren't logged. To see `DEBUG` logs when debugging your Python tasks, you need to set `AIRFLOW__LOGGING__LOGGING_LEVEL=DEBUG` or change the value of `logging_level` in `airflow.cfg`. After debugging, you can change the `logging_level` back to `INFO` without modifying your DAG code.
The following example DAG shows how to instantiate an object using the existing `airflow.task` logger, how to add logging statements of different severity levels from within a Python function, and what the log output would be with default Airflow logging settings. There are many use cases for adding additional logging statements from within DAGs, ranging from logging warnings when a specific set of conditions appear over additional debugging messages to catching exceptions but still keeping a record of their having occurred.
```python expandable wrap theme={null}
from pendulum import datetime, duration
from airflow.decorators import dag, task
from airflow.operators.bash import BashOperator
# import the logging module
import logging
# get the airflow.task logger
task_logger = logging.getLogger("airflow.task")
@task
def extract():
# with default airflow logging settings, DEBUG logs are ignored
task_logger.debug("This log is at the level of DEBUG")
# each of these lines produces a log statement
print("This log is created with a print statement")
task_logger.info("This log is informational")
task_logger.warning("This log is a warning")
task_logger.error("This log shows an error!")
task_logger.critical("This log shows a critical error!")
data = {"a": 19, "b": 23, "c": 42}
# Using the Task flow API to push to XCom by returning a value
return data
# logs outside of tasks will not be processed
task_logger.warning("This log will not show up!")
# command to create a file and write the data from the extract task into it
# these commands use Jinja templating within {{}}
commands = """
touch /usr/local/airflow/{{ds}}.txt
echo {{ti.xcom_pull(task_ids='extract')}} > /usr/local/airflow/{{ds}}.txt
"""
@dag(
start_date=datetime(2022, 6, 5),
schedule="@daily",
dagrun_timeout=duration(minutes=10),
catchup=False,
)
def more_logs_dag():
write_to_file = BashOperator(task_id="write_to_file", bash_command=commands)
# logs outside of tasks will not be processed
task_logger.warning("This log will not show up!")
extract() >> write_to_file
more_logs_dag()
```
Traditional
```python expandable wrap theme={null}
from pendulum import datetime, duration
from airflow import DAG
from airflow.operators.python import PythonOperator
from airflow.operators.bash import BashOperator
# import the logging module
import logging
# get the airflow.task logger
task_logger = logging.getLogger("airflow.task")
def extract_function():
# with default airflow logging settings, DEBUG logs are ignored
task_logger.debug("This log is at the level of DEBUG")
# each of these lines produces a log statement
print("This log is created with a print statement")
task_logger.info("This log is informational")
task_logger.warning("This log is a warning")
task_logger.error("This log shows an error!")
task_logger.critical("This log shows a critical error!")
data = {"a": 19, "b": 23, "c": 42}
# Using the Task flow API to push to XCom by returning a value
return data
# logs outside of tasks will not be processed
task_logger.warning("This log will not show up!")
# command to create a file and write the data from the extract task into it
# these commands use Jinja templating within {{}}
commands = """
touch /usr/local/airflow/{{ds}}.txt
echo {{ti.xcom_pull(task_ids='extract')}} > /usr/local/airflow/{{ds}}.txt
"""
with DAG(
dag_id="more_logs_dag",
start_date=datetime(2022, 6, 5),
schedule="@daily",
dagrun_timeout=duration(minutes=10),
catchup=False,
) as dag:
extract = PythonOperator(task_id="extract", python_callable=extract_function)
write_to_file = BashOperator(task_id="write_to_file", bash_command=commands)
# logs outside of tasks will not be processed
task_logger.warning("This log will not show up!")
extract >> write_to_file
```
For the previous DAG, the logs for the `extract` task show the following lines under the default Airflow logging configuration (set at the level of `INFO`):
```bash wrap theme={null}
[2022-06-06, 07:25:09 UTC] {logging_mixin.py:115} INFO - This log is created with a print statement
[2022-06-06, 07:25:09 UTC] {more_logs_dag.py:15} INFO - This log is informational
[2022-06-06, 07:25:09 UTC] {more_logs_dag.py:16} WARNING - This log is a warning
[2022-06-06, 07:25:09 UTC] {more_logs_dag.py:17} ERROR - This log shows an error!
[2022-06-06, 07:25:09 UTC] {more_logs_dag.py:18} CRITICAL - This log shows a critical error!
```
### Airflow task log customization
Recent Airflow versions added options to customize task logs displayed in the UI by allowing log groups (Airflow 2.9) and to use keywords to turn lines red or yellow (Airflow 2.10).
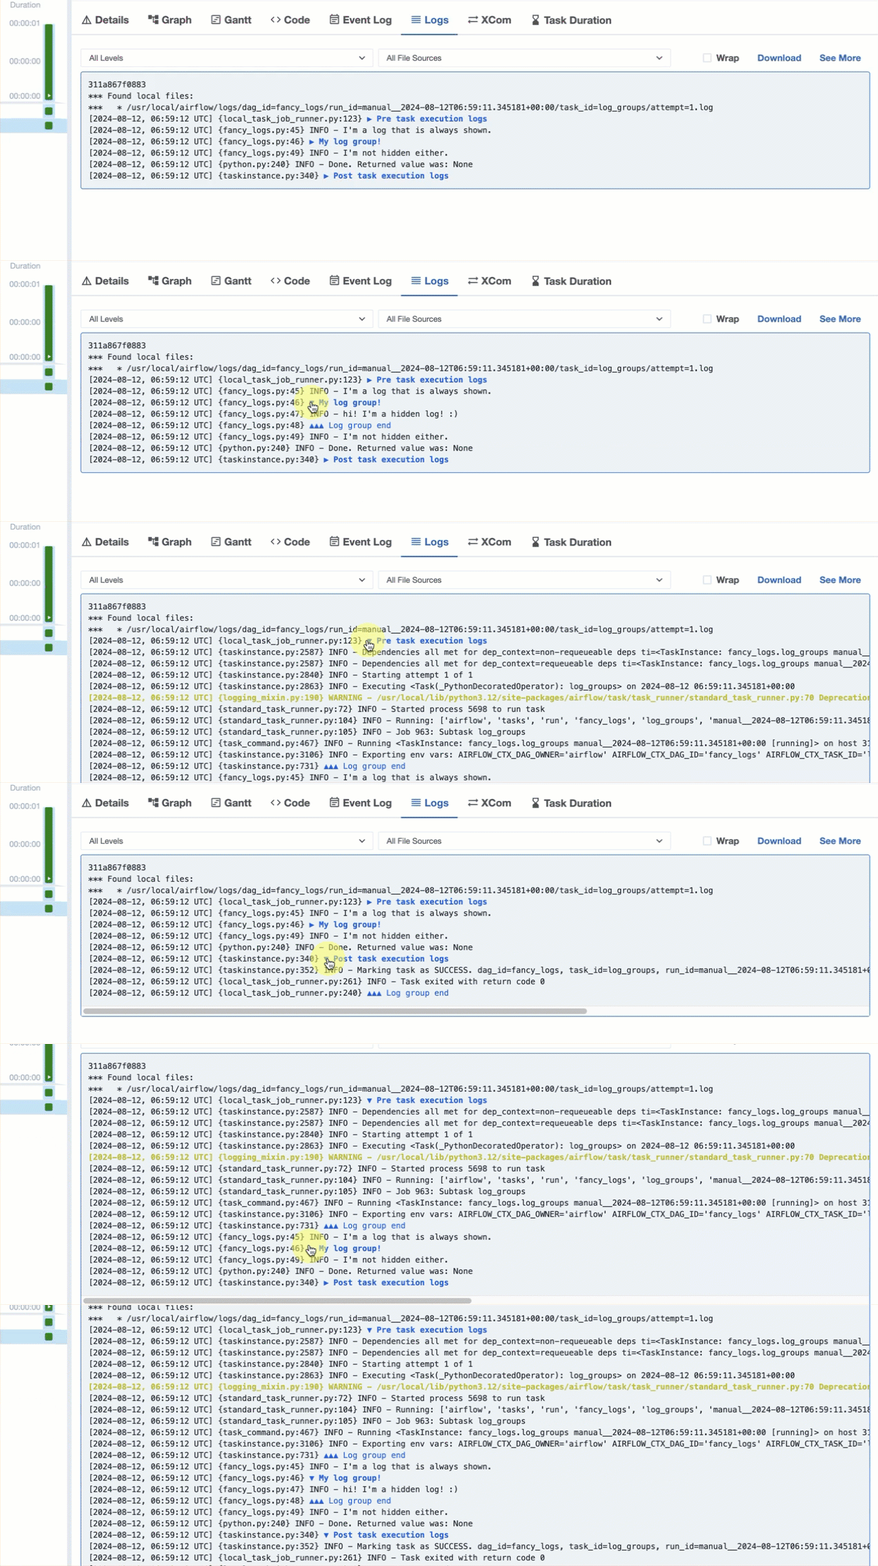
By default, Airflow groups all `Pre task execution logs` as well as all `Post task execution logs` in the Airflow UI. To see the full logs, click the triangle to expand the log groups.
To add your own log groups, use the `::group::` syntax:
```text wrap theme={null}
t_log.info("::group::")
t_log.info("")
t_log.info("::endgroup::")
```
The task below creates one new log group containing one hidden log line:
```python wrap theme={null}
# from airflow.decorators import dag, task
# import logging
t_log = logging.getLogger("airflow.task")
@task
def log_groups():
t_log.info("I'm a log that is always shown.")
t_log.info("::group::My log group!")
t_log.info("hi! I'm a hidden log! :)")
t_log.info("::endgroup::")
t_log.info("I'm not hidden either.")
log_groups()
```
In the Airflow UI you can collapse and expand this log group:
 Airflow 2.10 added log line highlighting based on keywords in the Airflow UI.
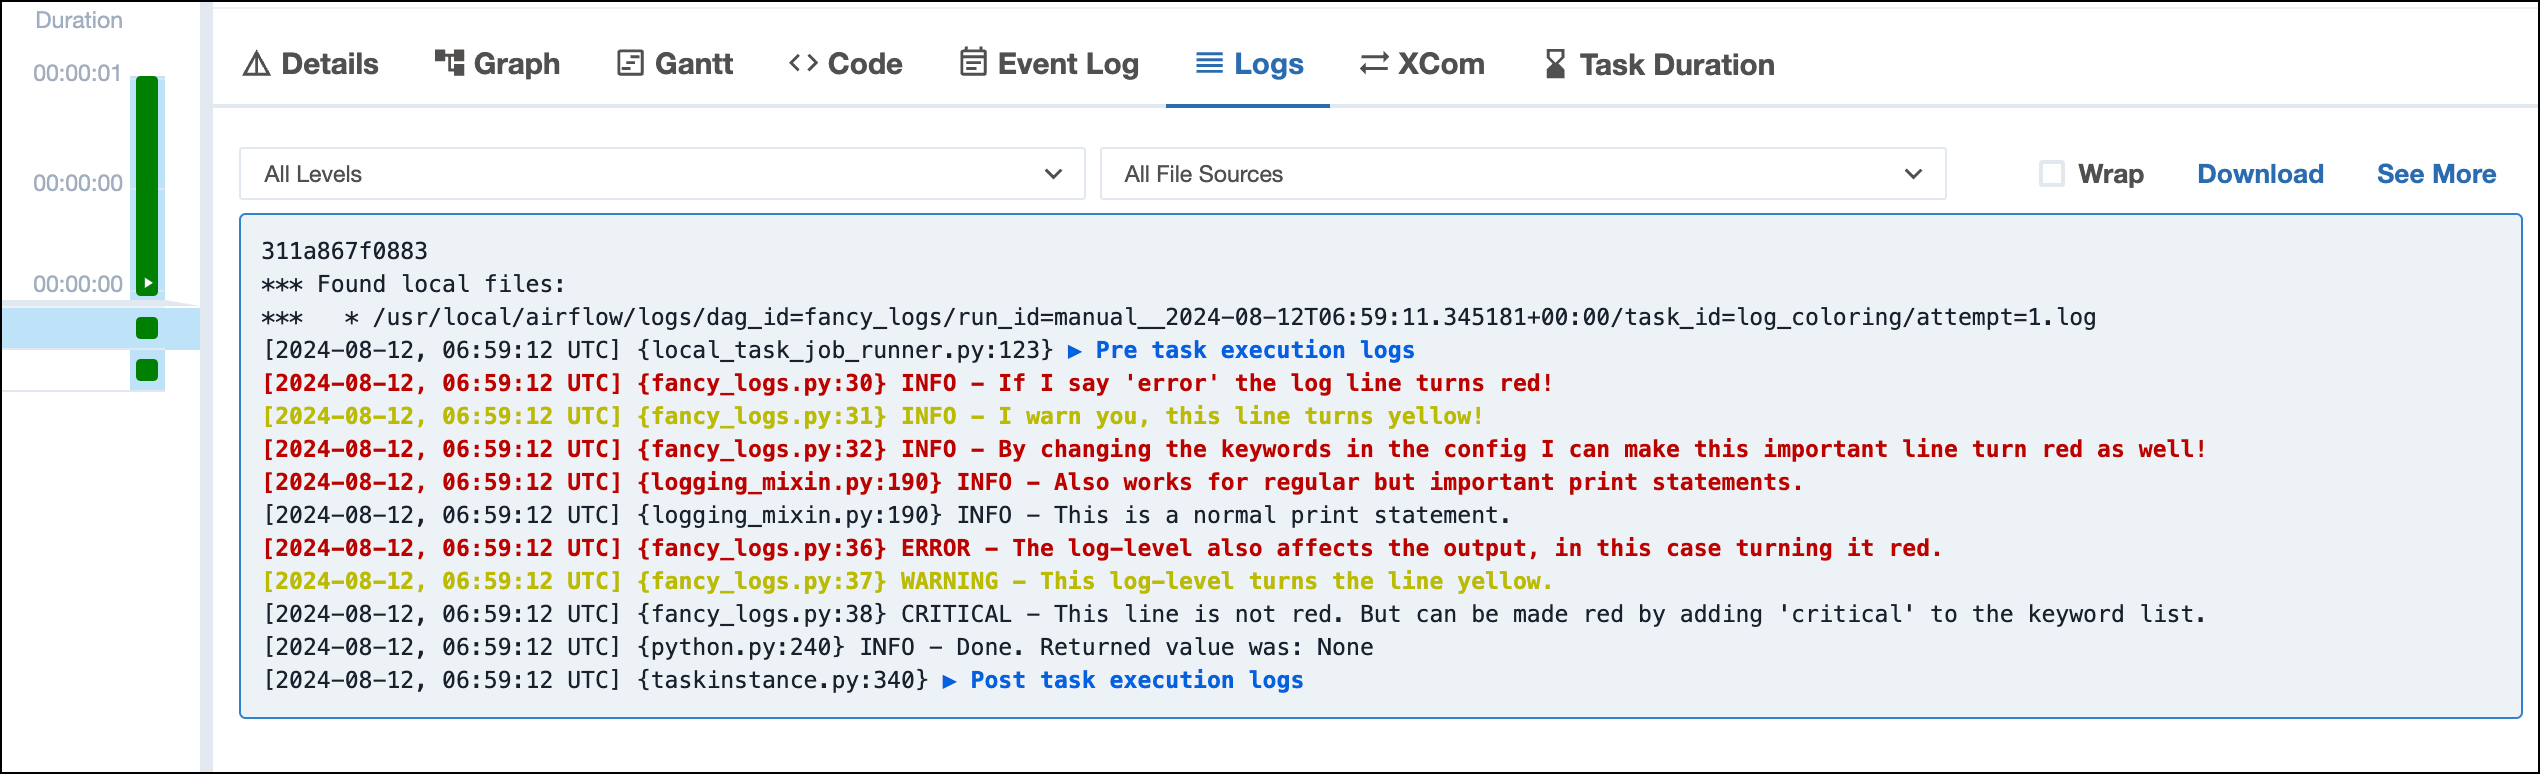
By default, any lines that are logged with the level `error` or contain the words `error` or `exception` are logged in red. Any lines emitted with the level `warn` or containing the word `warn` are yellow. You can change this behavior by changing the [`AIRFLOW__LOGGING__COLOR_LOG_ERROR_KEYWORDS`](https://airflow.apache.org/docs/apache-airflow/stable/configurations-ref.html#color-log-error-keywords) and [`AIRFLOW__LOGGING__COLOR_LOG_WARNING_KEYWORDS`](https://airflow.apache.org/docs/apache-airflow/stable/configurations-ref.html#color-log-warning-keywords) Airflow configurations.
For example, after setting `AIRFLOW__LOGGING__COLOR_LOG_ERROR_KEYWORDS=error,exception,important` in an Airflow environment the task below logs 4 lines in red and 2 lines in yellow:
```python wrap theme={null}
@task
def log_coloring():
t_log.info("If I say 'error' the log line turns red!")
t_log.info("I warn you, this line turns yellow!")
t_log.info("By changing the keywords in the config I can make this important line turn red as well!")
print("Also works for regular but important print statements.")
print("This is a normal print statement.")
t_log.error("The log-level also affects the output, in this case turning it red.")
t_log.warn("This log-level turns the line yellow.")
t_log.critical("This line is not red. But can be made red by adding 'critical' to the keyword list.")
```
Airflow 2.10 added log line highlighting based on keywords in the Airflow UI.
By default, any lines that are logged with the level `error` or contain the words `error` or `exception` are logged in red. Any lines emitted with the level `warn` or containing the word `warn` are yellow. You can change this behavior by changing the [`AIRFLOW__LOGGING__COLOR_LOG_ERROR_KEYWORDS`](https://airflow.apache.org/docs/apache-airflow/stable/configurations-ref.html#color-log-error-keywords) and [`AIRFLOW__LOGGING__COLOR_LOG_WARNING_KEYWORDS`](https://airflow.apache.org/docs/apache-airflow/stable/configurations-ref.html#color-log-warning-keywords) Airflow configurations.
For example, after setting `AIRFLOW__LOGGING__COLOR_LOG_ERROR_KEYWORDS=error,exception,important` in an Airflow environment the task below logs 4 lines in red and 2 lines in yellow:
```python wrap theme={null}
@task
def log_coloring():
t_log.info("If I say 'error' the log line turns red!")
t_log.info("I warn you, this line turns yellow!")
t_log.info("By changing the keywords in the config I can make this important line turn red as well!")
print("Also works for regular but important print statements.")
print("This is a normal print statement.")
t_log.error("The log-level also affects the output, in this case turning it red.")
t_log.warn("This log-level turns the line yellow.")
t_log.critical("This line is not red. But can be made red by adding 'critical' to the keyword list.")
```
 For color customization of logs sent to a TTY terminal, see the [Airflow configuration reference](https://airflow.apache.org/docs/apache-airflow/stable/configurations-ref.html#colored-log-format).
## When to configure logging
Logging in Airflow is ready to use without any additional configuration. However, there are many use cases where customization of logging is beneficial. For example:
* Changing the format of existing logs to contain additional information: for example, the full pathname of the source file from which the logging call was made.
* Adding additional handlers: for example, to log all critical errors in a separate file.
* Storing logs remotely.
* Adding your own custom handlers: for example, to log remotely to a destination not yet supported by existing providers.
## How to configure logging
Options for configuring logging on Astro differ from those described in this section. For guidance specific to Astro, see: [View Airflow component and task logs for a Deployment](/docs/astro/view-logs).
Logging in Airflow can be configured in `airflow.cfg` or by providing a custom `log_config.py` file. It is best practice not to declare configs or variables within the `.py` handler files except for testing or debugging purposes.
In the Airflow CLI, run the following commands to return the current task handler and logging configuration. If you're running Airflow in containers, make sure to enter your scheduler container before running the commands:
```console wrap theme={null}
airflow info # shows the current handler
airflow config list # shows current parameters under [logging]
```
A full list of parameters relating to logging that can be configured in `airflow.cfg` can be found in the [`base_log_folder`](https://airflow.apache.org/docs/apache-airflow/stable/configurations-ref.html#logging) reference. They can also be configured by setting their corresponding environment variables.
For example, to change your logging level from the default `INFO` to `LogRecords` with a level of `ERROR` or above, you set `logging_level = ERROR` in `airflow.cfg` or define an environment variable `AIRFLOW__LOGGING__LOGGING_LEVEL=ERROR`.
[Advanced configuration](https://airflow.apache.org/docs/apache-airflow/stable/administration-and-deployment/logging-monitoring/advanced-logging-configuration.html#custom-logger-for-operators-hooks-and-tasks) might necessitate the logging config class to be overwritten. To enable custom logging, you need to create the configuration file `~/airflow/config/log_config.py` and specify your modifications to `DEFAULT_LOGGING_CONFIG`. You might need to do this to add a custom handler.
## Remote logging
Options for configuring remote logging on Astro differ from those described in this section. For guidance specific to Astro, see:
* [Export metrics and logs to Datadog](/docs/astro/export-datadog).
* [Export logs to AWS CloudWatch](/docs/astro/export-cloudwatch).
When scaling your Airflow environment, you might produce more logs than your Airflow environment can store. In this case, you need reliable, resilient, and auto-scaling storage. The easiest solution is to use remote logging to a remote service which is already supported by the following community-managed providers:
* Alibaba: `OSSTaskHandler` (`oss://`)
* Amazon: `S3TaskHandler` (`s3://`), `CloudwatchTaskHandler` (`cloudwatch://`)
* [Elasticsearch](https://airflow.apache.org/docs/apache-airflow-providers-elasticsearch/stable/logging/index.html): `ElasticsearchTaskHandler` (further configured with `elasticsearch` in `airflow.cfg`)
* [Google](https://airflow.apache.org/docs/apache-airflow-providers-google/stable/logging/index.html): `GCSTaskHandler` (`gs://`), `StackdriverTaskHandler` (`stackdriver://`)
* [Microsoft Azure](https://airflow.apache.org/docs/apache-airflow-providers-microsoft-azure/stable/logging/index.html): `WasbTaskHandler` (`wasb`)
By configuring `REMOTE_BASE_LOG_FOLDER` with the prefix of a supported provider, you can override the default task handler (`FileTaskHandler`) to send logs to a remote destination task handler. For example, `GCSTaskHandler`.
If you want different behavior or to add several handlers to one logger, you need to make changes to `DEFAULT_LOGGING_CONFIG`.
Logs are sent to remote storage only once a task has been completed or failed. This means that logs of currently running tasks are accessible only from your local Airflow environment.
## Remote logging example: Send task logs to Amazon S3
Options for configuring remote logging on Astro differ from those described in this section. For guidance specific to Astro, see:
* [Export metrics and logs to Datadog](/docs/astro/export-datadog)
* [Export logs to AWS CloudWatch](/docs/astro/export-cloudwatch)
* [Export logs to a Secondary S3 Bucket](/docs/astro/export-secondary-s3-bucket)
* [Export logs to a Secondary WASB Container](/docs/astro/export-secondary-wasb)
1. Add the `apache-airflow-providers-amazon` provider package to `requirements.txt`.
2. Start your Airflow environment and go to **Admin** > **Connections** in the Airflow UI.
3. Create a connection of type **Amazon S3** and set `login` to your AWS access key ID and `password` to your AWS secret access key. See [AWS Account and Access Keys](https://docs.aws.amazon.com/powershell/latest/userguide/pstools-appendix-sign-up.html) for information about retrieving your AWS access key ID and AWS secret access key.
4. Add the following commands to the Dockerfile. Include the double underscores around `LOGGING`:
```docker wrap theme={null}
# allow remote logging and provide a connection ID (see step 2)
ENV AIRFLOW__LOGGING__REMOTE_LOGGING=True
ENV AIRFLOW__LOGGING__REMOTE_LOG_CONN_ID=${AMAZONS3_CON_ID}
# specify the location of your remote logs using your bucket name
ENV AIRFLOW__LOGGING__REMOTE_BASE_LOG_FOLDER=s3://${S3BUCKET_NAME}/logs
# optional: serverside encryption for S3 logs
ENV AIRFLOW__LOGGING__ENCRYPT_S3_LOGS=True
```
These environment variables configure remote logging to one S3 bucket (`S3BUCKET_NAME`). Behind the scenes, Airflow uses these configurations to create an `S3TaskHandler` that overrides the default `FileTaskHandler`.
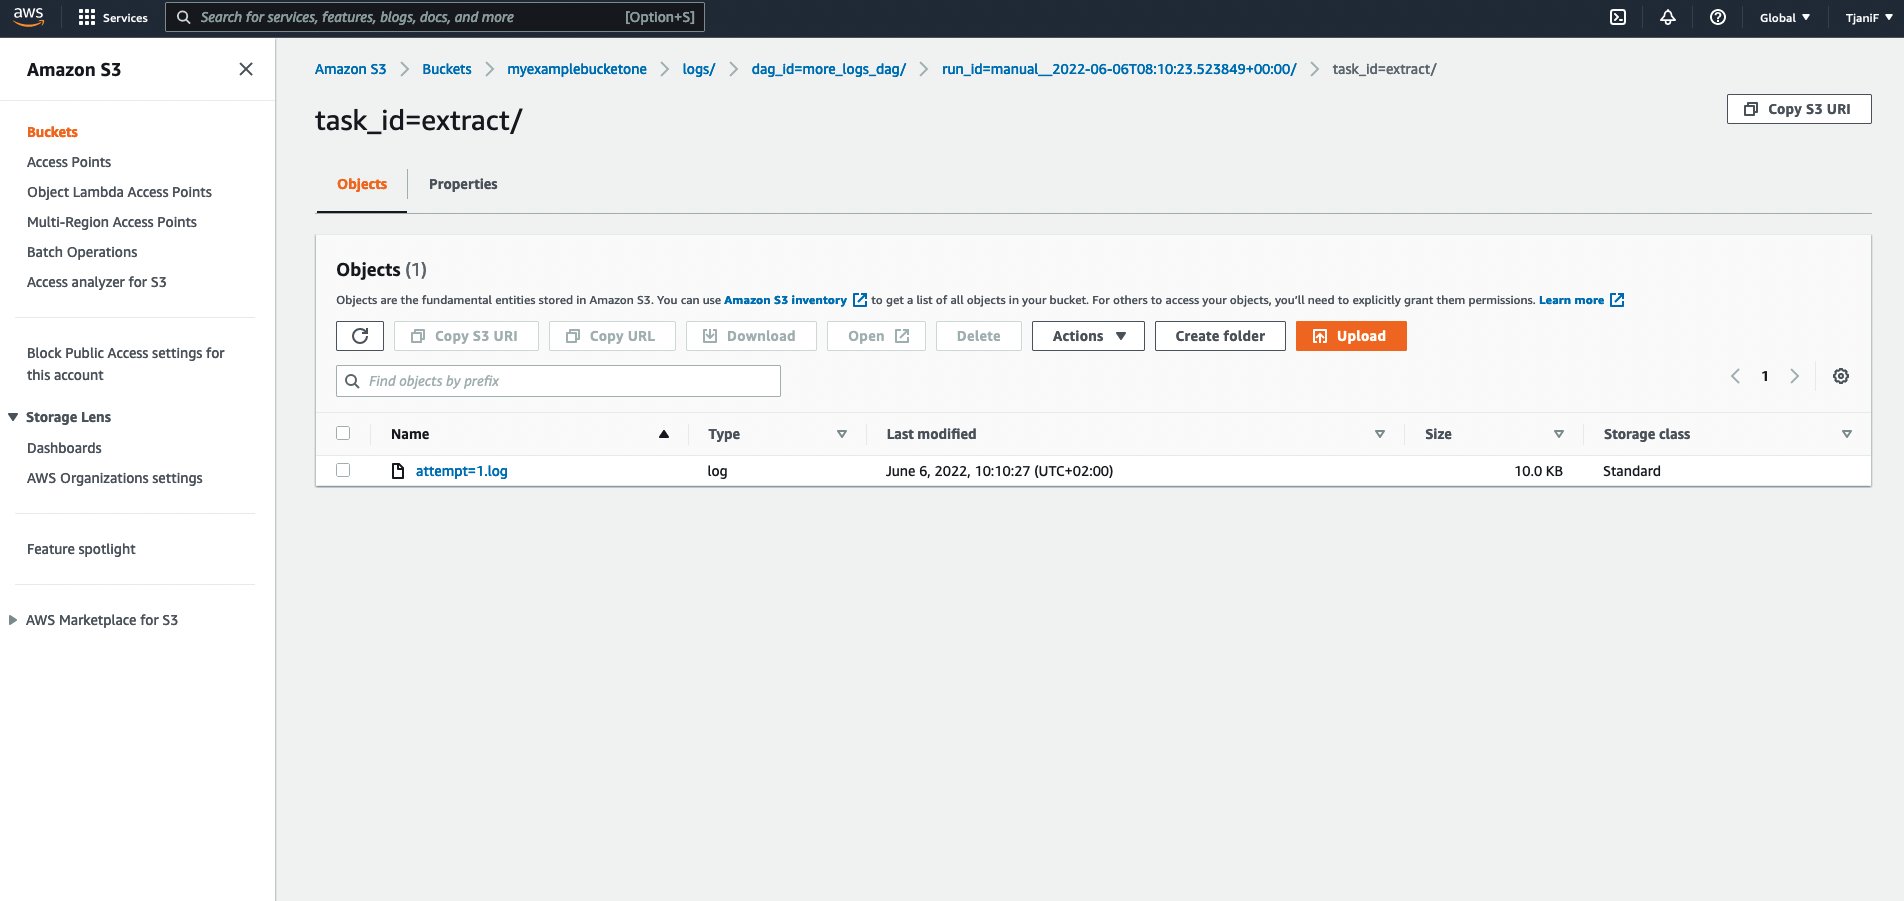
5. Restart your Airflow environment and run any task to verify that the task logs are copied to your S3 bucket.
For color customization of logs sent to a TTY terminal, see the [Airflow configuration reference](https://airflow.apache.org/docs/apache-airflow/stable/configurations-ref.html#colored-log-format).
## When to configure logging
Logging in Airflow is ready to use without any additional configuration. However, there are many use cases where customization of logging is beneficial. For example:
* Changing the format of existing logs to contain additional information: for example, the full pathname of the source file from which the logging call was made.
* Adding additional handlers: for example, to log all critical errors in a separate file.
* Storing logs remotely.
* Adding your own custom handlers: for example, to log remotely to a destination not yet supported by existing providers.
## How to configure logging
Options for configuring logging on Astro differ from those described in this section. For guidance specific to Astro, see: [View Airflow component and task logs for a Deployment](/docs/astro/view-logs).
Logging in Airflow can be configured in `airflow.cfg` or by providing a custom `log_config.py` file. It is best practice not to declare configs or variables within the `.py` handler files except for testing or debugging purposes.
In the Airflow CLI, run the following commands to return the current task handler and logging configuration. If you're running Airflow in containers, make sure to enter your scheduler container before running the commands:
```console wrap theme={null}
airflow info # shows the current handler
airflow config list # shows current parameters under [logging]
```
A full list of parameters relating to logging that can be configured in `airflow.cfg` can be found in the [`base_log_folder`](https://airflow.apache.org/docs/apache-airflow/stable/configurations-ref.html#logging) reference. They can also be configured by setting their corresponding environment variables.
For example, to change your logging level from the default `INFO` to `LogRecords` with a level of `ERROR` or above, you set `logging_level = ERROR` in `airflow.cfg` or define an environment variable `AIRFLOW__LOGGING__LOGGING_LEVEL=ERROR`.
[Advanced configuration](https://airflow.apache.org/docs/apache-airflow/stable/administration-and-deployment/logging-monitoring/advanced-logging-configuration.html#custom-logger-for-operators-hooks-and-tasks) might necessitate the logging config class to be overwritten. To enable custom logging, you need to create the configuration file `~/airflow/config/log_config.py` and specify your modifications to `DEFAULT_LOGGING_CONFIG`. You might need to do this to add a custom handler.
## Remote logging
Options for configuring remote logging on Astro differ from those described in this section. For guidance specific to Astro, see:
* [Export metrics and logs to Datadog](/docs/astro/export-datadog).
* [Export logs to AWS CloudWatch](/docs/astro/export-cloudwatch).
When scaling your Airflow environment, you might produce more logs than your Airflow environment can store. In this case, you need reliable, resilient, and auto-scaling storage. The easiest solution is to use remote logging to a remote service which is already supported by the following community-managed providers:
* Alibaba: `OSSTaskHandler` (`oss://`)
* Amazon: `S3TaskHandler` (`s3://`), `CloudwatchTaskHandler` (`cloudwatch://`)
* [Elasticsearch](https://airflow.apache.org/docs/apache-airflow-providers-elasticsearch/stable/logging/index.html): `ElasticsearchTaskHandler` (further configured with `elasticsearch` in `airflow.cfg`)
* [Google](https://airflow.apache.org/docs/apache-airflow-providers-google/stable/logging/index.html): `GCSTaskHandler` (`gs://`), `StackdriverTaskHandler` (`stackdriver://`)
* [Microsoft Azure](https://airflow.apache.org/docs/apache-airflow-providers-microsoft-azure/stable/logging/index.html): `WasbTaskHandler` (`wasb`)
By configuring `REMOTE_BASE_LOG_FOLDER` with the prefix of a supported provider, you can override the default task handler (`FileTaskHandler`) to send logs to a remote destination task handler. For example, `GCSTaskHandler`.
If you want different behavior or to add several handlers to one logger, you need to make changes to `DEFAULT_LOGGING_CONFIG`.
Logs are sent to remote storage only once a task has been completed or failed. This means that logs of currently running tasks are accessible only from your local Airflow environment.
## Remote logging example: Send task logs to Amazon S3
Options for configuring remote logging on Astro differ from those described in this section. For guidance specific to Astro, see:
* [Export metrics and logs to Datadog](/docs/astro/export-datadog)
* [Export logs to AWS CloudWatch](/docs/astro/export-cloudwatch)
* [Export logs to a Secondary S3 Bucket](/docs/astro/export-secondary-s3-bucket)
* [Export logs to a Secondary WASB Container](/docs/astro/export-secondary-wasb)
1. Add the `apache-airflow-providers-amazon` provider package to `requirements.txt`.
2. Start your Airflow environment and go to **Admin** > **Connections** in the Airflow UI.
3. Create a connection of type **Amazon S3** and set `login` to your AWS access key ID and `password` to your AWS secret access key. See [AWS Account and Access Keys](https://docs.aws.amazon.com/powershell/latest/userguide/pstools-appendix-sign-up.html) for information about retrieving your AWS access key ID and AWS secret access key.
4. Add the following commands to the Dockerfile. Include the double underscores around `LOGGING`:
```docker wrap theme={null}
# allow remote logging and provide a connection ID (see step 2)
ENV AIRFLOW__LOGGING__REMOTE_LOGGING=True
ENV AIRFLOW__LOGGING__REMOTE_LOG_CONN_ID=${AMAZONS3_CON_ID}
# specify the location of your remote logs using your bucket name
ENV AIRFLOW__LOGGING__REMOTE_BASE_LOG_FOLDER=s3://${S3BUCKET_NAME}/logs
# optional: serverside encryption for S3 logs
ENV AIRFLOW__LOGGING__ENCRYPT_S3_LOGS=True
```
These environment variables configure remote logging to one S3 bucket (`S3BUCKET_NAME`). Behind the scenes, Airflow uses these configurations to create an `S3TaskHandler` that overrides the default `FileTaskHandler`.
5. Restart your Airflow environment and run any task to verify that the task logs are copied to your S3 bucket.