> ## Documentation Index
> Fetch the complete documentation index at: https://astronomer.io/docs/llms.txt
> Use this file to discover all available pages before exploring further.
# Create a data-aware and dynamic ETL pipeline
[Apache Airflow®](https://airflow.apache.org/)'s Datasets and dynamic task mapping features make it easy to incorporate data-awareness and enhanced automation into your ETL pipelines.
This tutorial is for Apache Airflow users who want to use some of Airflow's powerful features supporting enhanced ETL development: data-awareness and dynamic task generation. As you explore Airflow's modern ETL feature set, you'll create a complete Airflow pipeline that ingests data from an API and a local file, loads and transforms the data in an in-memory database, and visualizes the data in a dashboard. You can run and modify the pipeline in GitHub Codespaces or locally using the [Astro CLI](/docs/cli/v1.43/install-cli).
After you complete this tutorial, you'll be able to:
* Create an ETL pipeline following best practices.
* Write tasks that extract, transform, and load data from a JSON API and CSV file into an in-memory database.
* Configure DAGs to trigger using **data-aware scheduling** with Airflow Datasets.
* Use **dynamic task mapping** to automate parallel task creation at runtime.
* Visualize data in a responsive dashboard.
**Other ways to learn**
There are multiple resources for learning about this topic. See also:
* [Datasets and data-aware scheduling in Airflow](/docs/learn/airflow-datasets).
* [Create dynamic Airflow tasks](/docs/learn/dynamic-tasks#mapping-over-multiple-parameters).
* [How to use the TaskFlow API](/docs/learn/airflow-decorators#how-to-use-the-taskflow-api).
## Time to complete
This tutorial takes approximately 1 hour to complete.
## Assumed knowledge
To get the most out of this tutorial, make sure you have an understanding of:
* Basic Airflow concepts. See [Introduction to Apache Airflow](/docs/learn/2.x/intro-to-airflow).
* Basic Python. See the [Python Documentation](https://docs.python.org/3/tutorial/index.html).
## Prerequisites
* A GitHub account **OR** the [Astro CLI](/docs/cli/v1.43/install-cli).
## Overview
Your pipeline will employ six Airflow DAGs and the following tools:
* [DuckDB](https://duckdb.org/), an in-memory relational database, for storing tables of the ingested data as well as the resulting tables after transformations.
* [Streamlit](https://streamlit.io/), a Python package for creating interactive apps, for displaying the data in a dashboard. The Streamlit app will retrieve its data from tables in the DuckDB database.
All tools used are open-source, so you won't need to create additional accounts. Also, you won't need to configure any connections to databases or warehouses.
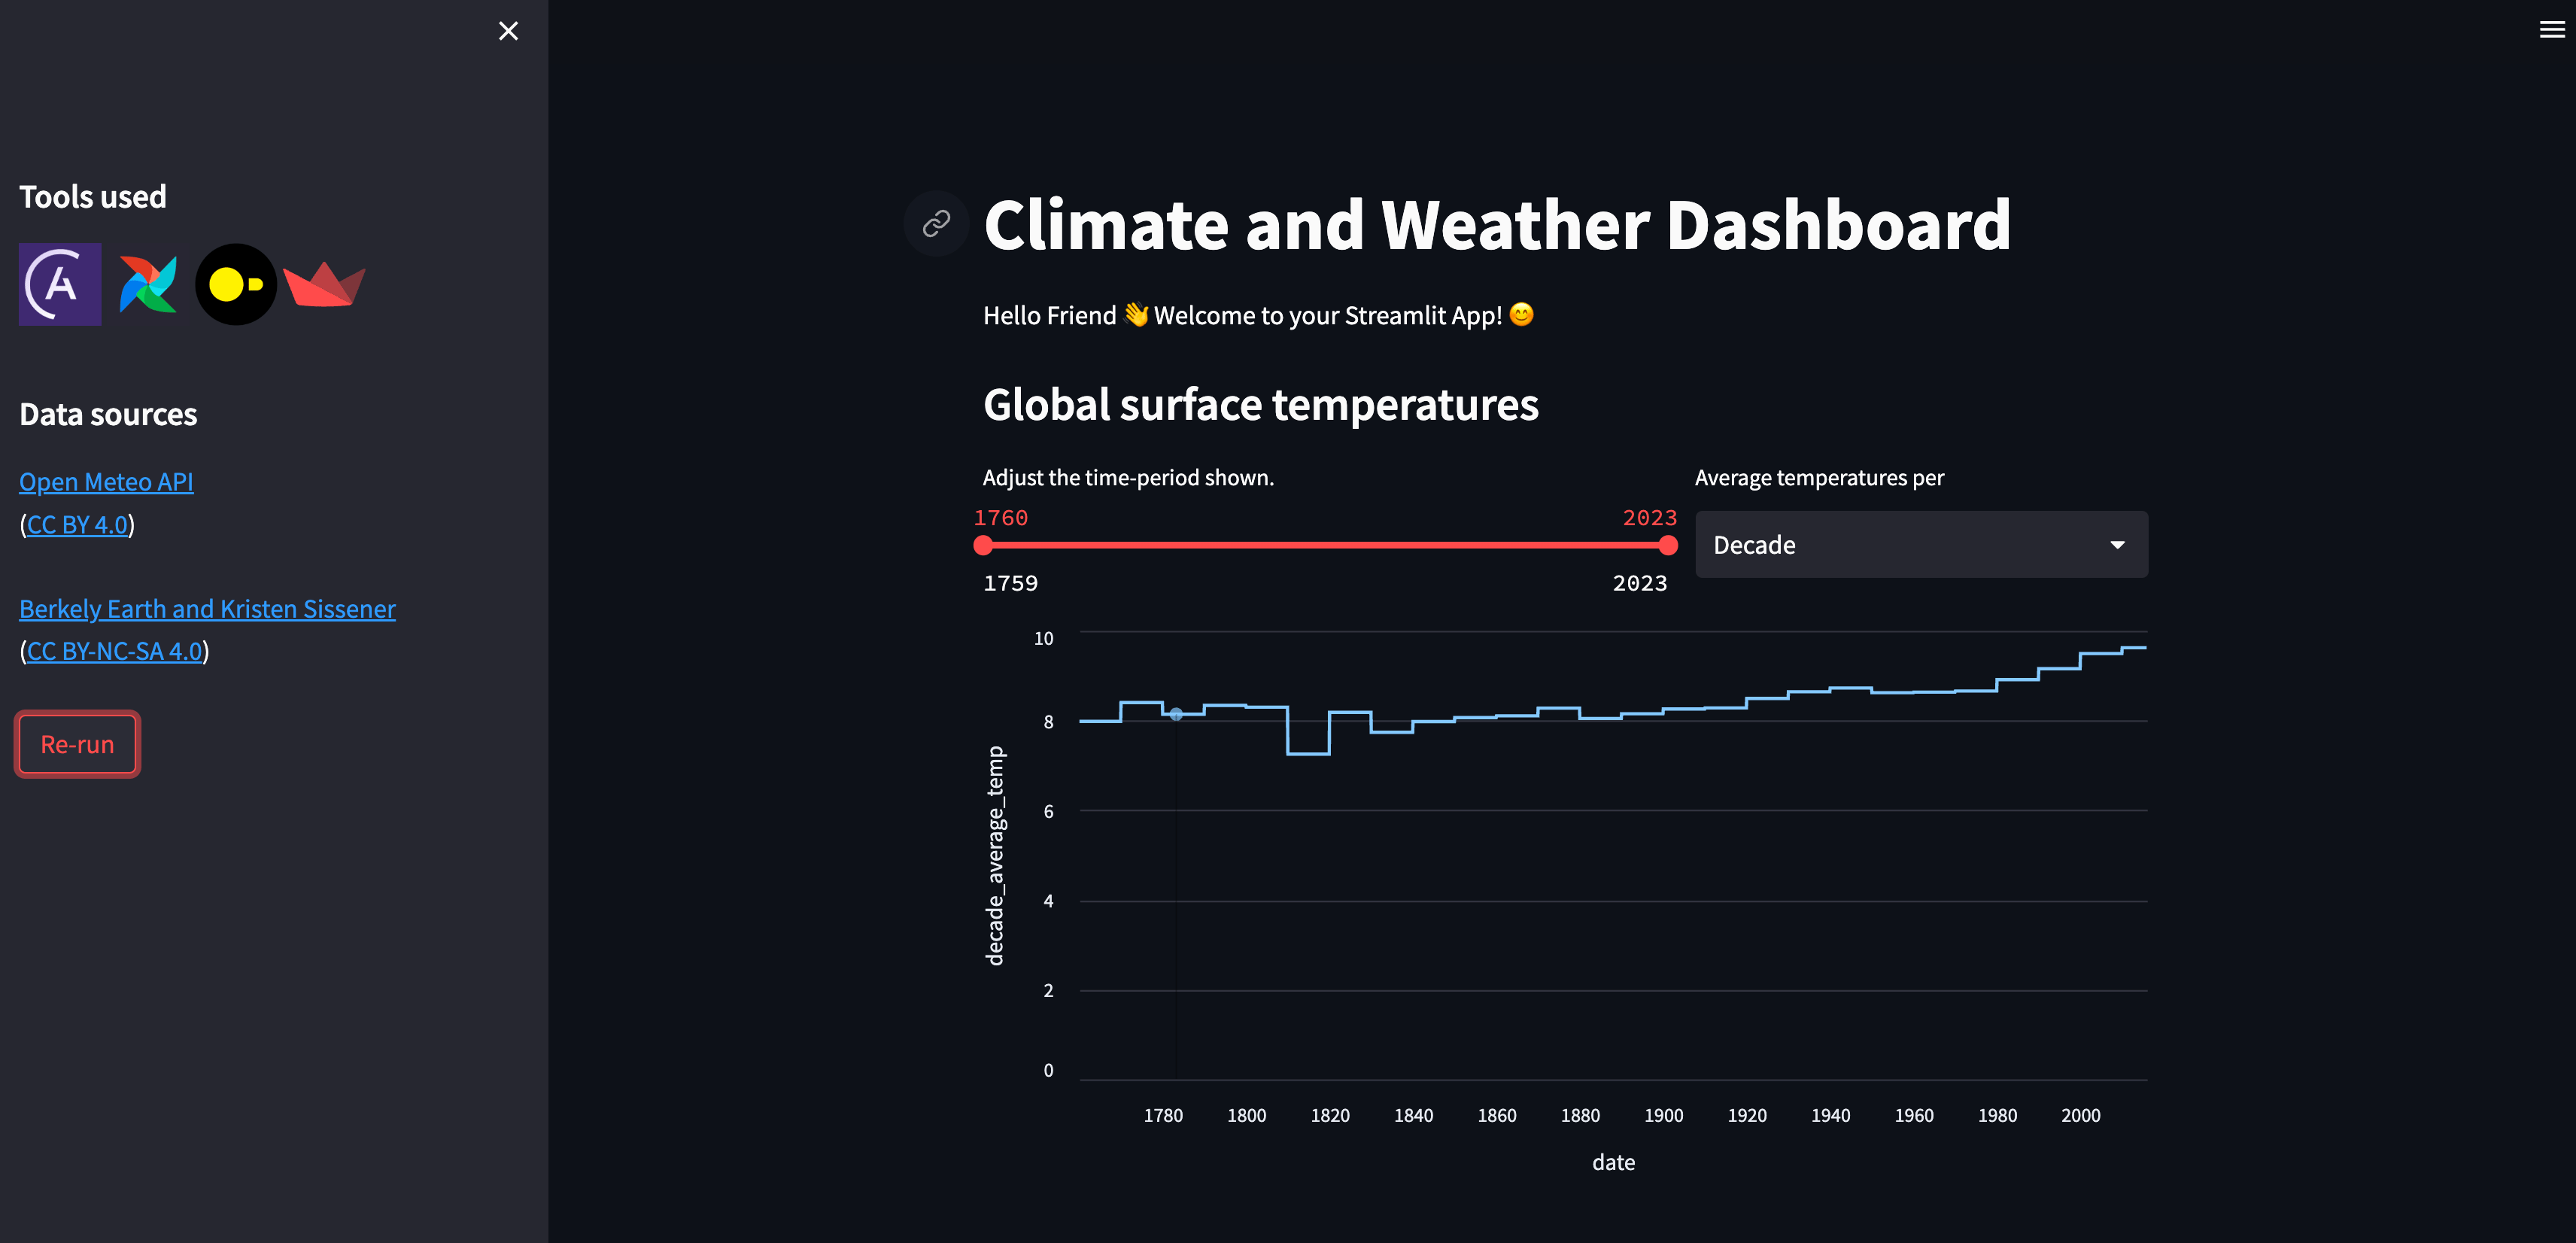
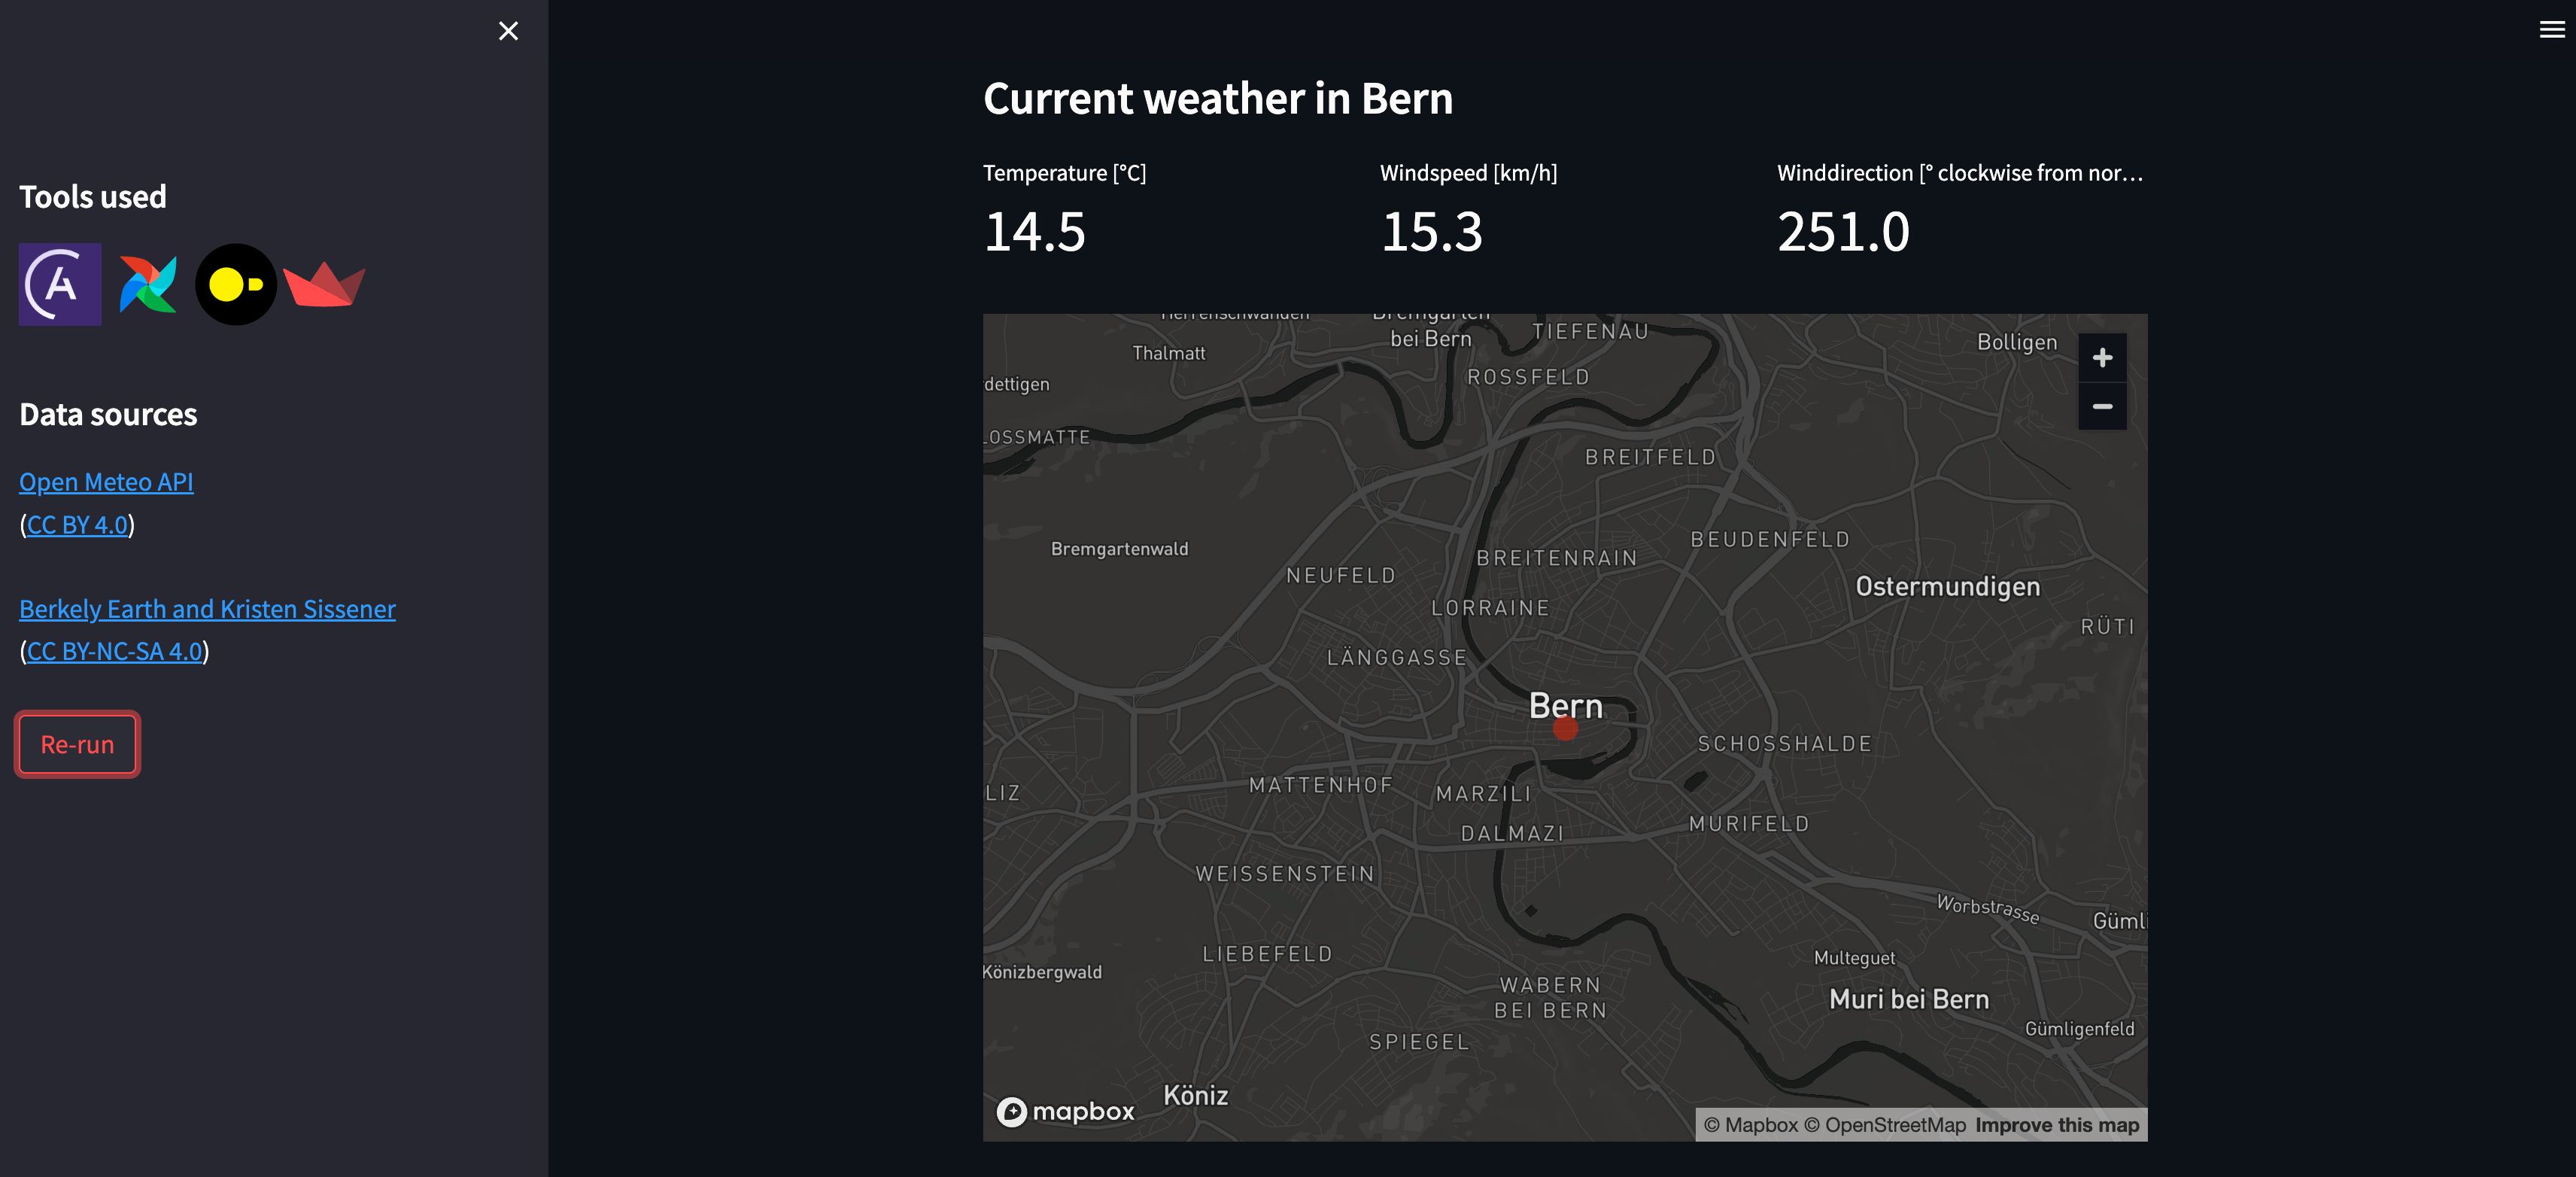
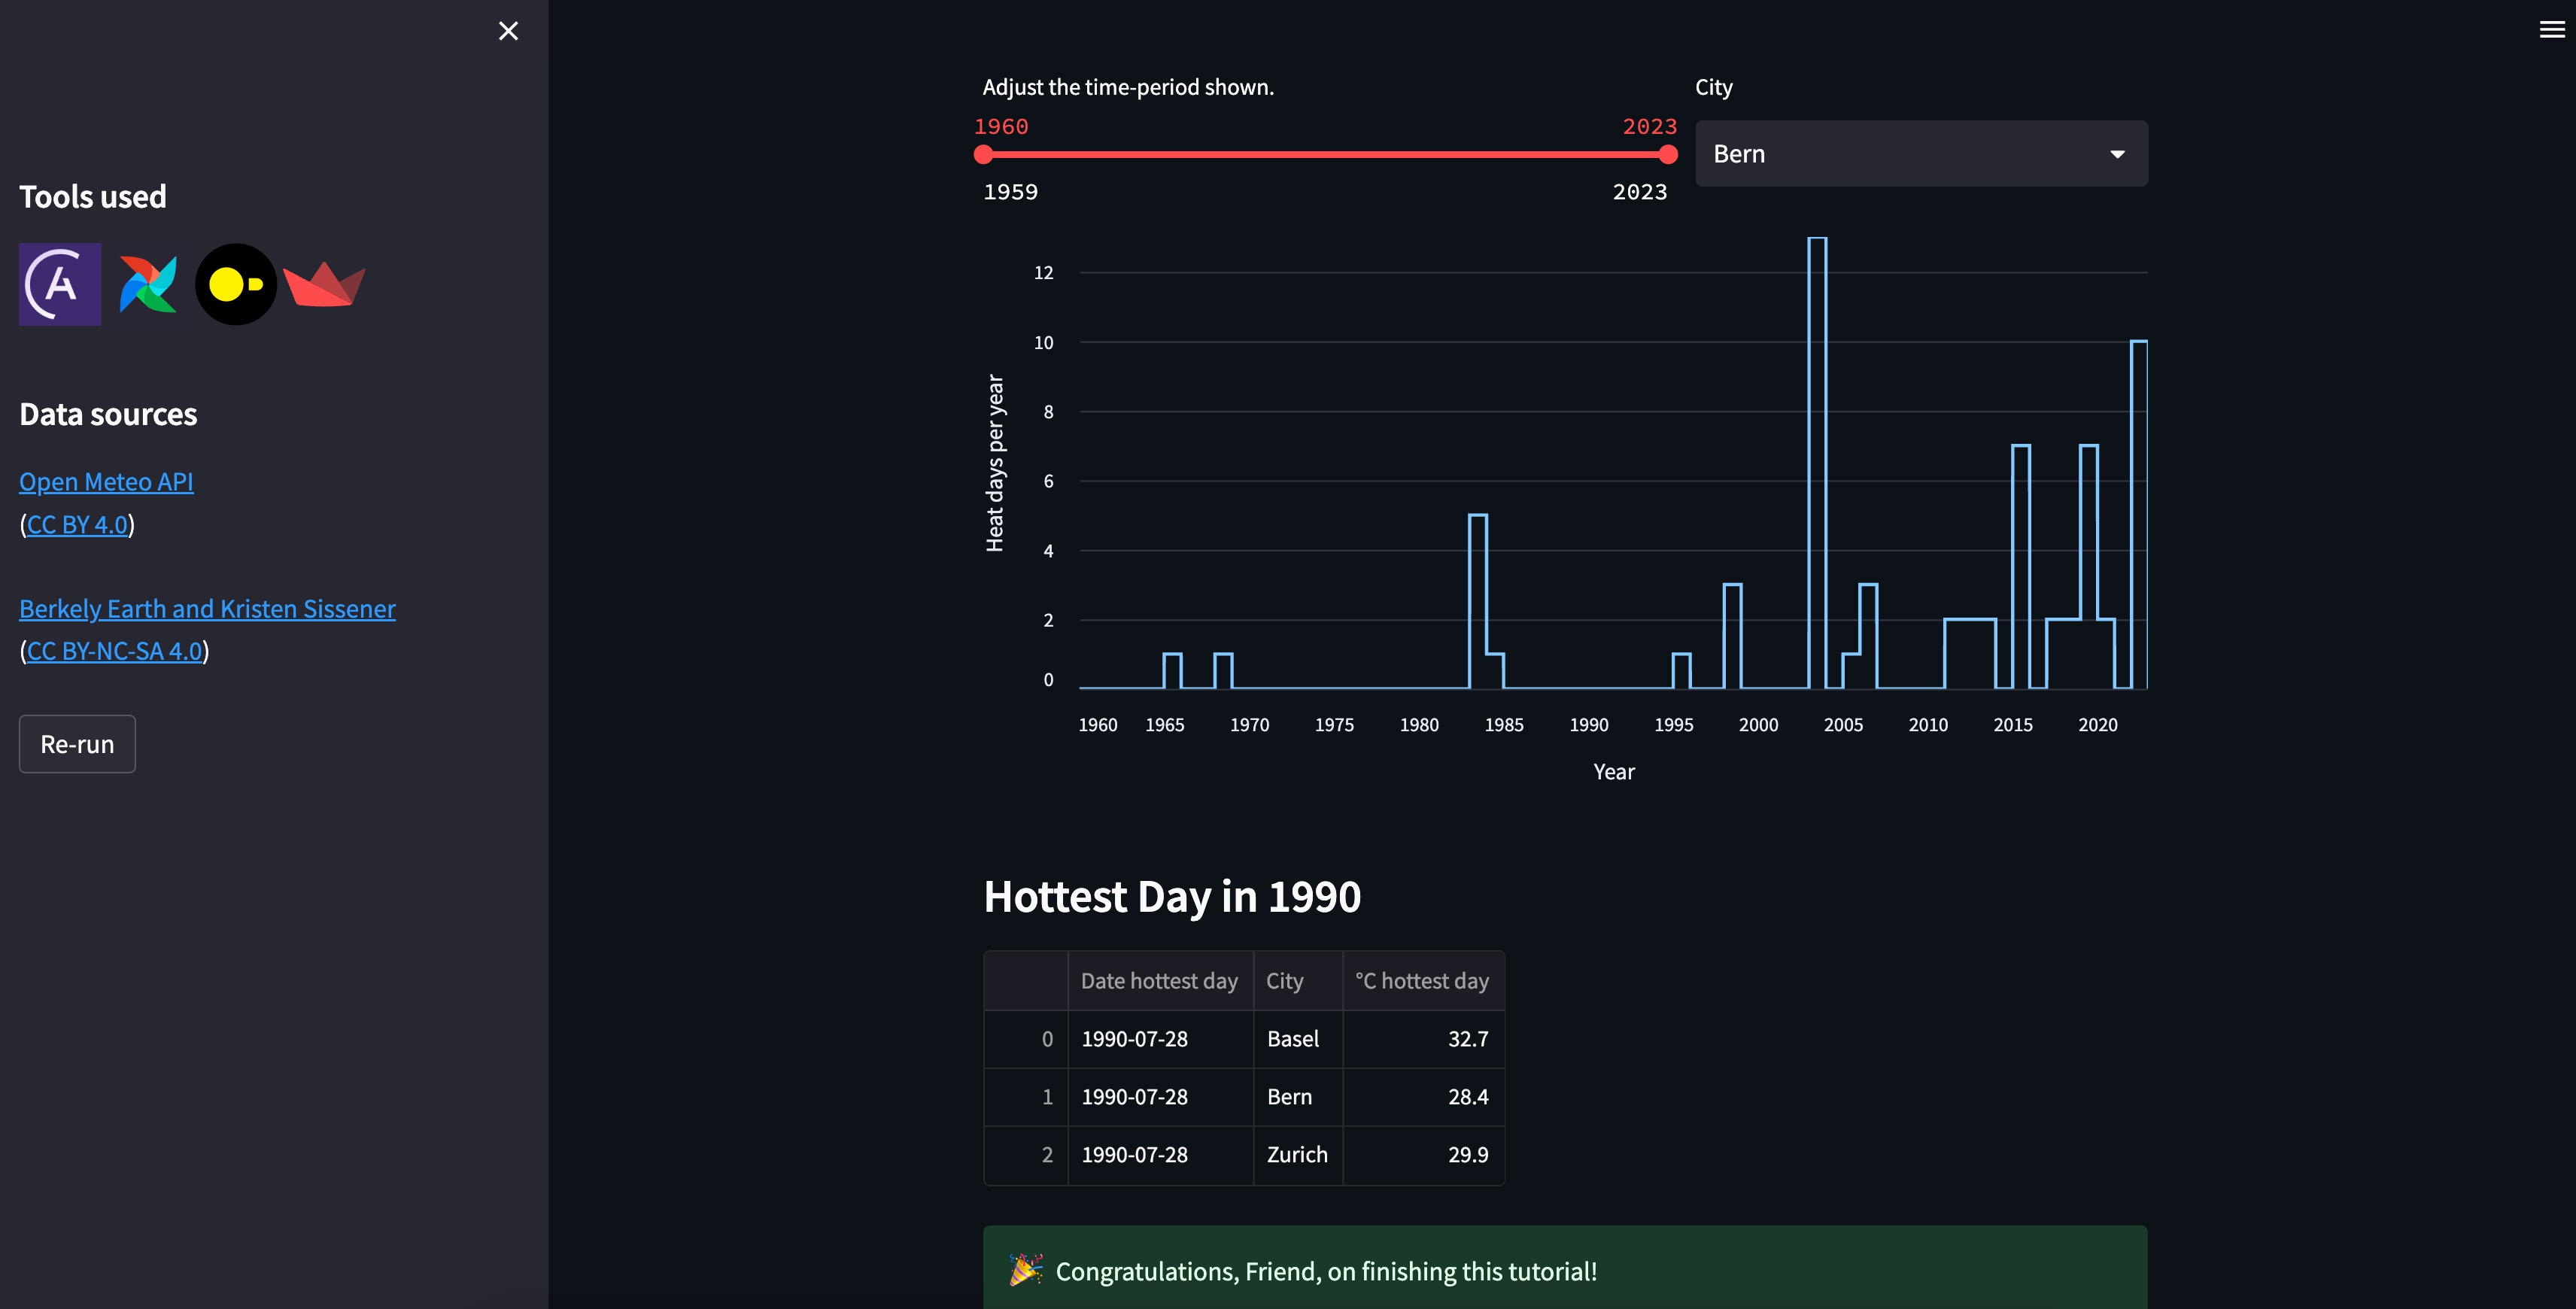
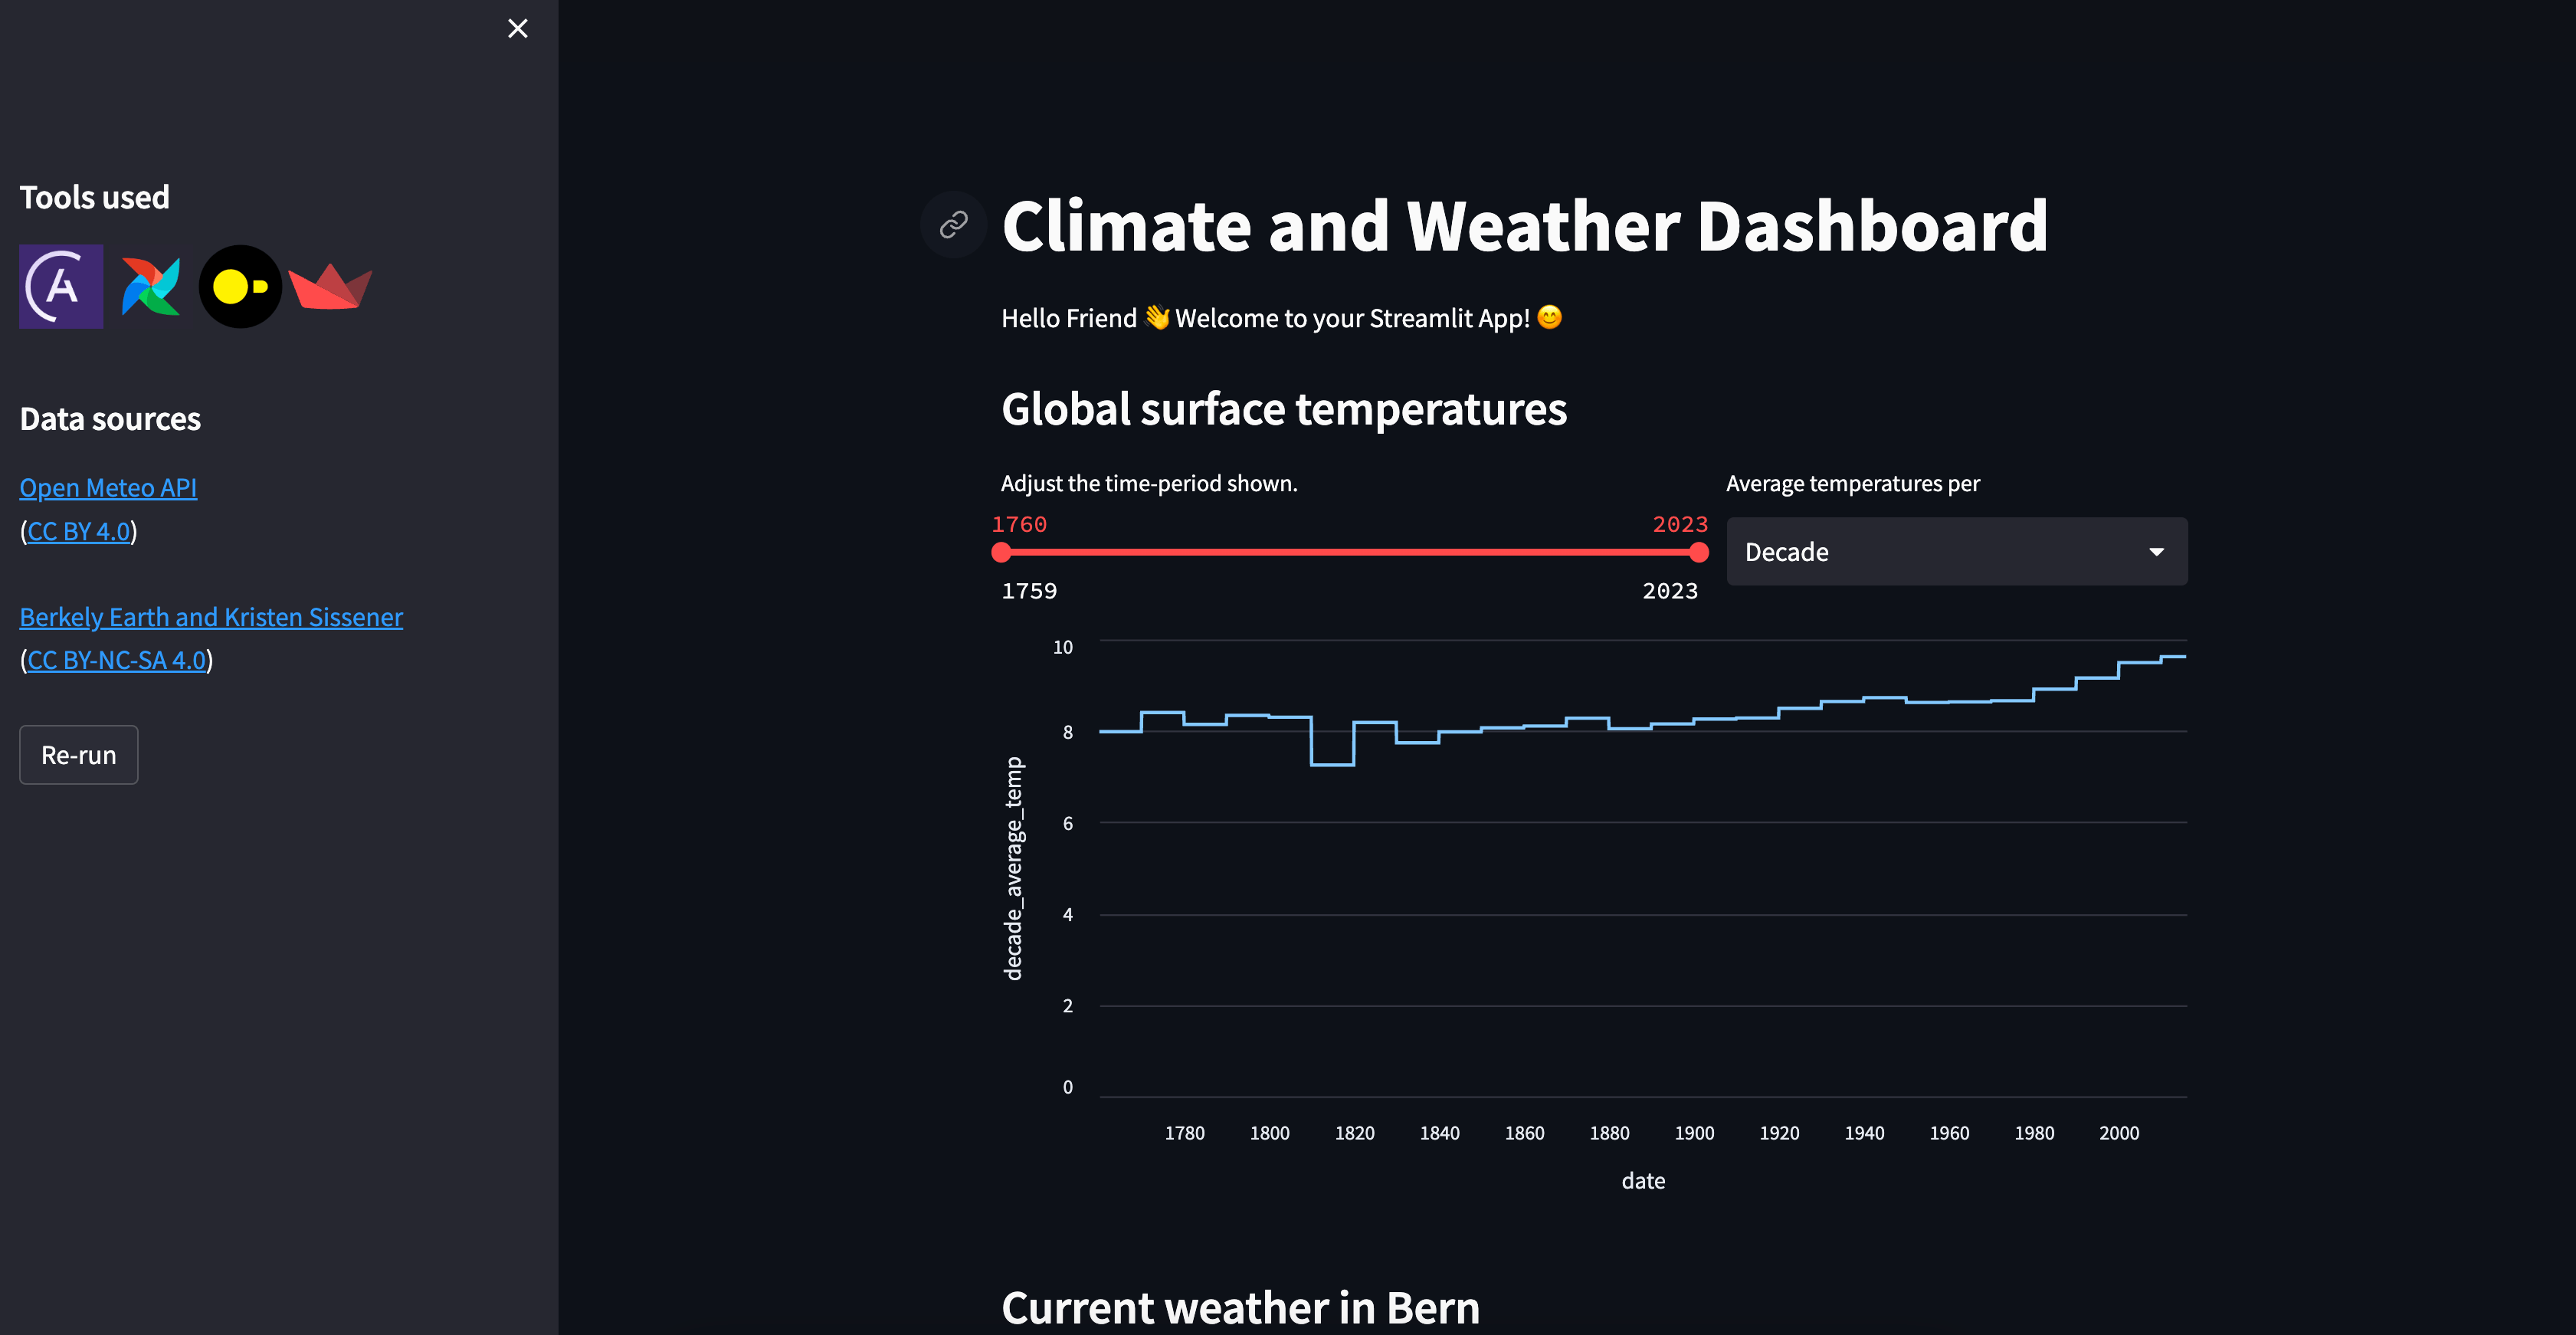
After completing all tasks, the Streamlit dashboard will look similar to the following screenshots:
 ## Step 1: Set up your project
You have two options for running the project. If you don't want to install any tools locally, you can use GitHub Codespaces. If you prefer to work locally or already have the Astro CLI installed, you can easily run the pipeline locally.
## Step 1: Set up your project
You have two options for running the project. If you don't want to install any tools locally, you can use GitHub Codespaces. If you prefer to work locally or already have the Astro CLI installed, you can easily run the pipeline locally.
Codespaces
1. Fork the [ETL with Datasets repository](https://github.com/astronomer/etl-datasets-tutorial).
2. Create a new GitHub Codespaces project on your fork. Make sure it uses at least 4 cores!
 3. Run this command in the Codespaces terminal:
```text wrap theme={null}
bash ./.devcontainer/post_creation_script.sh
```
4. The Astro CLI will automatically start up all necessary Airflow components as well as the Streamlit service. This can take a few minutes.
5. Once the Airflow project has started, access the Airflow UI by clicking the **Ports** tab and opening the forward URL for port `8080`.
3. Run this command in the Codespaces terminal:
```text wrap theme={null}
bash ./.devcontainer/post_creation_script.sh
```
4. The Astro CLI will automatically start up all necessary Airflow components as well as the Streamlit service. This can take a few minutes.
5. Once the Airflow project has started, access the Airflow UI by clicking the **Ports** tab and opening the forward URL for port `8080`.
 6. Once the Streamlit app is running, you can access the dashboard by clicking the **Ports** tab and opening the forward URL for port `8501`.

CLI
Download the [Astro CLI](/docs/cli/v1.43/install-cli) to run Airflow locally. `astro` is the only package you will need to install.
1. Run this command in your terminal to create a local clone of the repository:
```text wrap theme={null}
git clone https://github.com/astronomer/etl-datasets-tutorial.git
```
2. Install the Astro CLI by following the steps in the [Astro CLI documentation](/docs/cli/v1.43/install-cli).
3. Run `astro dev start` in your cloned repository.
4. After your Astro project has started, you can access the Airflow UI at `localhost:8080`.
5. Access the Streamlit app at `localhost:8501`. Note: The Streamlit container can take a few moments to start up.
## Step 2: Run the project
All DAGs tagged with `part_1` are part of a pre-built, fully functional Airflow pipeline. To run them:
1. Go to `include/global_variables/user_input_variables.py` and enter your own info for `MY_NAME` and `MY_CITY`.
2. Trigger the `start` DAG and unpause all DAGs that are tagged with `part_1` by clicking the toggle on their left side. Once the `start` DAG is unpaused, it runs once, starting the pipeline. You can also run this DAG manually to trigger further pipeline runs by clicking the play button on the right side of the DAG.
The DAGs that will run are:
* `start`
* `extract_current_weather_data`
* `in_climate_data`
* `transform_climate_data`.
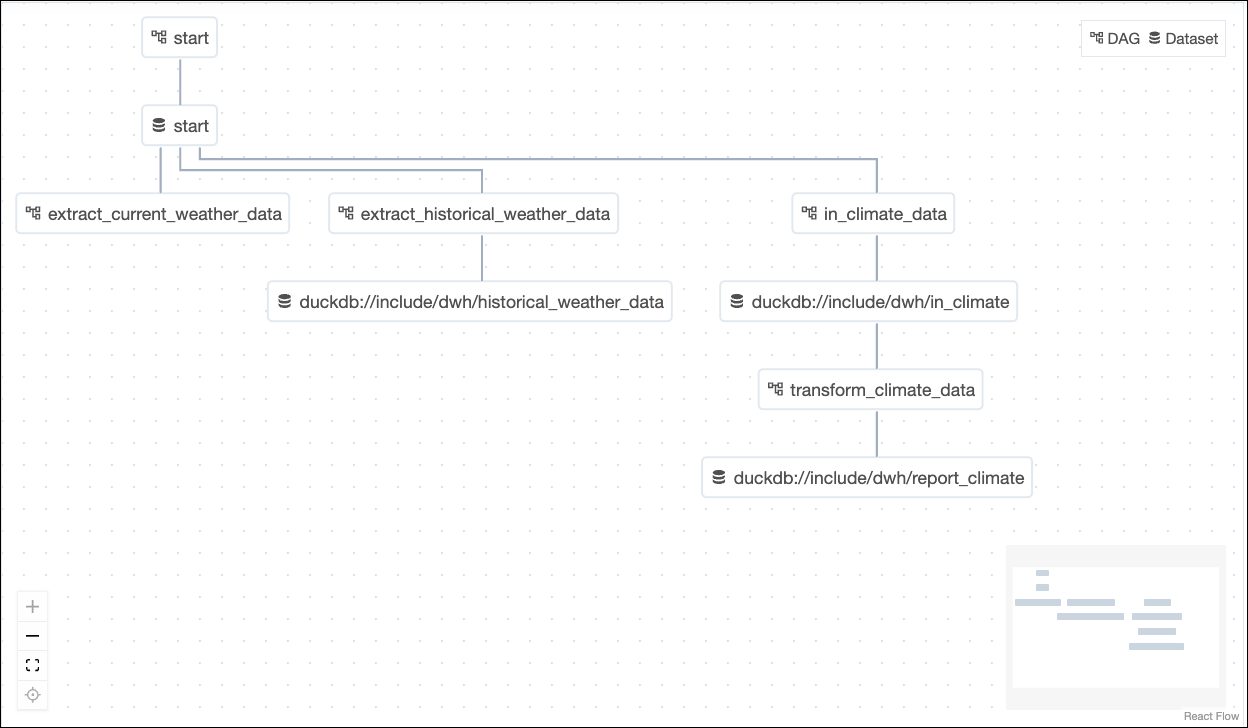
3. Watch the DAGs run according to their dependencies, which have been set using [Datasets](/docs/learn/airflow-datasets).
 4. Open the Streamlit app. If you are using Codespaces, go to the **Ports** tab and open the URL of the forwarded port `8501`. If you are running locally, go to `localhost:8501`.
5. View the Streamlit app, now showing global climate data and the current weather for your city.
4. Open the Streamlit app. If you are using Codespaces, go to the **Ports** tab and open the URL of the forwarded port `8501`. If you are running locally, go to `localhost:8501`.
5. View the Streamlit app, now showing global climate data and the current weather for your city.
 ## Step 3: Update the pipelines
The two DAGs tagged with `part_2` are part of a partially built Airflow pipeline that handles historical weather data. Complete the following steps to finish building the pipeline.
#### Use Airflow Datasets for data-aware scheduling
Datasets allow you to schedule DAGs on the completion of tasks that create or update data assets in your pipelines. Instead of using time-based scheduling, you'll use Datasets to make:
* `extract_historical_weather_data` run after completion of a task with an outlet Dataset in the `start` DAG.
* `transform_historical_weather` run after completion of a task with an outlet Dataset in the `extract_historical_weather_data` DAG.
1. In `include/global_variables/user_input_variables.py`, enter your own info for `HOT_DAY` and `BIRTHYEAR` if you want.
2. Schedule the `extract_historical_weather_data` DAG on the `start_dataset` Dataset defined in the `start` DAG.
```text wrap theme={null}
schedule=[start_dataset],
```
3. Schedule the `transform_historical_weather` DAG on the `extract_dataset` outlet Dataset of the `turn_json_into_table` task, which you will find in the `extract_historical_weather_data` DAG. As in the previous case, the latter DAG's schedule is currently set to `None`, and this is the DAG parameter you need to modify.
```text wrap theme={null}
schedule=[Dataset("duckdb://include/dwh/historical_weather_data")],
```
For more help with using Datasets, see: [Datasets and data-aware scheduling in Airflow](/docs/learn/airflow-datasets).
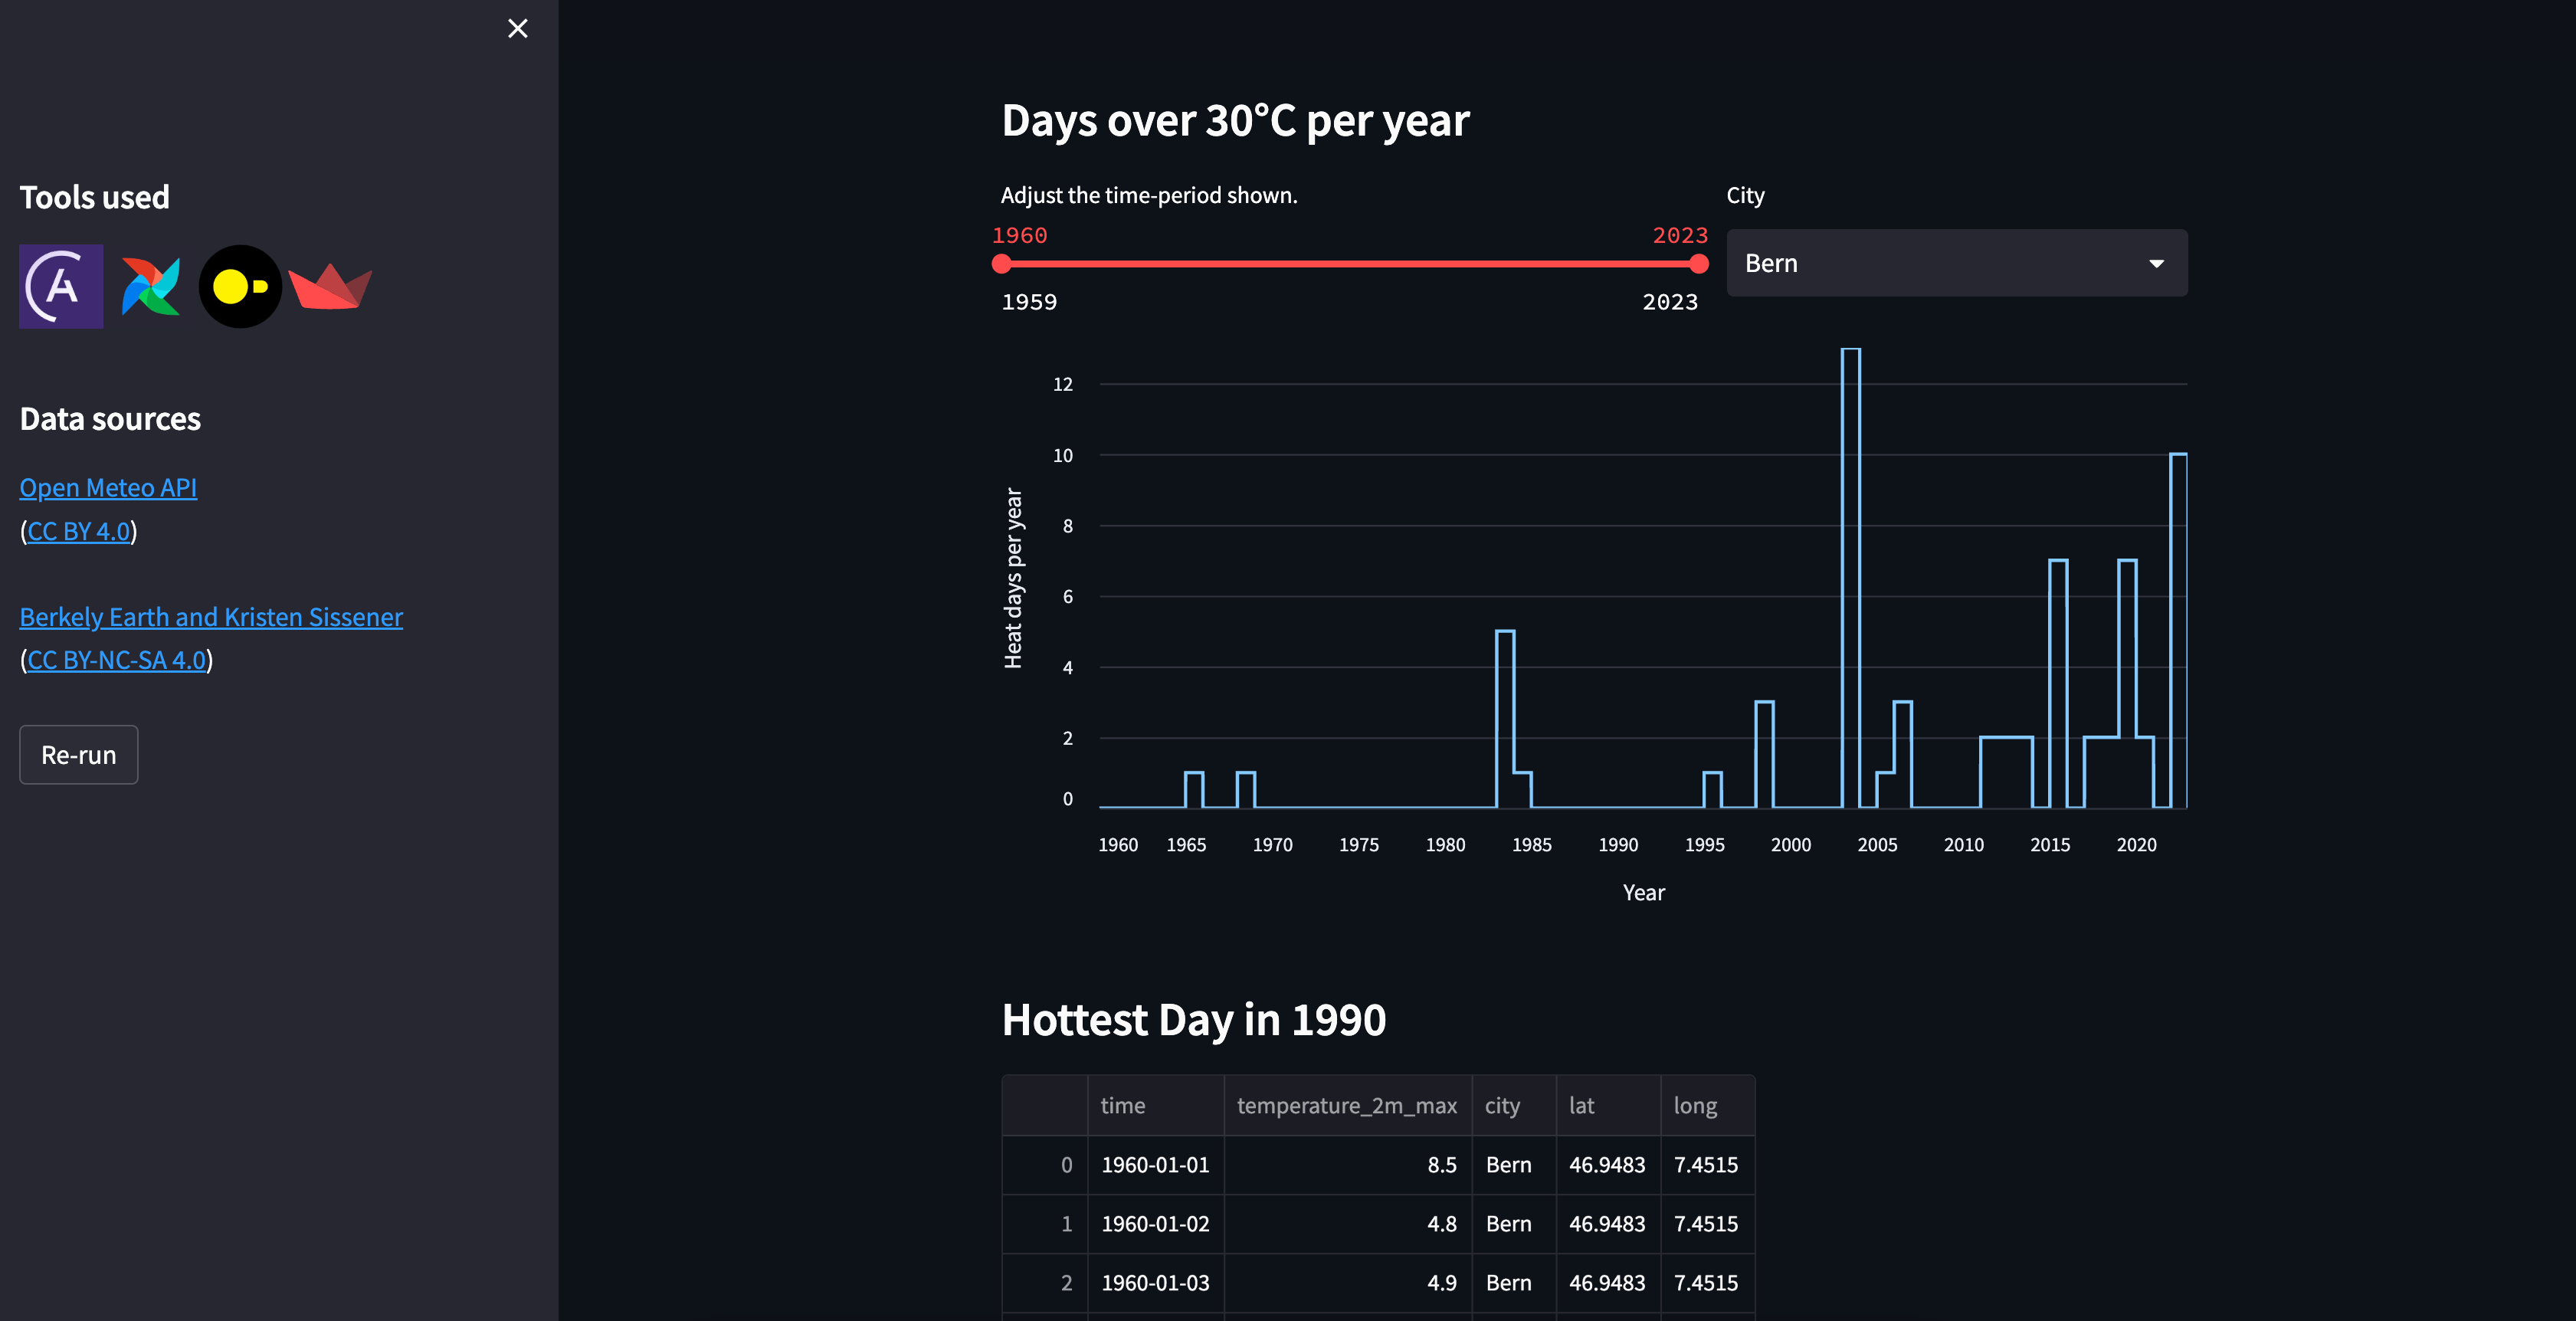
4. Trigger the `start` DAG. You should see `extract_historical_weather_data` run automatically after the `start` DAG run completes and the `transform_historical_weather` DAG run automatically after `extract_historical_weather_data`. Once all DAGs have run, view your Streamlit app to view a graph with hot days per year and a table containing historical weather data.
## Step 3: Update the pipelines
The two DAGs tagged with `part_2` are part of a partially built Airflow pipeline that handles historical weather data. Complete the following steps to finish building the pipeline.
#### Use Airflow Datasets for data-aware scheduling
Datasets allow you to schedule DAGs on the completion of tasks that create or update data assets in your pipelines. Instead of using time-based scheduling, you'll use Datasets to make:
* `extract_historical_weather_data` run after completion of a task with an outlet Dataset in the `start` DAG.
* `transform_historical_weather` run after completion of a task with an outlet Dataset in the `extract_historical_weather_data` DAG.
1. In `include/global_variables/user_input_variables.py`, enter your own info for `HOT_DAY` and `BIRTHYEAR` if you want.
2. Schedule the `extract_historical_weather_data` DAG on the `start_dataset` Dataset defined in the `start` DAG.
```text wrap theme={null}
schedule=[start_dataset],
```
3. Schedule the `transform_historical_weather` DAG on the `extract_dataset` outlet Dataset of the `turn_json_into_table` task, which you will find in the `extract_historical_weather_data` DAG. As in the previous case, the latter DAG's schedule is currently set to `None`, and this is the DAG parameter you need to modify.
```text wrap theme={null}
schedule=[Dataset("duckdb://include/dwh/historical_weather_data")],
```
For more help with using Datasets, see: [Datasets and data-aware scheduling in Airflow](/docs/learn/airflow-datasets).
4. Trigger the `start` DAG. You should see `extract_historical_weather_data` run automatically after the `start` DAG run completes and the `transform_historical_weather` DAG run automatically after `extract_historical_weather_data`. Once all DAGs have run, view your Streamlit app to view a graph with hot days per year and a table containing historical weather data.
 #### Add dynamic task mapping for automated generation of parallel tasks
The tasks in the `extract_historical_weather_data` currently retrieve historical weather information for only one city. To retrieve information about three cities instead of just one, you can use dynamic task mapping. The dynamic task mapping feature of Airflow, based on the [MapReduce](https://en.wikipedia.org/wiki/MapReduce) programming model, automatically generates parallel individual tasks for an arbitrary number of inputs. Compared to static code, this approach offers the benefit of atomicity, improved observability, easier recovery from failures, and easier implementation.
You can find more information about dynamic task mapping in [Create dynamic Airflow tasks](/docs/learn/dynamic-tasks).
Instead of manually creating a task for each additional city, you'll use an `expand()` function to map any number of cities in the following tasks:
* the `get_lat_long_for_city` task in the `extract_historical_weather_data` DAG.
* the `get_historical_weather` task, also in `extract_historical_weather_data`.
1. Find the `coordinates` variable definition (just above the `turn_json_into_table` task definition). This line instantiates the first task you need to map: `get_lat_long_for_city`.
2. Map the task using an `expand()` and replace the single city with a list of cities. **Note**: each item must be a city!
```text wrap theme={null}
coordinates = get_lat_long_for_city.expand(city=["Bern", "Basel", "Zurich"])
```
3. Find the `historical_weather` variable definition (just below the `coordinates` definition). This line instantiates the second task you need to map: `get_historical_weather`.
4. Map the task using `expand()`.
```text wrap theme={null}
historical_weather = get_historical_weather.expand(coordinates=coordinates)
```
For more guidance on implementing dynamic task mapping, see [Create dynamic Airflow tasks](/docs/learn/dynamic-tasks).
5. After completing the exercise, rerun both `extract_historical_weather_data` and `transform_historical_weather`.
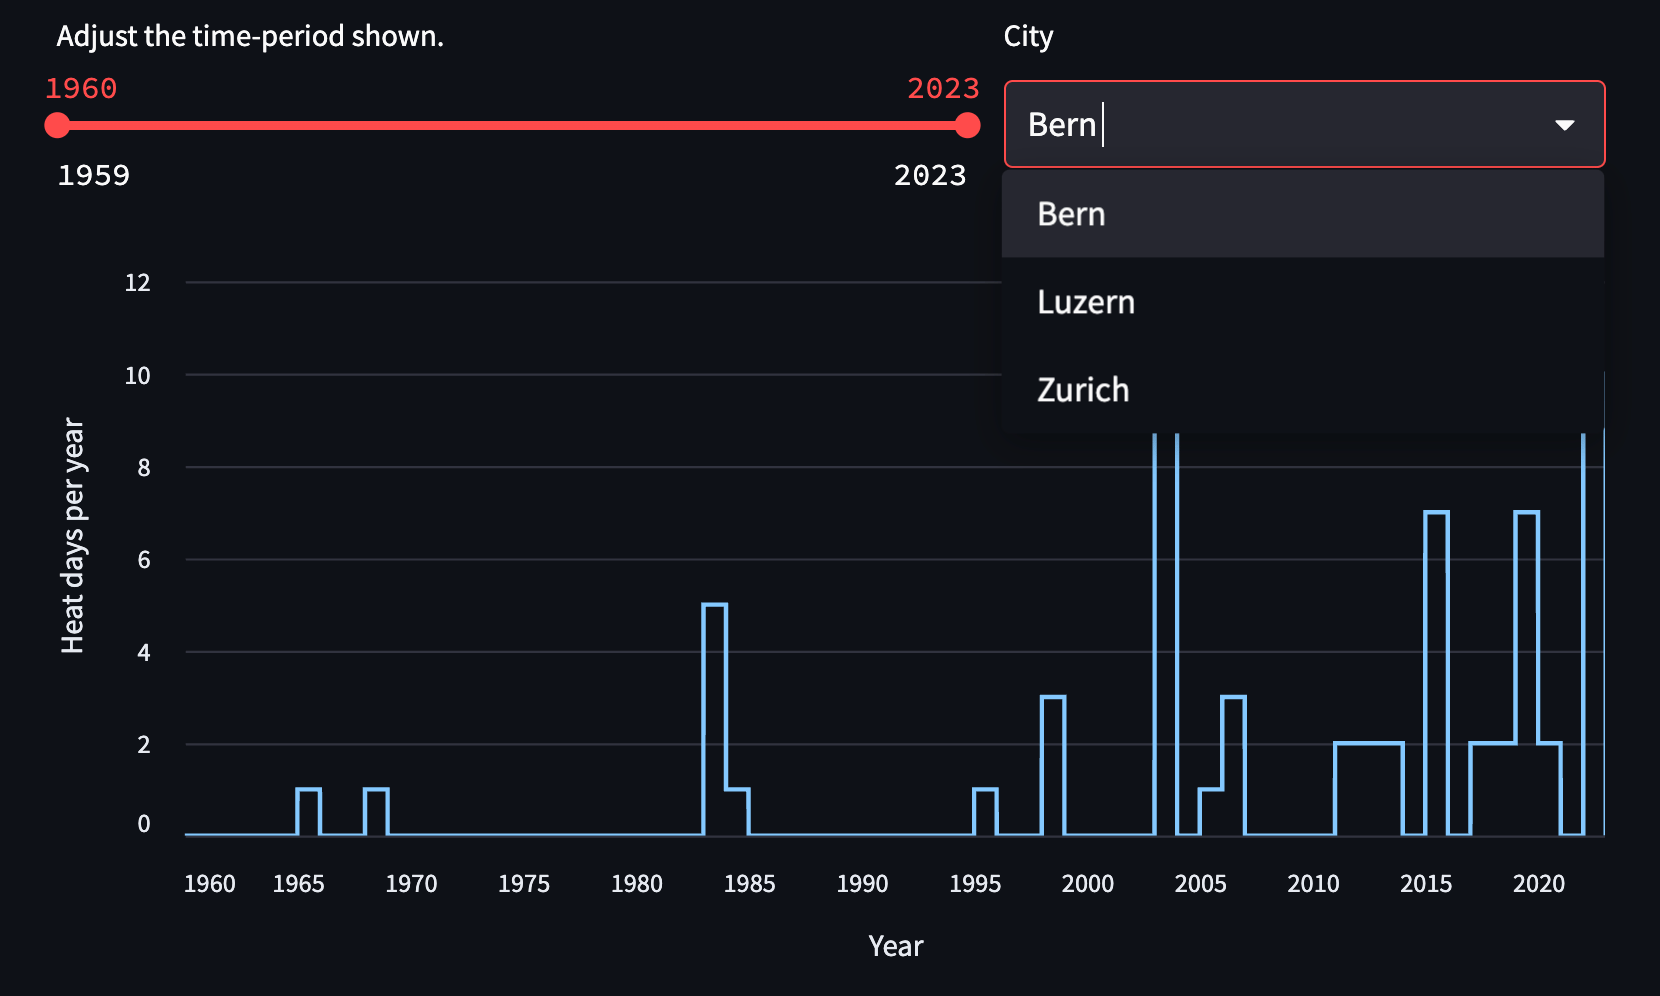
In your Streamlit app, you can now select the different cities from the dropdown box to see how many hot days they had per year.
#### Add dynamic task mapping for automated generation of parallel tasks
The tasks in the `extract_historical_weather_data` currently retrieve historical weather information for only one city. To retrieve information about three cities instead of just one, you can use dynamic task mapping. The dynamic task mapping feature of Airflow, based on the [MapReduce](https://en.wikipedia.org/wiki/MapReduce) programming model, automatically generates parallel individual tasks for an arbitrary number of inputs. Compared to static code, this approach offers the benefit of atomicity, improved observability, easier recovery from failures, and easier implementation.
You can find more information about dynamic task mapping in [Create dynamic Airflow tasks](/docs/learn/dynamic-tasks).
Instead of manually creating a task for each additional city, you'll use an `expand()` function to map any number of cities in the following tasks:
* the `get_lat_long_for_city` task in the `extract_historical_weather_data` DAG.
* the `get_historical_weather` task, also in `extract_historical_weather_data`.
1. Find the `coordinates` variable definition (just above the `turn_json_into_table` task definition). This line instantiates the first task you need to map: `get_lat_long_for_city`.
2. Map the task using an `expand()` and replace the single city with a list of cities. **Note**: each item must be a city!
```text wrap theme={null}
coordinates = get_lat_long_for_city.expand(city=["Bern", "Basel", "Zurich"])
```
3. Find the `historical_weather` variable definition (just below the `coordinates` definition). This line instantiates the second task you need to map: `get_historical_weather`.
4. Map the task using `expand()`.
```text wrap theme={null}
historical_weather = get_historical_weather.expand(coordinates=coordinates)
```
For more guidance on implementing dynamic task mapping, see [Create dynamic Airflow tasks](/docs/learn/dynamic-tasks).
5. After completing the exercise, rerun both `extract_historical_weather_data` and `transform_historical_weather`.
In your Streamlit app, you can now select the different cities from the dropdown box to see how many hot days they had per year.
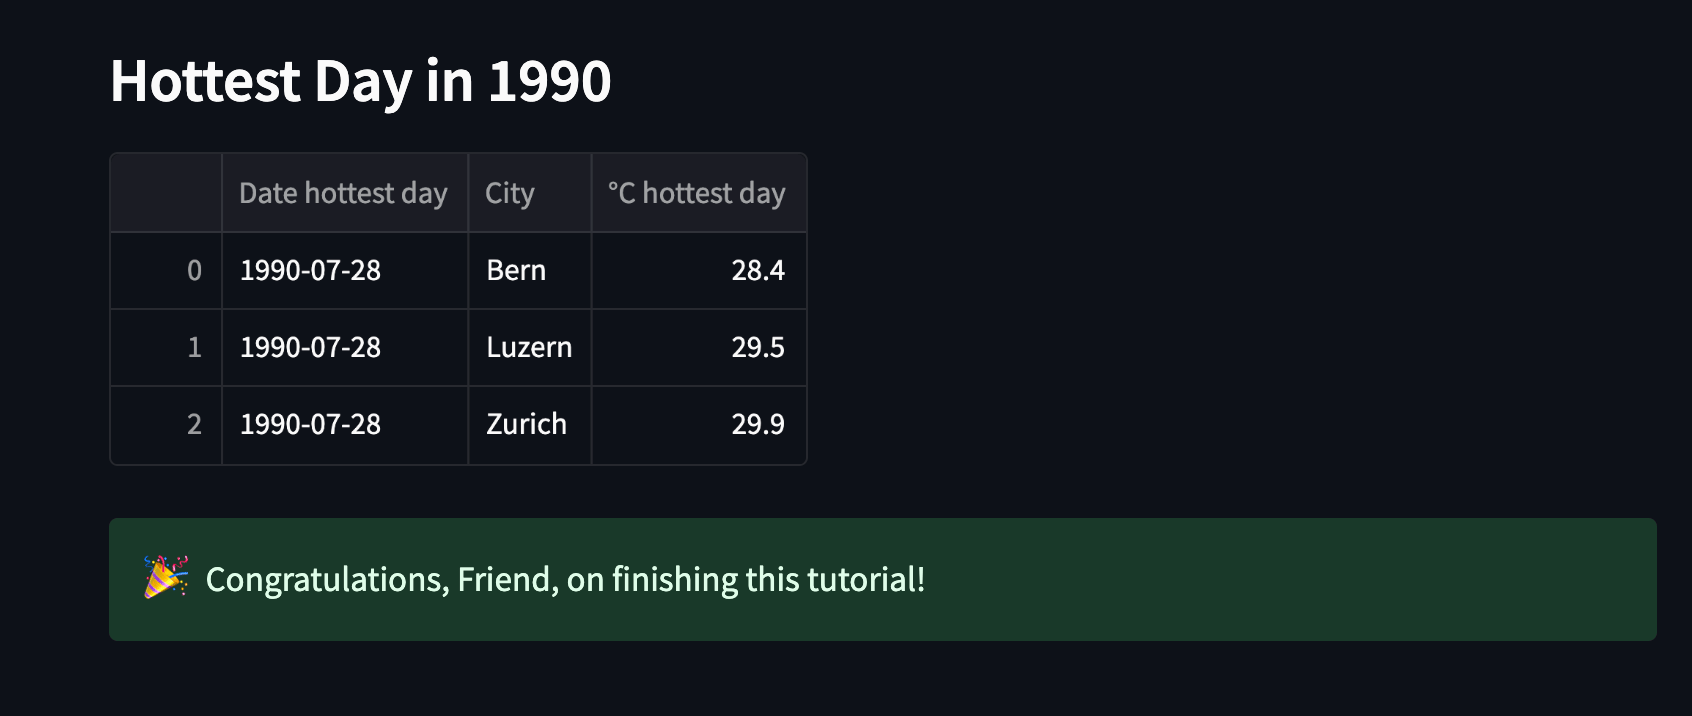
 Both the `in_table` dataframe and the `output_df` dataframe are printed to the logs of the `find_hottest_day_birthyear` task. The goal is to have an output as in the screenshot below. If your table doesn't contain information for several cities, make sure you completed the dynamic task mapping correctly.
 ## Data sources
The global climate data in the local CSV file was retrieved from the [Climate Change: Earth Surface Temperature Data Kaggle dataset](https://www.kaggle.com/datasets/berkeleyearth/climate-change-earth-surface-temperature-data) by Berkeley Earth and Kristen Sissener, which was uploaded under [CC BY-NC-SA 4.0](https://creativecommons.org/licenses/by-nc-sa/4.0/).
The current and historical weather data are queried from the [Open Meteo API](https://open-meteo.com/) ([CC BY 4.0](https://creativecommons.org/licenses/by/4.0)).
## Data sources
The global climate data in the local CSV file was retrieved from the [Climate Change: Earth Surface Temperature Data Kaggle dataset](https://www.kaggle.com/datasets/berkeleyearth/climate-change-earth-surface-temperature-data) by Berkeley Earth and Kristen Sissener, which was uploaded under [CC BY-NC-SA 4.0](https://creativecommons.org/licenses/by-nc-sa/4.0/).
The current and historical weather data are queried from the [Open Meteo API](https://open-meteo.com/) ([CC BY 4.0](https://creativecommons.org/licenses/by/4.0)).