> ## Documentation Index
> Fetch the complete documentation index at: https://astronomer.io/docs/llms.txt
> Use this file to discover all available pages before exploring further.
# An introduction to the Airflow UI
One of the main features of Apache Airflow is its [user interface (UI)](https://airflow.apache.org/docs/apache-airflow/stable/ui.html), which provides insights into your DAGs and DAG runs. The UI is essential for understanding, monitoring, and troubleshooting your pipelines.
This guide is an overview of some of the most useful features and visualizations in the Airflow UI. If you're not already using Airflow and want to get it up and running to follow along, see [Install the Astro CLI](/docs/cli/v1.43/get-started-cli) to quickly run Airflow locally.
All images in this guide were taken from an [Astronomer Runtime](/docs/runtime/runtime-release-notes) Airflow image. Other than some modified colors and an additional **Astronomer** tab, the UI is the same as when using OSS Airflow. The images in this guide are from Airflow version 2.10. If you are using an older version of Airflow, some UI elements might be slightly different or missing.
**Other ways to learn**
There are multiple resources for learning about this topic. See also:
* Astronomer Academy: [Airflow: UI](https://academy.astronomer.io/path/airflow-101/astro-runtime-airflow-ui) module.
* Webinar: [A Deep Dive into the Airflow UI](https://www.astronomer.io/events/webinars/a-deep-dive-into-the-airflow-ui/).
## Assumed knowledge
To get the most out of this guide, you should have an understanding of:
* Basic Airflow concepts. See [Introduction to Apache Airflow](/docs/learn/2.x/intro-to-airflow).
* Airflow DAGs. See [Introduction to Airflow DAGs](/docs/learn/2.x/dags).
## DAGs
The **DAGs** view is the landing page when you sign in to Airflow. It shows a list of all your DAGs, the status of recent DAG runs and tasks, the time of the last DAG run, and basic metadata about the DAG like the owner and the schedule. To see the status of the DAGs update in real time, toggle **Auto-refresh**.
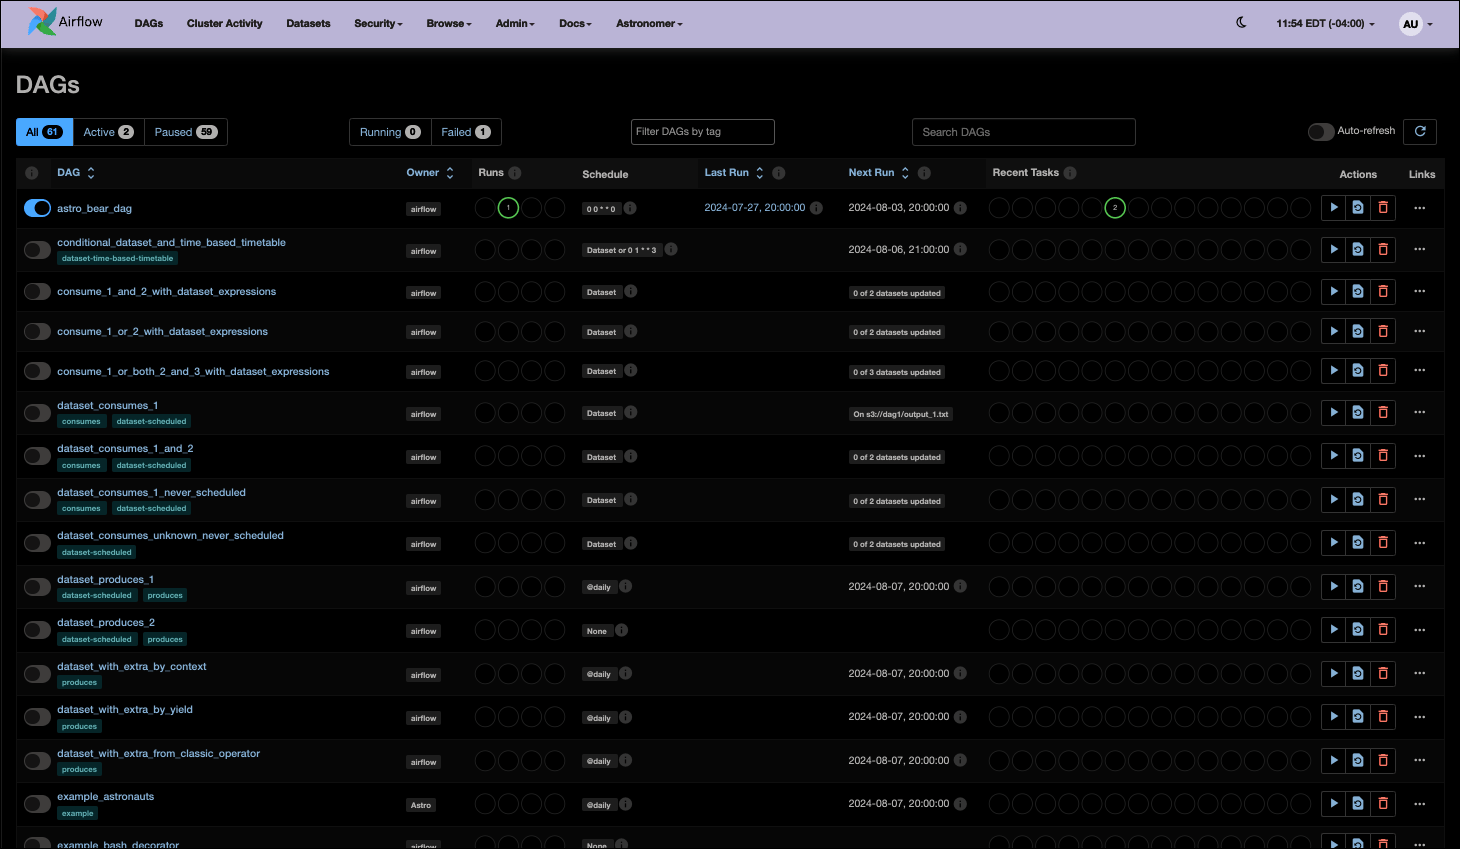 In the DAGs view you can:
* Pause/unpause a DAG with the toggle to the left of the DAG name.
* Reparse a DAG without waiting for Airflow to refresh automatically.
* Filter the list of DAGs to show active, paused, or all DAGs.
* Filter the list of DAGs to show currently running DAGs or DAGs that failed their last DAG run.
* Trigger or delete a DAG with the buttons in the **Actions** section.
* Navigate quickly to other DAG-specific views from the **Links** section.
To see more information about a specific DAG, click its name or use one of the links.
## Individual DAG view
The **DAG** view gives you detailed insights into a specific DAG, including its DAG runs and task instances.
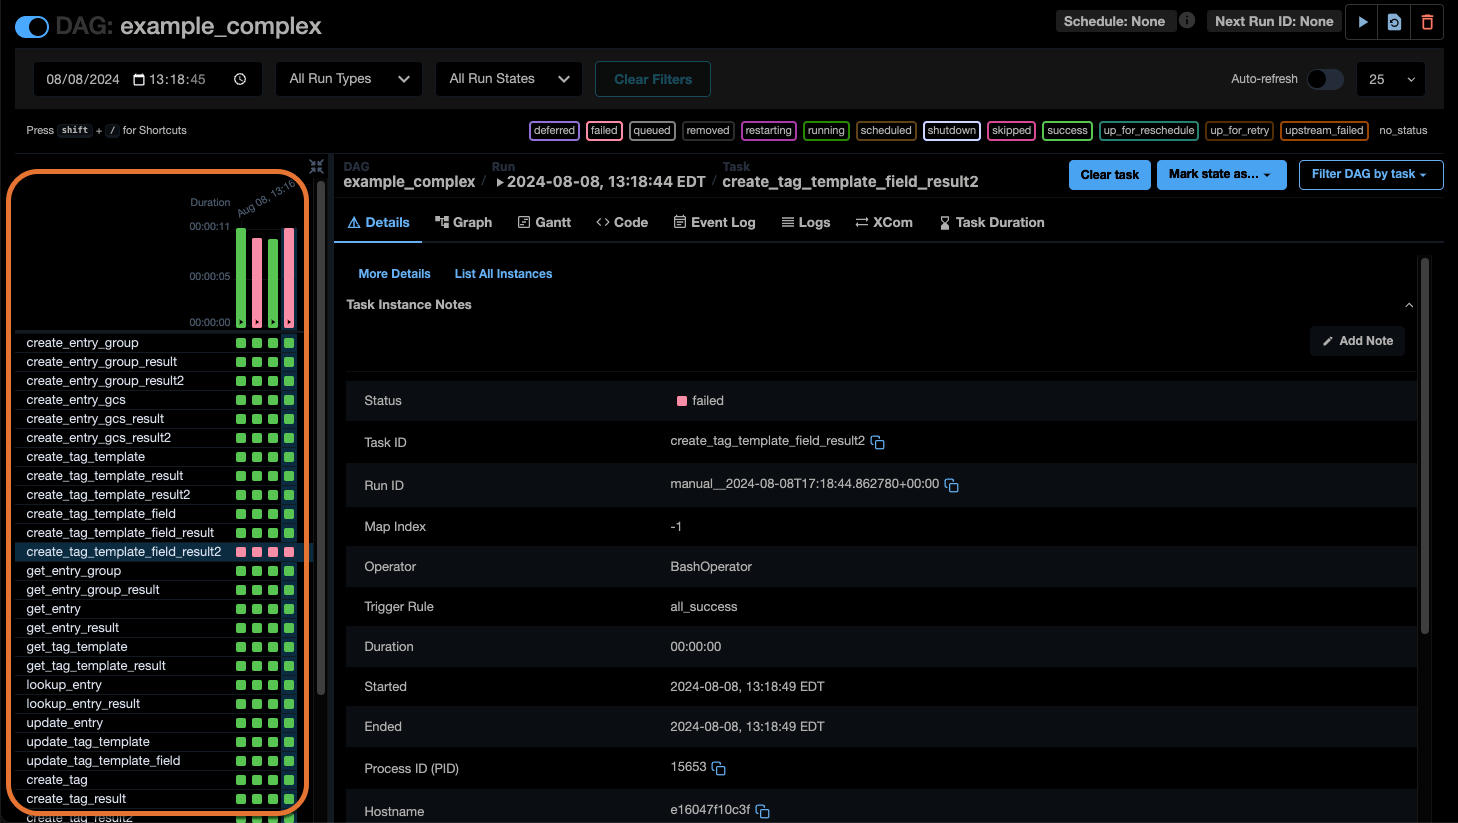
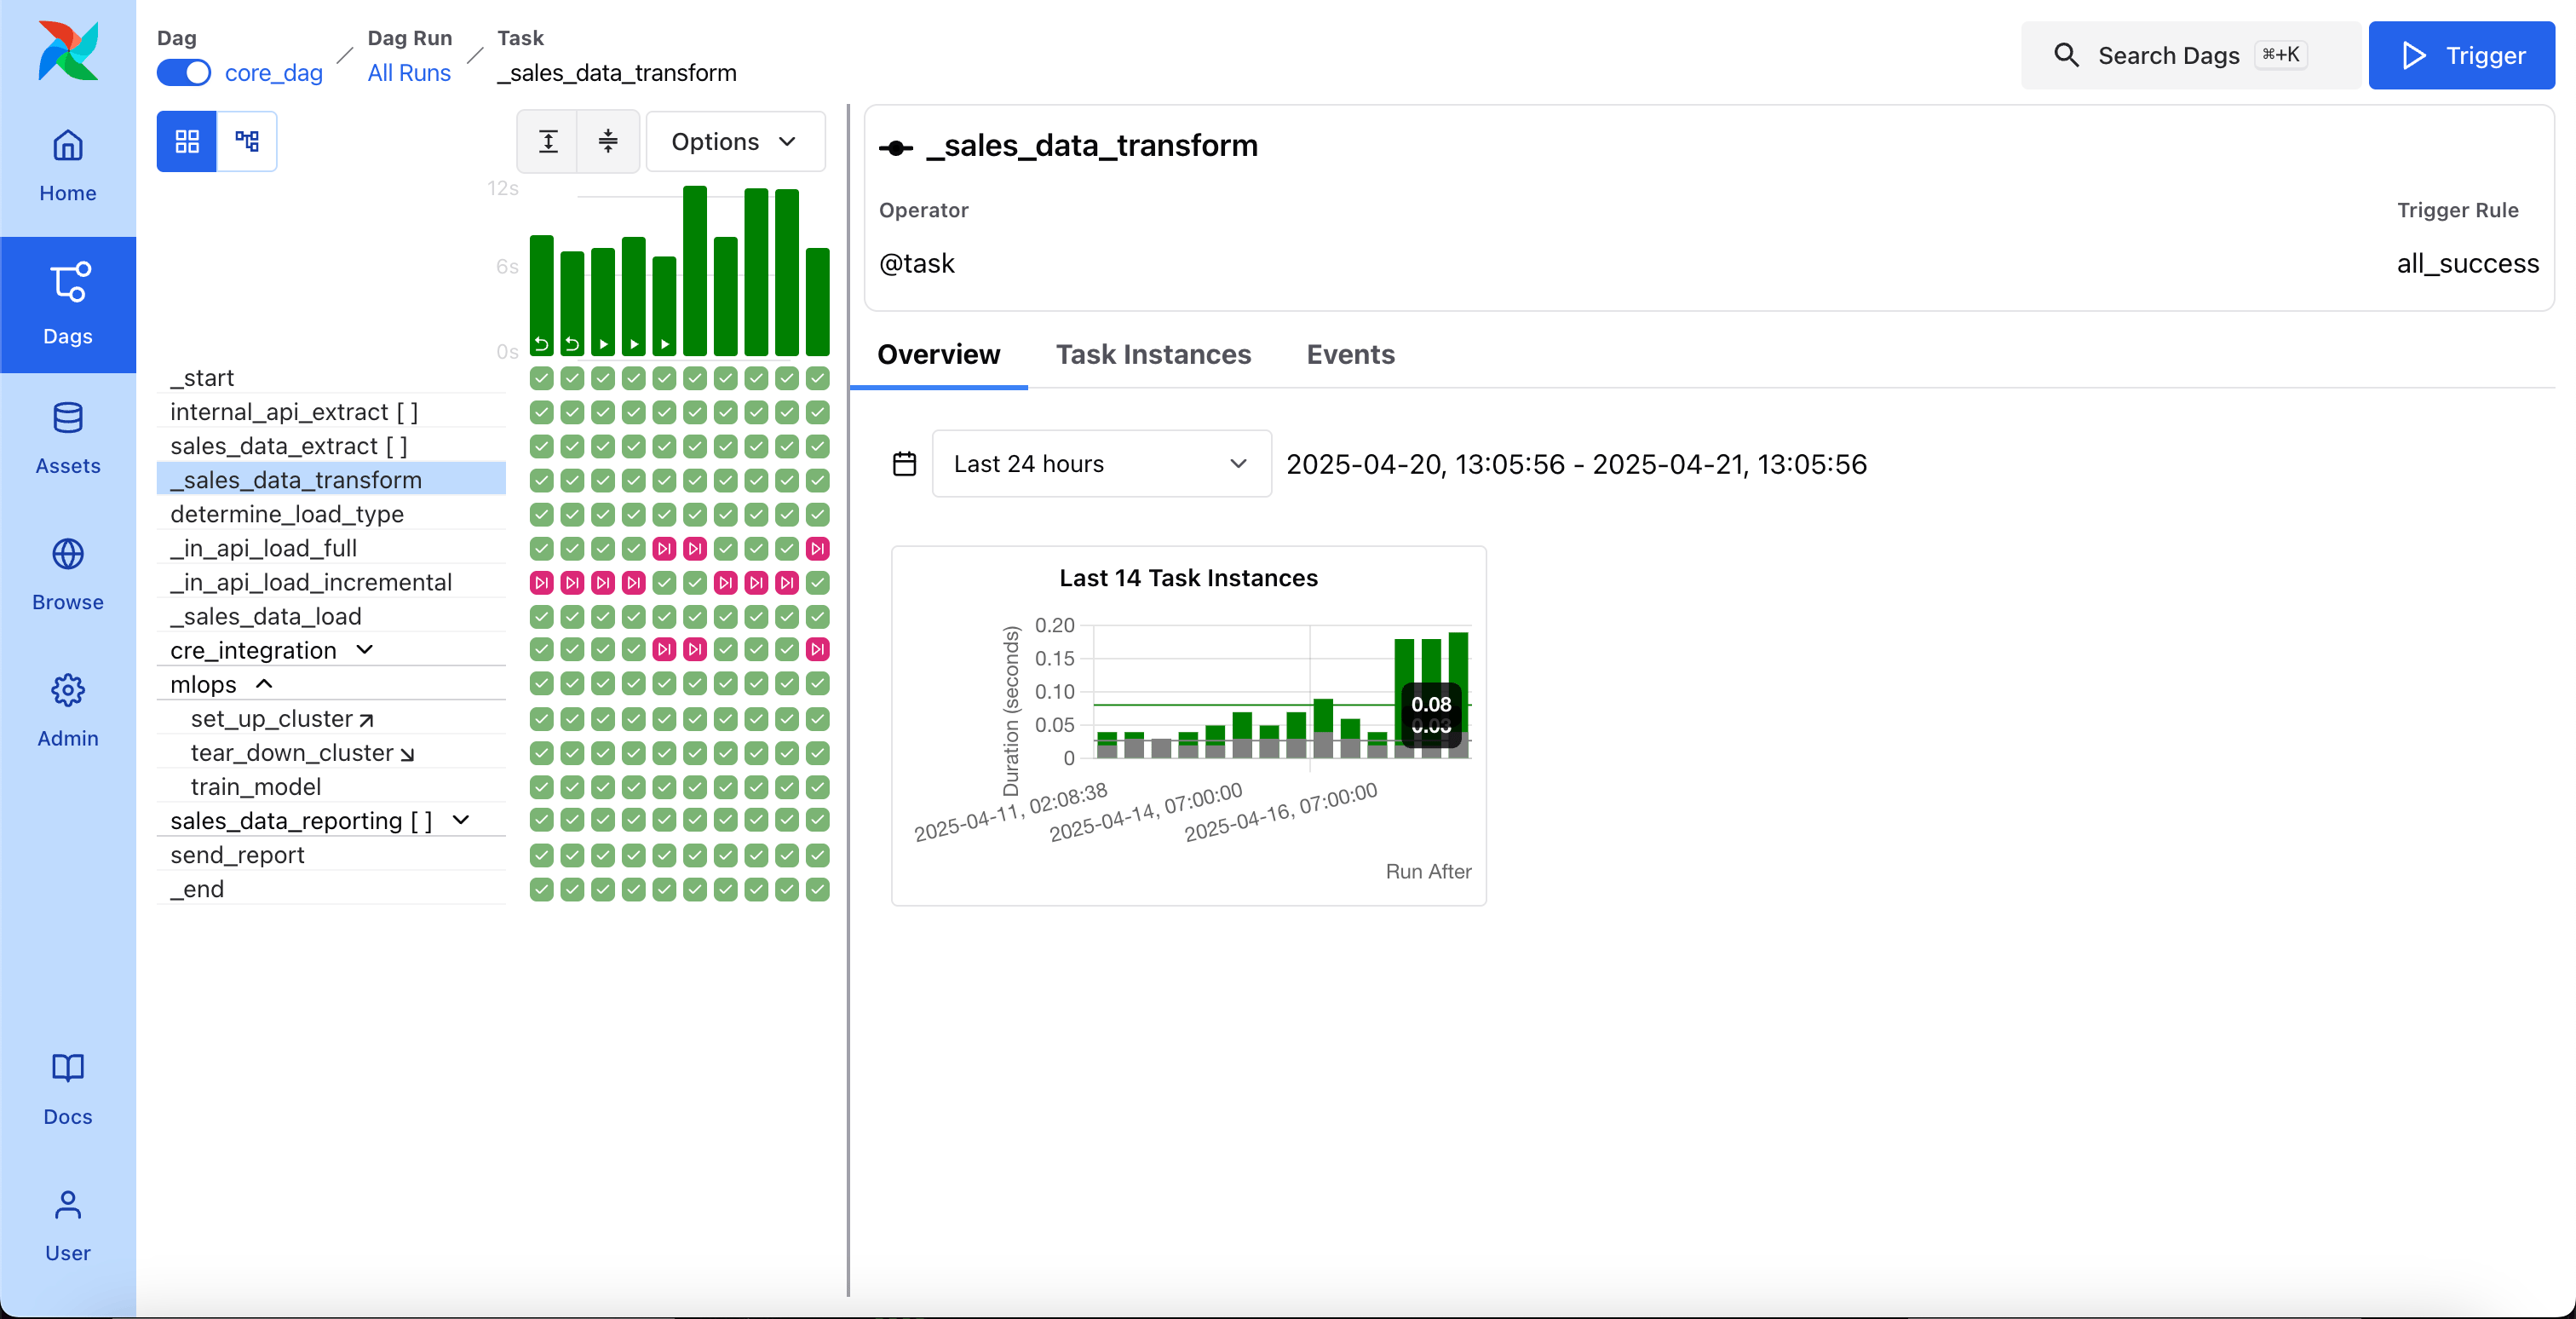
On the left side you can see a grid representation of the DAG's previous runs, including their duration and the outcome of all individual task instances. Each column represents a DAG run, and each square represents a task instance in that DAG run. Task instances are color-coded according to their status. A small play icon on a DAG run indicates that a run was triggered manually, and a small dataset icon shows that a run was triggered by a [dataset update](https://astronomer.io/guides/airflow-datasets). If no icon is shown, the DAG ran according to its schedule.
In the DAGs view you can:
* Pause/unpause a DAG with the toggle to the left of the DAG name.
* Reparse a DAG without waiting for Airflow to refresh automatically.
* Filter the list of DAGs to show active, paused, or all DAGs.
* Filter the list of DAGs to show currently running DAGs or DAGs that failed their last DAG run.
* Trigger or delete a DAG with the buttons in the **Actions** section.
* Navigate quickly to other DAG-specific views from the **Links** section.
To see more information about a specific DAG, click its name or use one of the links.
## Individual DAG view
The **DAG** view gives you detailed insights into a specific DAG, including its DAG runs and task instances.
On the left side you can see a grid representation of the DAG's previous runs, including their duration and the outcome of all individual task instances. Each column represents a DAG run, and each square represents a task instance in that DAG run. Task instances are color-coded according to their status. A small play icon on a DAG run indicates that a run was triggered manually, and a small dataset icon shows that a run was triggered by a [dataset update](https://astronomer.io/guides/airflow-datasets). If no icon is shown, the DAG ran according to its schedule.
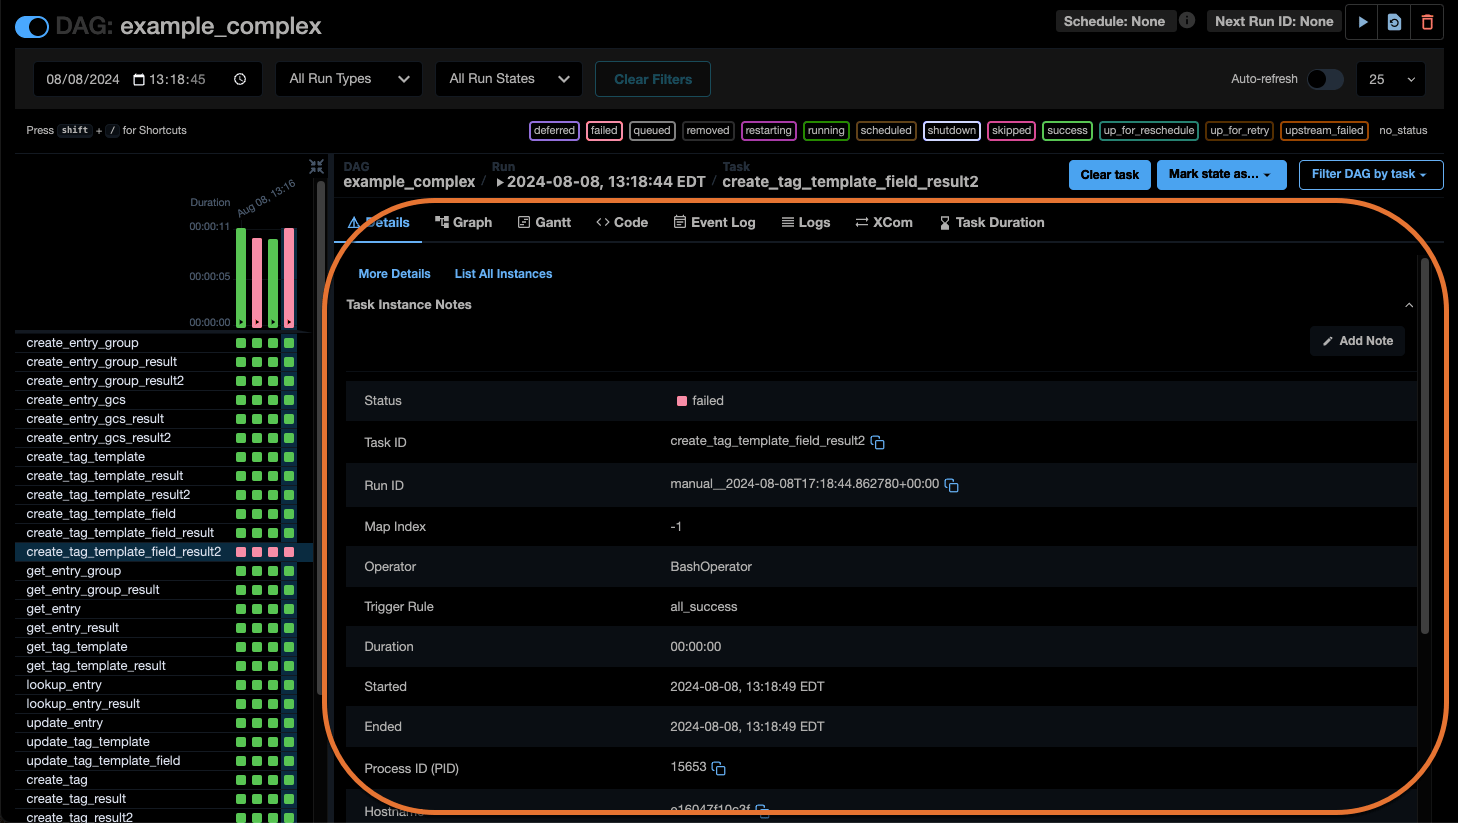
 On the right side you can see further details about the item (DAG, DAG run or task instance) that is currently selected.
 When a DAG run, task instance, or [task group](/docs/learn/2.x/task-groups) instance is selected in the DAG grid, several action buttons appear:
 * **Clear** / **Clear task** : This button will clear the selected DAG run, task group instance, or task instance and run it again. This is useful if you want to re-run a task or DAG run that has failed or during local development. After clicking **Clear task**, Airflow offers a detailed interface controlling which task instances should be cleared and rerun. See [Manually rerun tasks or DAGs](/docs/learn/2.x/rerunning-dags#manually-rerun-tasks-or-dags).
* **Mark state as...**: This button allows you to mark the selected DAG run, task group instance or task instance as successful or failed without running it. This option is often useful when the root cause of a task failure was fixed manually in the external data tool and there's no need to rerun the task. Many data teams use [Task Instance Notes and DAG Run Notes](/docs/learn/2.x/rerunning-dags#add-notes-to-cleared-tasks-and-dags) in order to document the reason for marking a task instance as failed or successful.
* **Filter DAG by task**: This button allows you to filter the tasks shown in the DAG grid and DAG graph based on task dependencies. For example, when you select **Filter downstream**, the UI shows only the tasks downstream of your selected task.
* **Clear** / **Clear task** : This button will clear the selected DAG run, task group instance, or task instance and run it again. This is useful if you want to re-run a task or DAG run that has failed or during local development. After clicking **Clear task**, Airflow offers a detailed interface controlling which task instances should be cleared and rerun. See [Manually rerun tasks or DAGs](/docs/learn/2.x/rerunning-dags#manually-rerun-tasks-or-dags).
* **Mark state as...**: This button allows you to mark the selected DAG run, task group instance or task instance as successful or failed without running it. This option is often useful when the root cause of a task failure was fixed manually in the external data tool and there's no need to rerun the task. Many data teams use [Task Instance Notes and DAG Run Notes](/docs/learn/2.x/rerunning-dags#add-notes-to-cleared-tasks-and-dags) in order to document the reason for marking a task instance as failed or successful.
* **Filter DAG by task**: This button allows you to filter the tasks shown in the DAG grid and DAG graph based on task dependencies. For example, when you select **Filter downstream**, the UI shows only the tasks downstream of your selected task.
 There are several tabs available within the **DAG** view:
* **Details**: Shows more details about the DAG, DAG run or task instance.
* **Graph**: Shows a graph representation of the DAG or DAG run.
* **Gantt**: Shows the duration of each task instance in a DAG run as a Gantt chart.
* **Code**: Shows the DAG code.
* **Audit Logs**: Shows the audit logs of the DAG, DAG run or task instance.
* **Run Duration**: (only available when the DAG itself is selected) Shows the duration of each DAG run over time.
* **Calendar**: (only available when the DAG itself is selected) Shows the state of DAG runs overlaid on a calendar.
* **Logs**: (only available when a task instance is selected) Shows the logs of a task instance.
* **XCom**: (only available when a task instance is selected) Shows the XComs pushed by a task instance.
* **Task Duration**: (only available when a task instance is selected) Shows the duration of task instances of a task over time.
In Airflow 2.7 and later, the DAG view includes keyboard shortcuts. You can see all available shortcuts by pressing `shift` + `/` while in the DAG view.
### Details
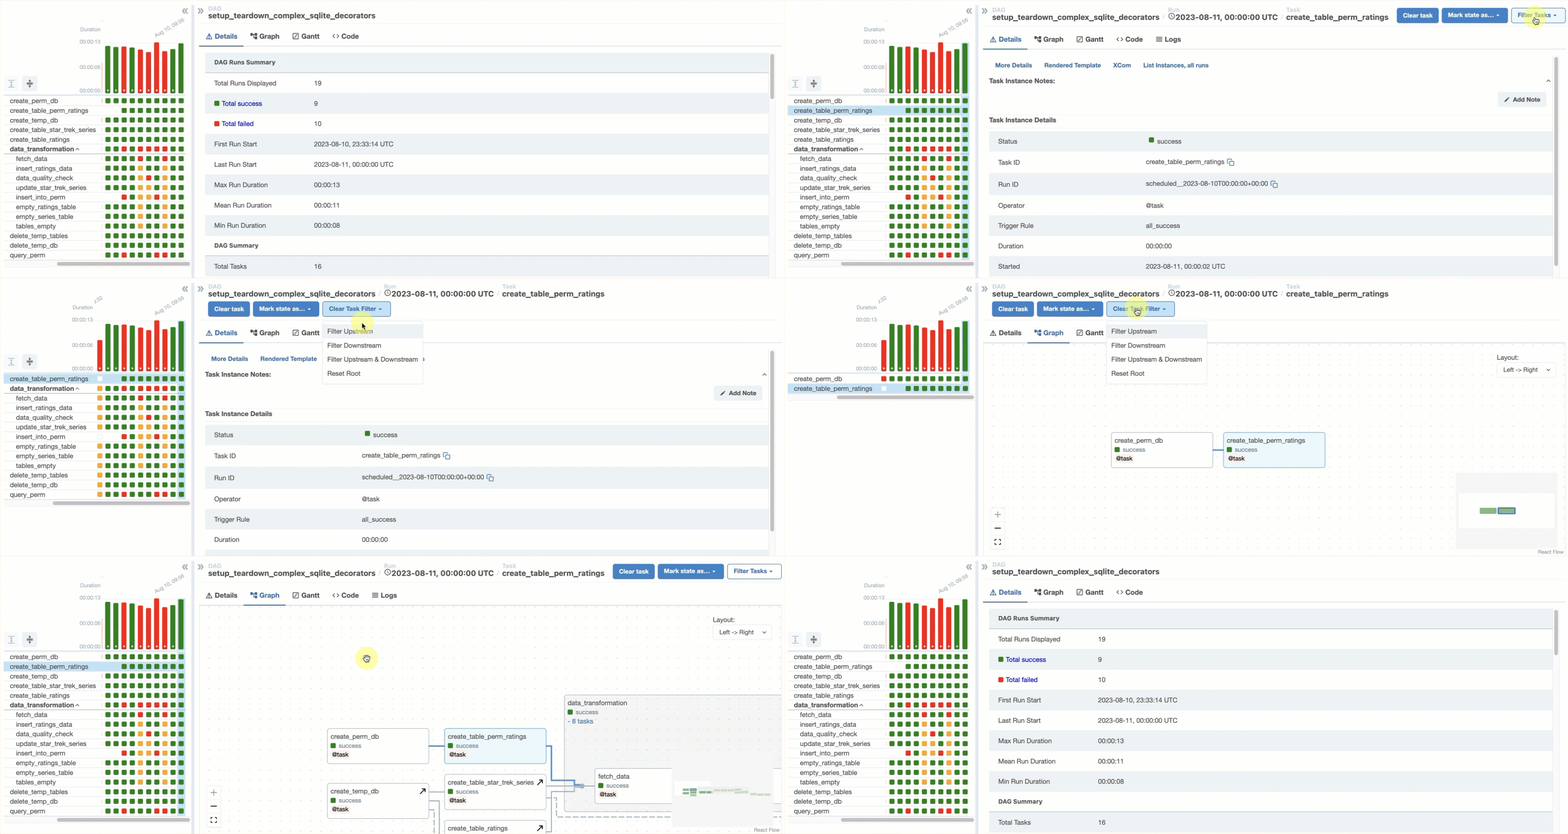
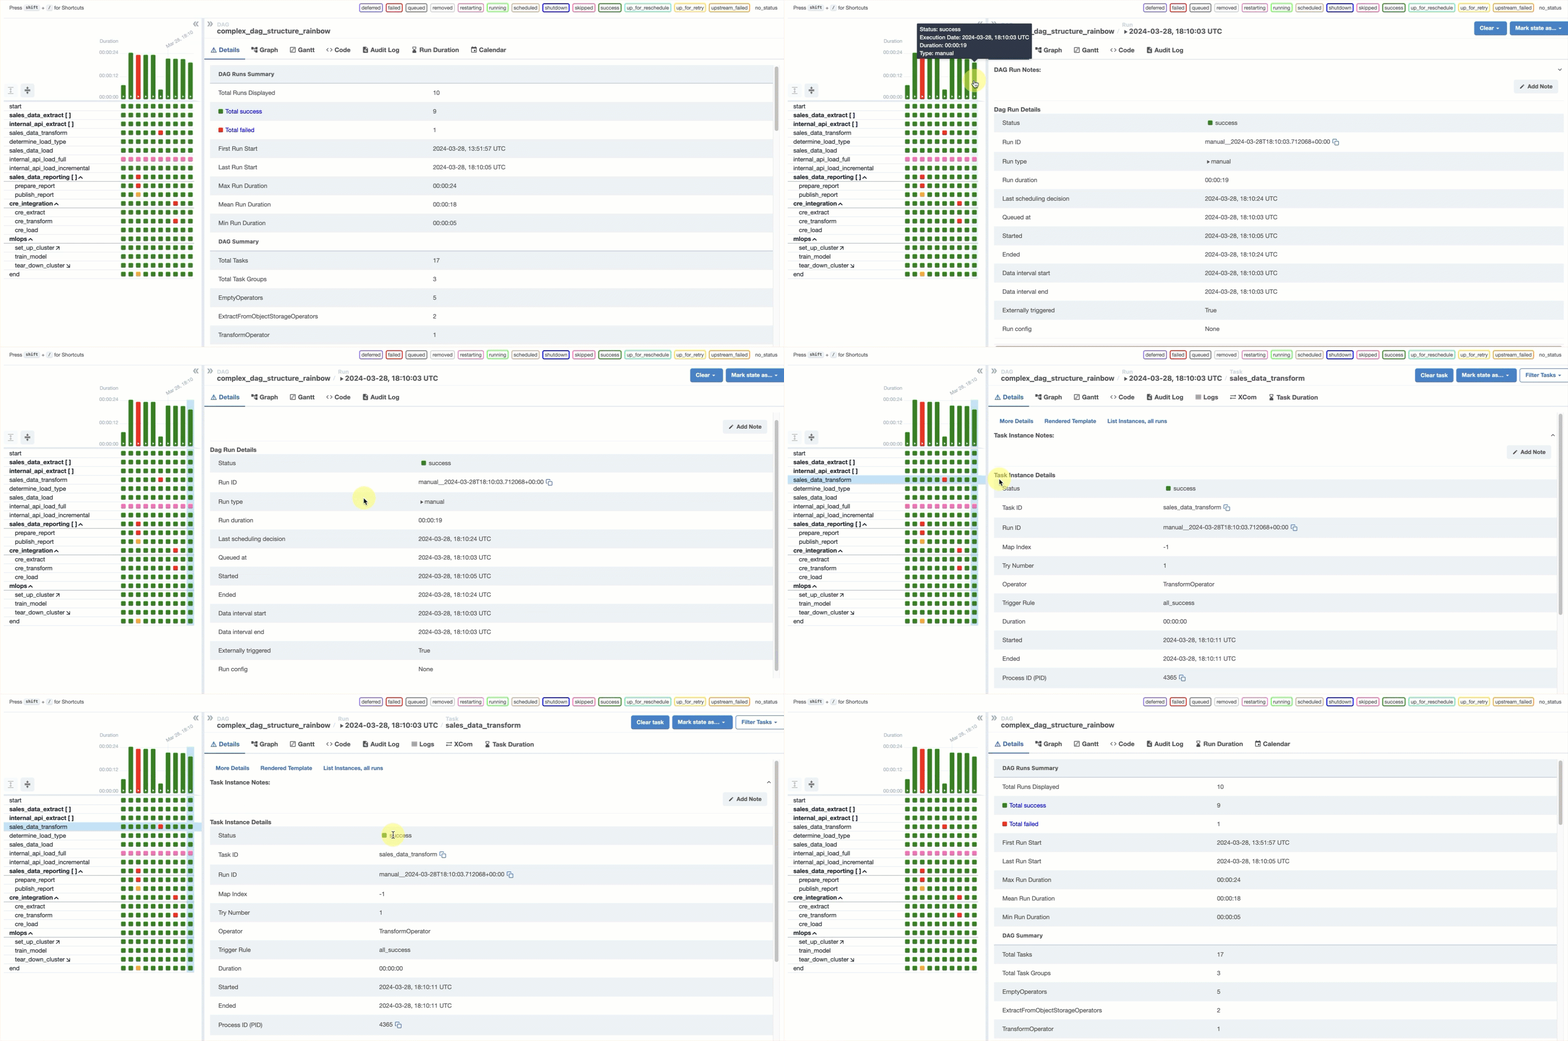
The **Details** tab displays information about the DAG, individual DAG runs, and in-depth information about each task instance. Here you can find information like total historic runs of a DAG, the data interval start of a DAG run, and the duration of a task instance.
To access the details of a specific DAG run or task instance, you first need to select it in the DAG grid as shown in the following gif:
There are several tabs available within the **DAG** view:
* **Details**: Shows more details about the DAG, DAG run or task instance.
* **Graph**: Shows a graph representation of the DAG or DAG run.
* **Gantt**: Shows the duration of each task instance in a DAG run as a Gantt chart.
* **Code**: Shows the DAG code.
* **Audit Logs**: Shows the audit logs of the DAG, DAG run or task instance.
* **Run Duration**: (only available when the DAG itself is selected) Shows the duration of each DAG run over time.
* **Calendar**: (only available when the DAG itself is selected) Shows the state of DAG runs overlaid on a calendar.
* **Logs**: (only available when a task instance is selected) Shows the logs of a task instance.
* **XCom**: (only available when a task instance is selected) Shows the XComs pushed by a task instance.
* **Task Duration**: (only available when a task instance is selected) Shows the duration of task instances of a task over time.
In Airflow 2.7 and later, the DAG view includes keyboard shortcuts. You can see all available shortcuts by pressing `shift` + `/` while in the DAG view.
### Details
The **Details** tab displays information about the DAG, individual DAG runs, and in-depth information about each task instance. Here you can find information like total historic runs of a DAG, the data interval start of a DAG run, and the duration of a task instance.
To access the details of a specific DAG run or task instance, you first need to select it in the DAG grid as shown in the following gif:
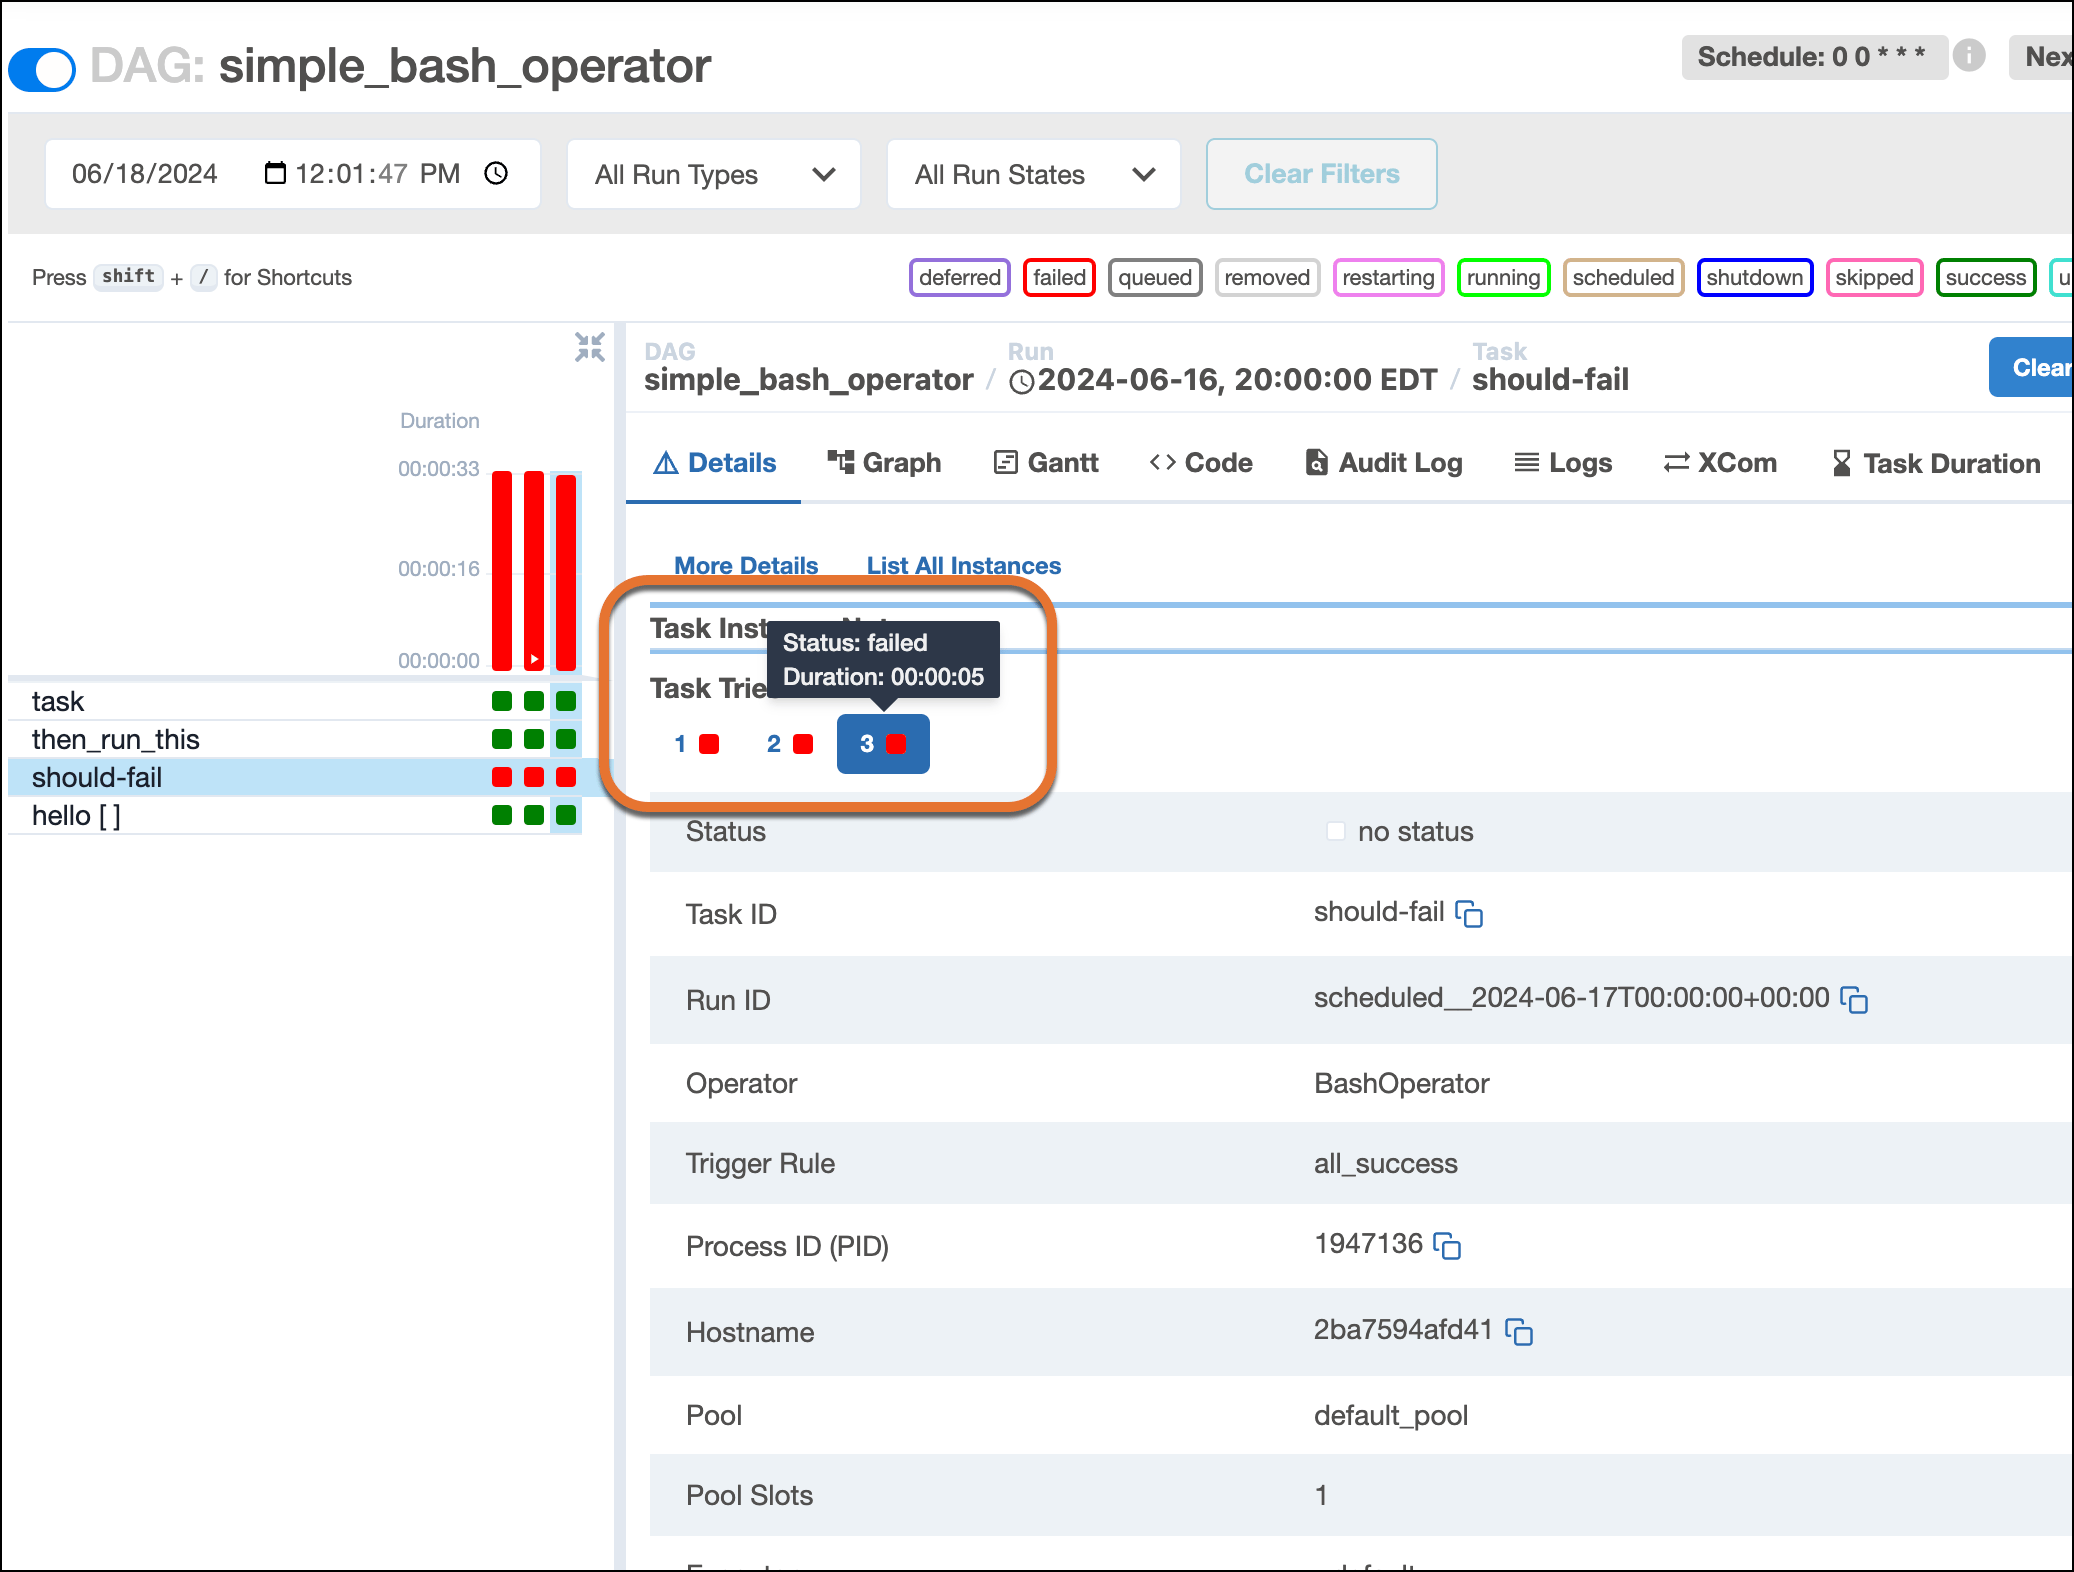
 If a task has been retried, you can also click a task try button to get details about a specific attempt:
 When you select a task instance in the DAG grid, two additional options appear underneath the tabs:
 * **More Details:** Shows all attributes of a task, including variables and templates.
* **List All Instances:** Shows a historical view of task instances and statuses for that particular task.
### Graph
The **Graph** tab shows a graph visualization of the tasks and dependencies in your DAG, including [Airflow datasets](/docs/learn/2.x/airflow-datasets) a DAG is scheduled on or updates. If you select a task or task group instance in a DAG grid column, the graph highlights and zooms to the selected task. You can also navigate complex DAGs using the **Filter Tasks** option and the minimap. This view is useful for exploring the DAG structure and task dependencies.
* **More Details:** Shows all attributes of a task, including variables and templates.
* **List All Instances:** Shows a historical view of task instances and statuses for that particular task.
### Graph
The **Graph** tab shows a graph visualization of the tasks and dependencies in your DAG, including [Airflow datasets](/docs/learn/2.x/airflow-datasets) a DAG is scheduled on or updates. If you select a task or task group instance in a DAG grid column, the graph highlights and zooms to the selected task. You can also navigate complex DAGs using the **Filter Tasks** option and the minimap. This view is useful for exploring the DAG structure and task dependencies.
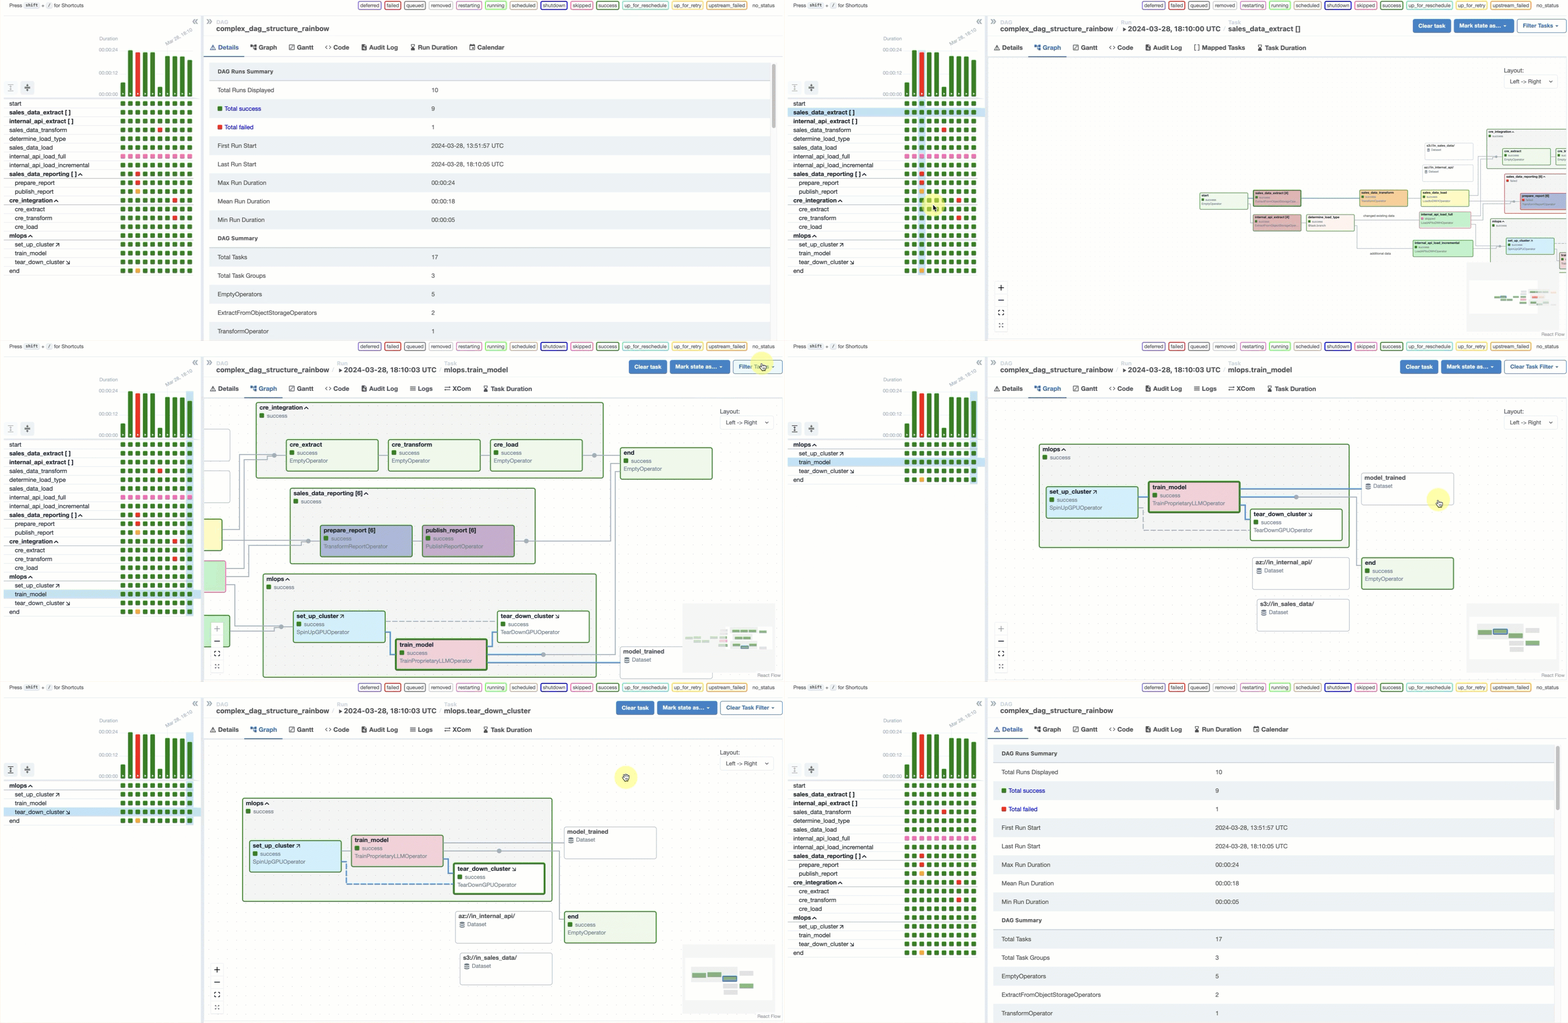 Earlier Airflow versions had a different **Graph** view that wasn't integrated into the DAG view. See the [Airflow documentation of your version](https://airflow.apache.org/docs/apache-airflow/2.6.3/ui.html#graph-view) for more information.
### Gantt Chart
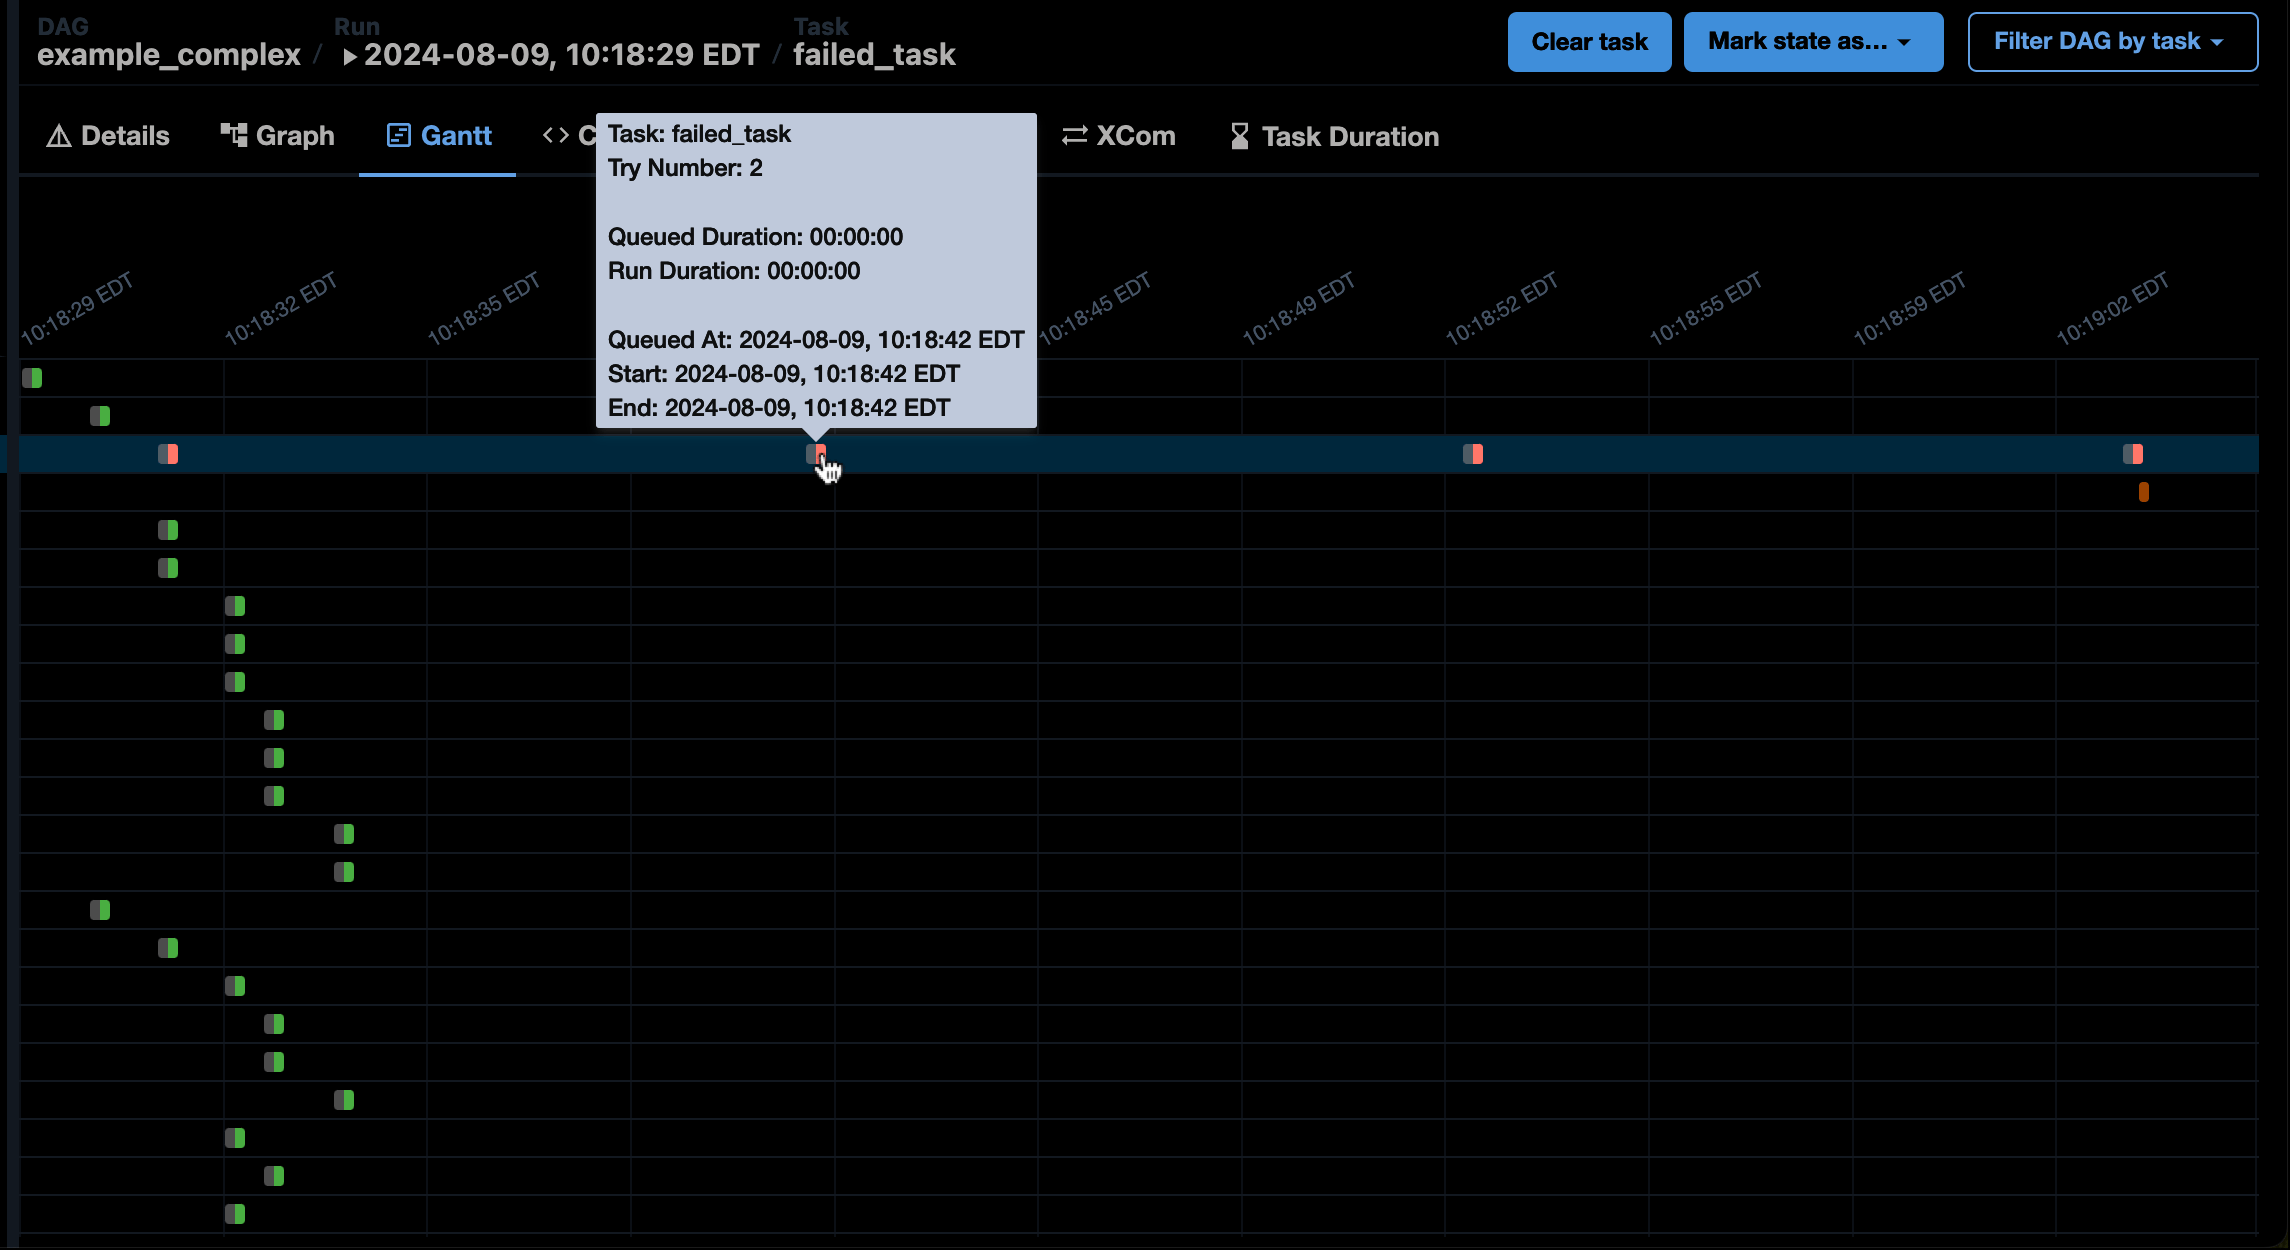
The **Gantt chart** tab visualizes task duration and overlap, so you can quickly identify bottlenecks and costly tasks.
Earlier Airflow versions had a different **Graph** view that wasn't integrated into the DAG view. See the [Airflow documentation of your version](https://airflow.apache.org/docs/apache-airflow/2.6.3/ui.html#graph-view) for more information.
### Gantt Chart
The **Gantt chart** tab visualizes task duration and overlap, so you can quickly identify bottlenecks and costly tasks.
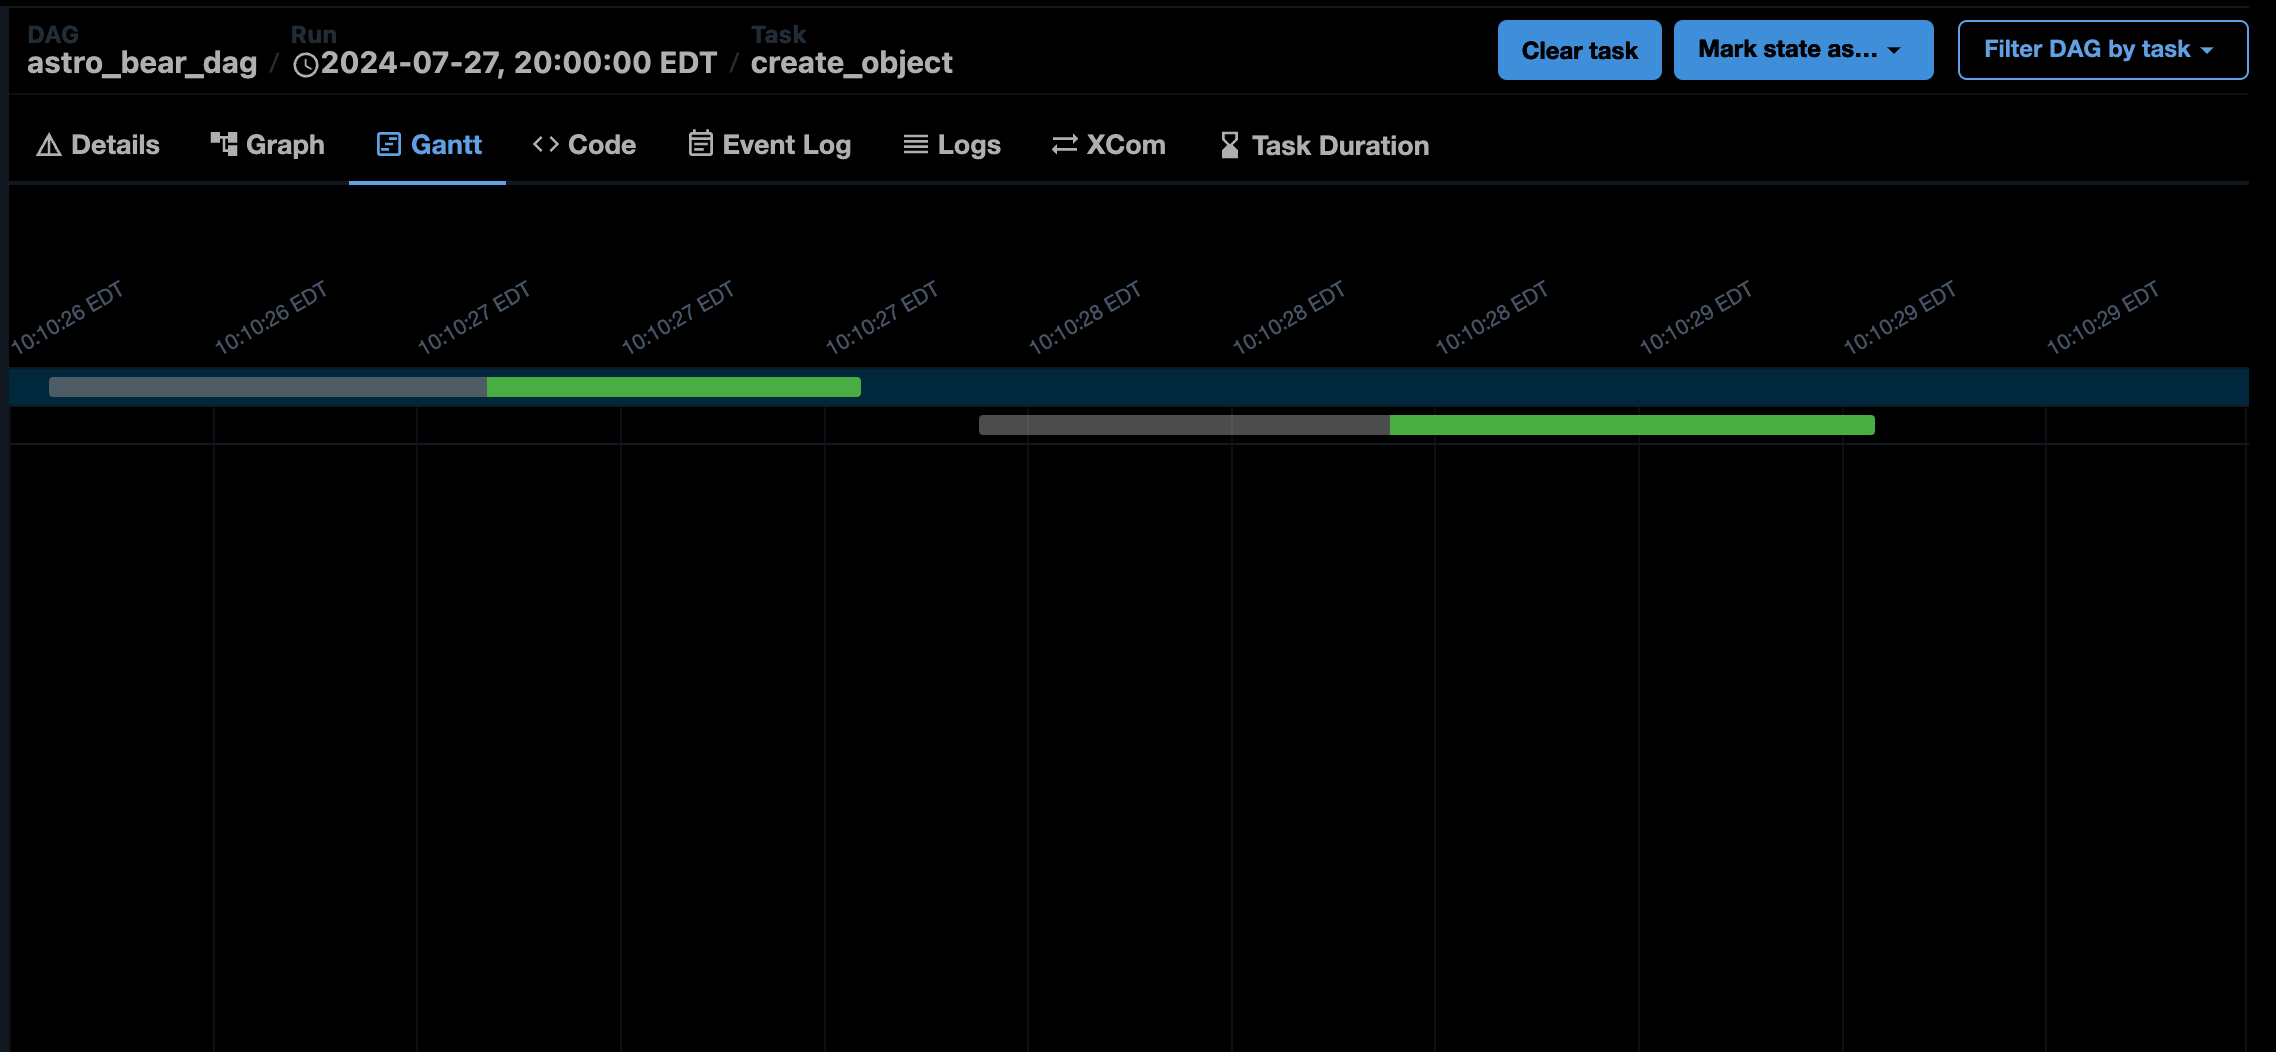 You can also find information about previous retries if a task has been retried:
 ### Code
Under the **Code** tab you can access the code that generates the DAG you are viewing. While your code should live in source control, the **Code** tab provides a quick insight into what is going on in the DAG. DAG code can't be edited in the UI.
### Code
Under the **Code** tab you can access the code that generates the DAG you are viewing. While your code should live in source control, the **Code** tab provides a quick insight into what is going on in the DAG. DAG code can't be edited in the UI.
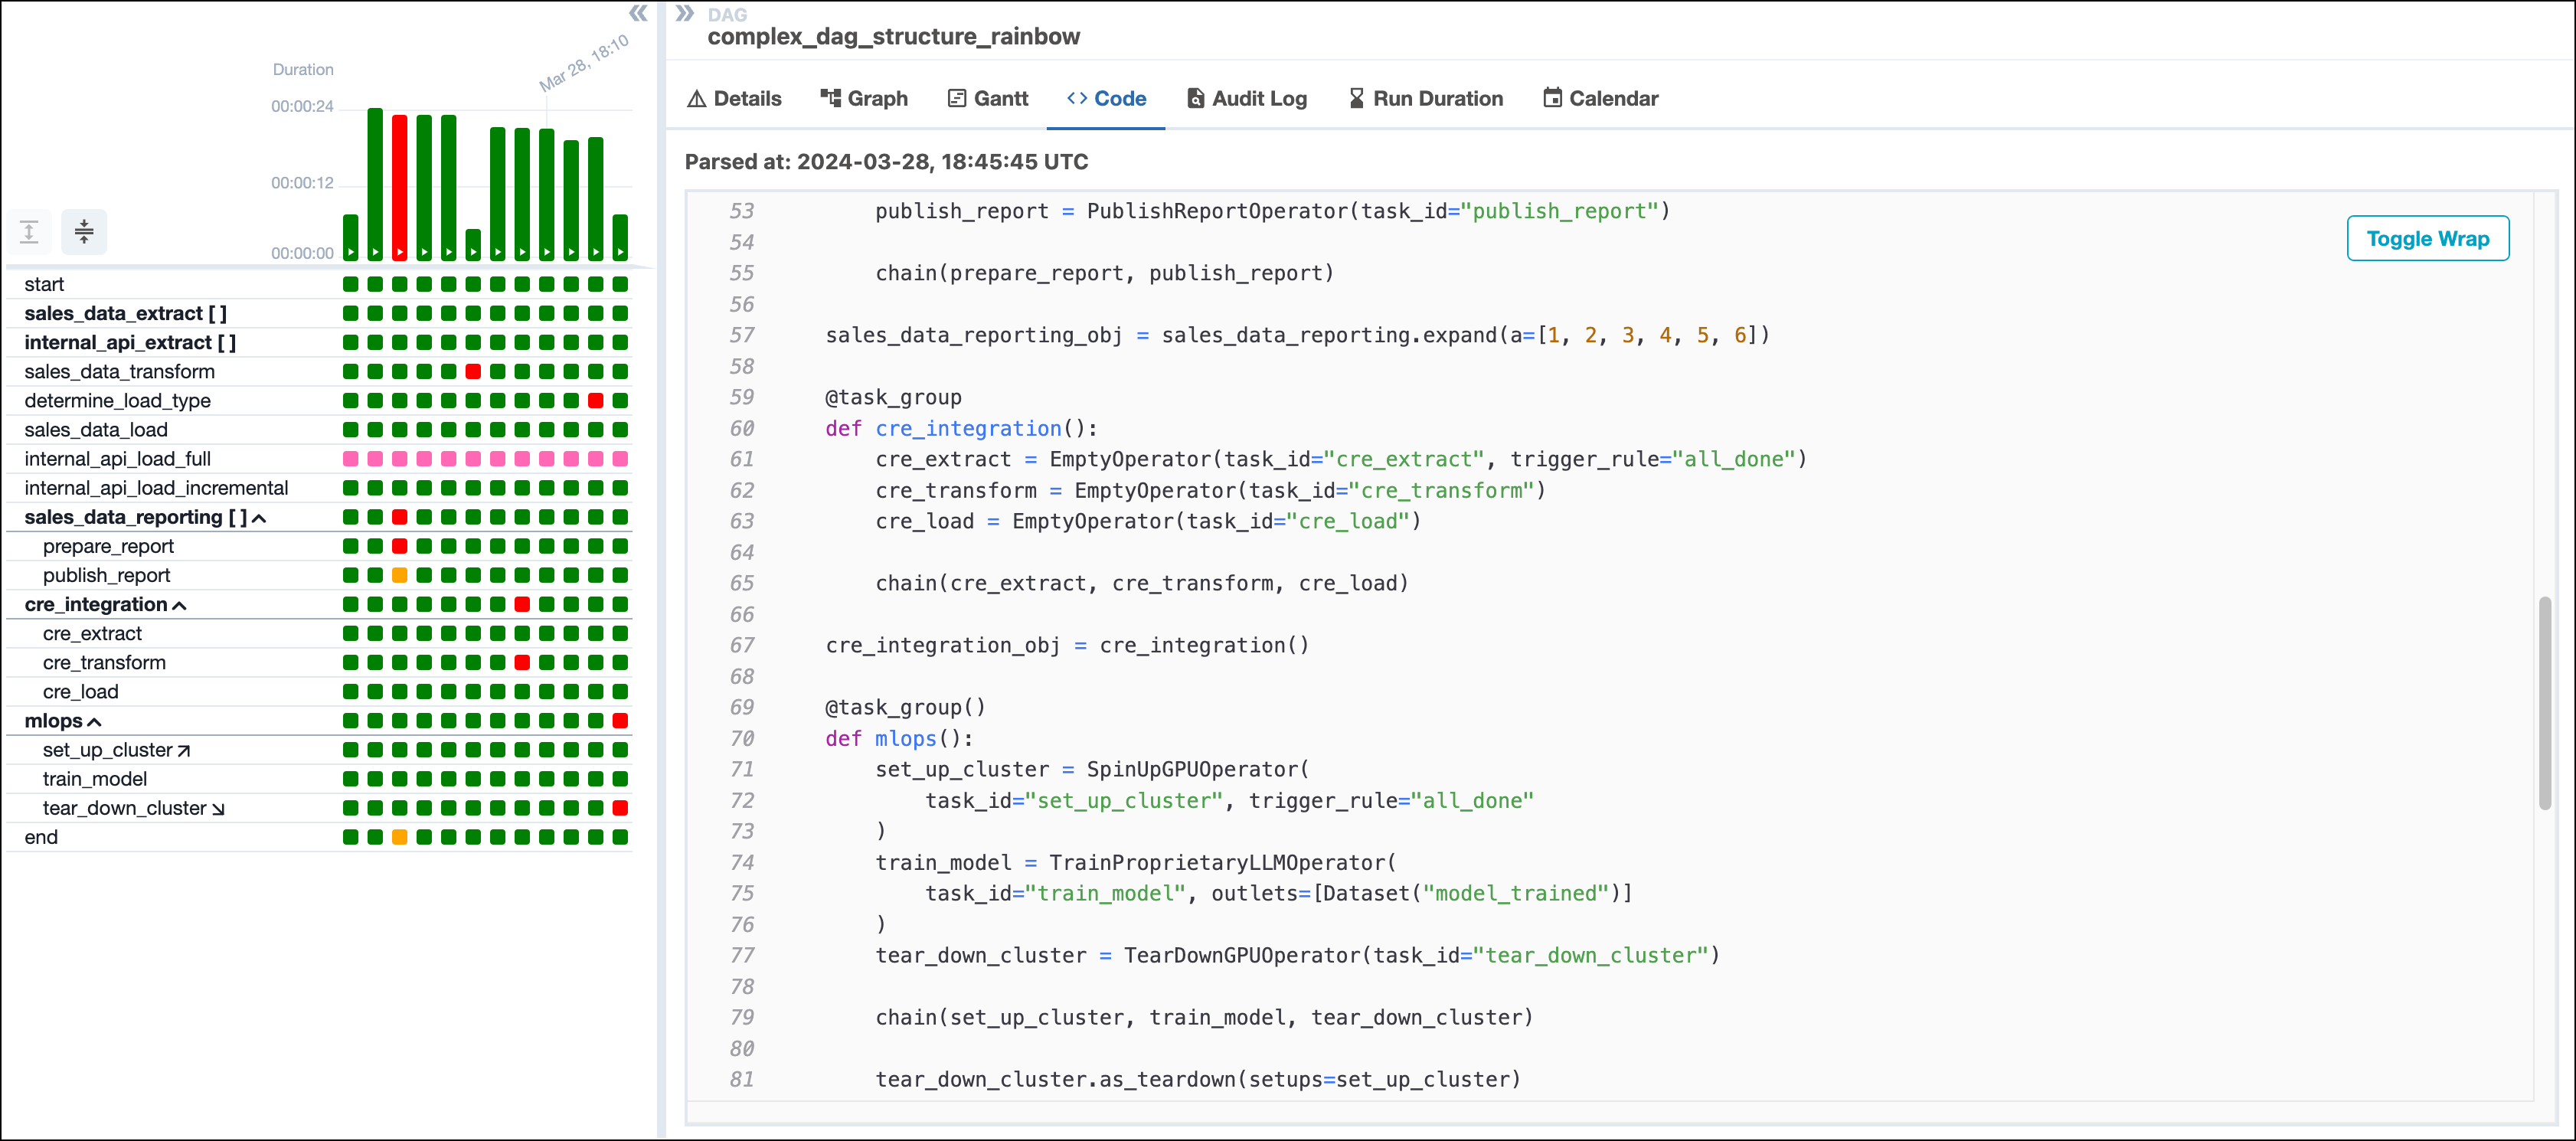 This tab shows code only from the file that generated the DAG. It doesn't show any code that may be imported in the DAG, such as custom hooks or operators or code in your `/include` directory.
### Audit Logs
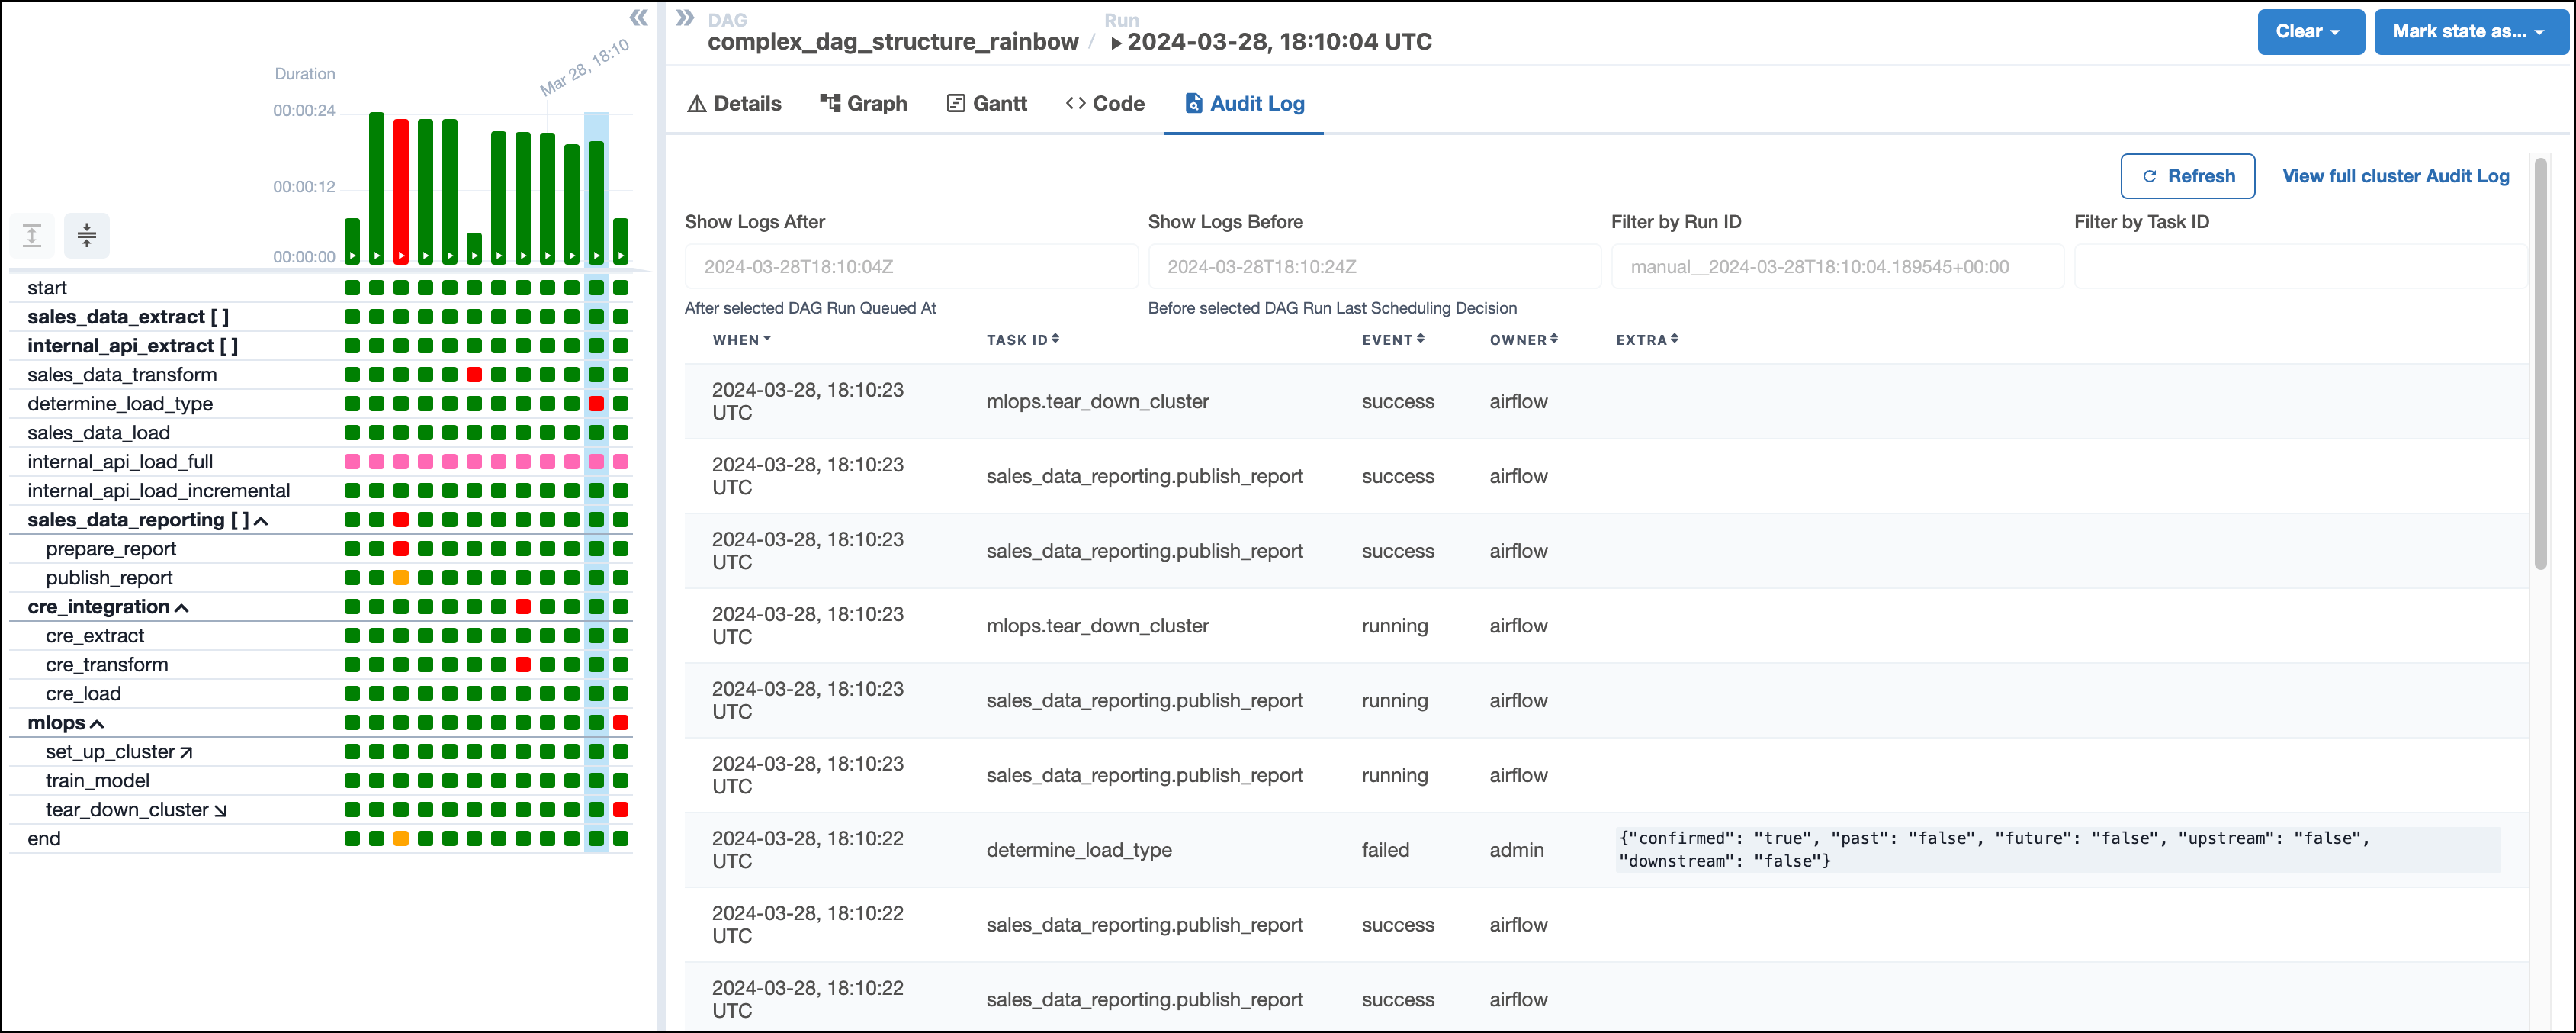
The **Audit Logs** tab shows a list of events that have occurred in your Airflow environment relating to the DAG, DAG run or task instance you have selected.
This tab shows code only from the file that generated the DAG. It doesn't show any code that may be imported in the DAG, such as custom hooks or operators or code in your `/include` directory.
### Audit Logs
The **Audit Logs** tab shows a list of events that have occurred in your Airflow environment relating to the DAG, DAG run or task instance you have selected.
 ### Run Duration
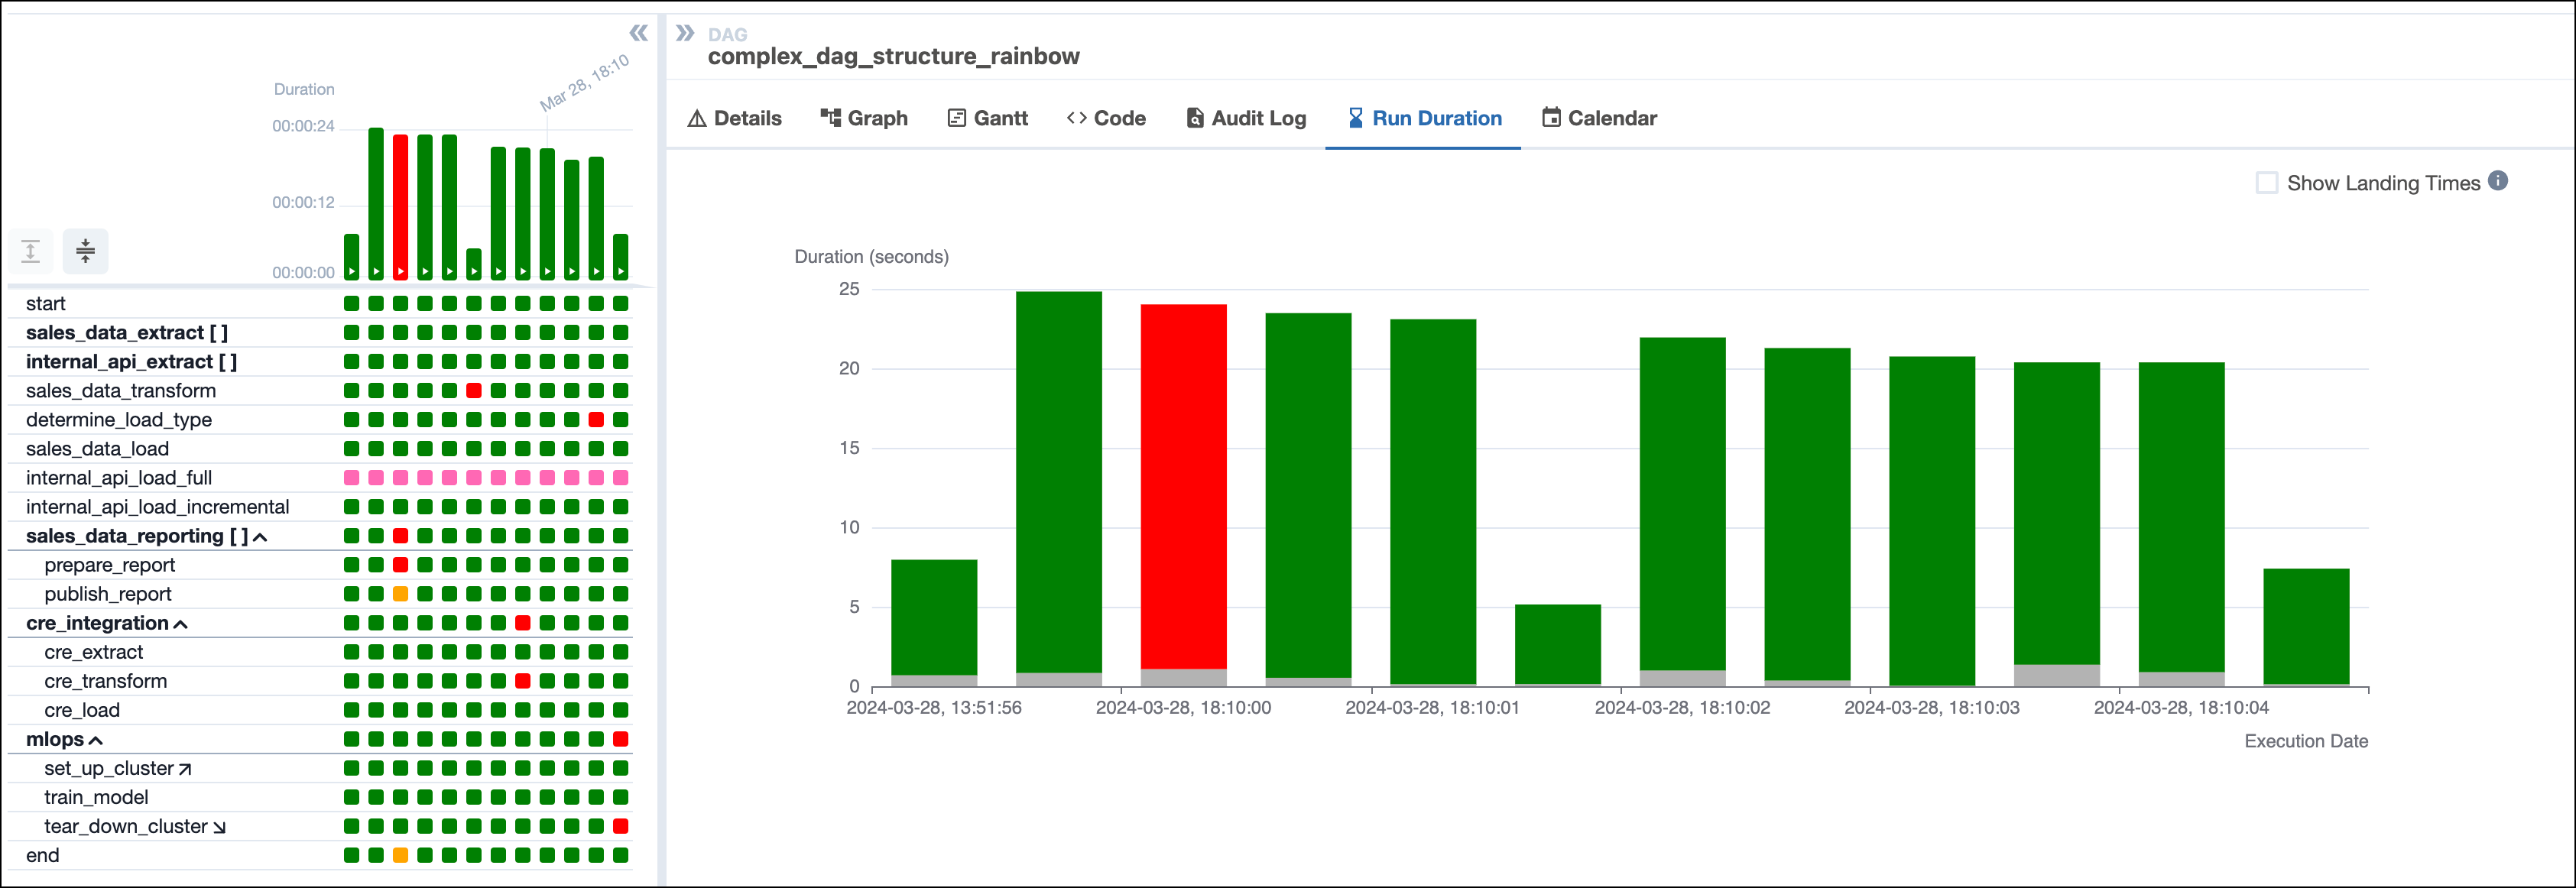
The **Run Duration** tab shows a bar chart of the duration of each DAG run over time.
### Run Duration
The **Run Duration** tab shows a bar chart of the duration of each DAG run over time.
 ### Kubernetes Pod Spec
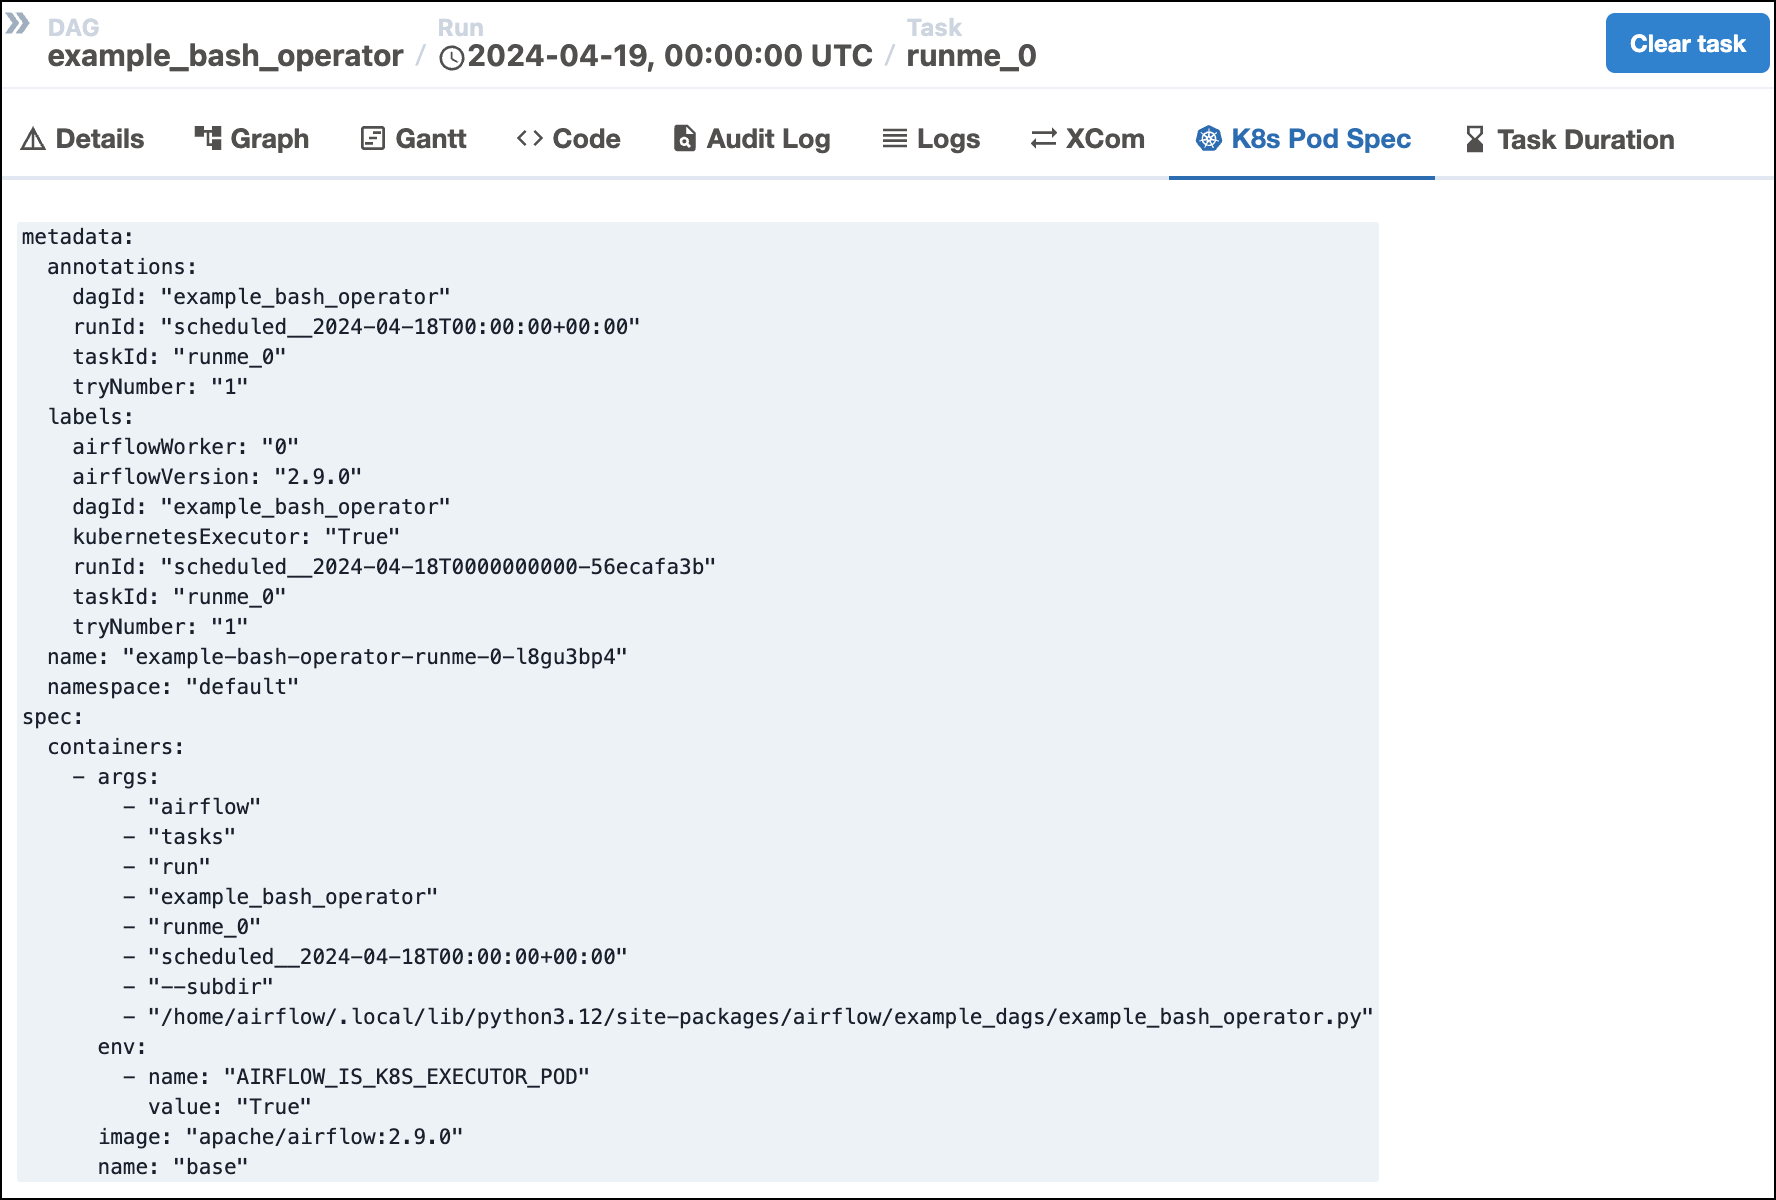
The **K8s Pod Spec** tab displays information about a task's K8s pod if a task has been run on one.
### Kubernetes Pod Spec
The **K8s Pod Spec** tab displays information about a task's K8s pod if a task has been run on one.
 ### Task Duration
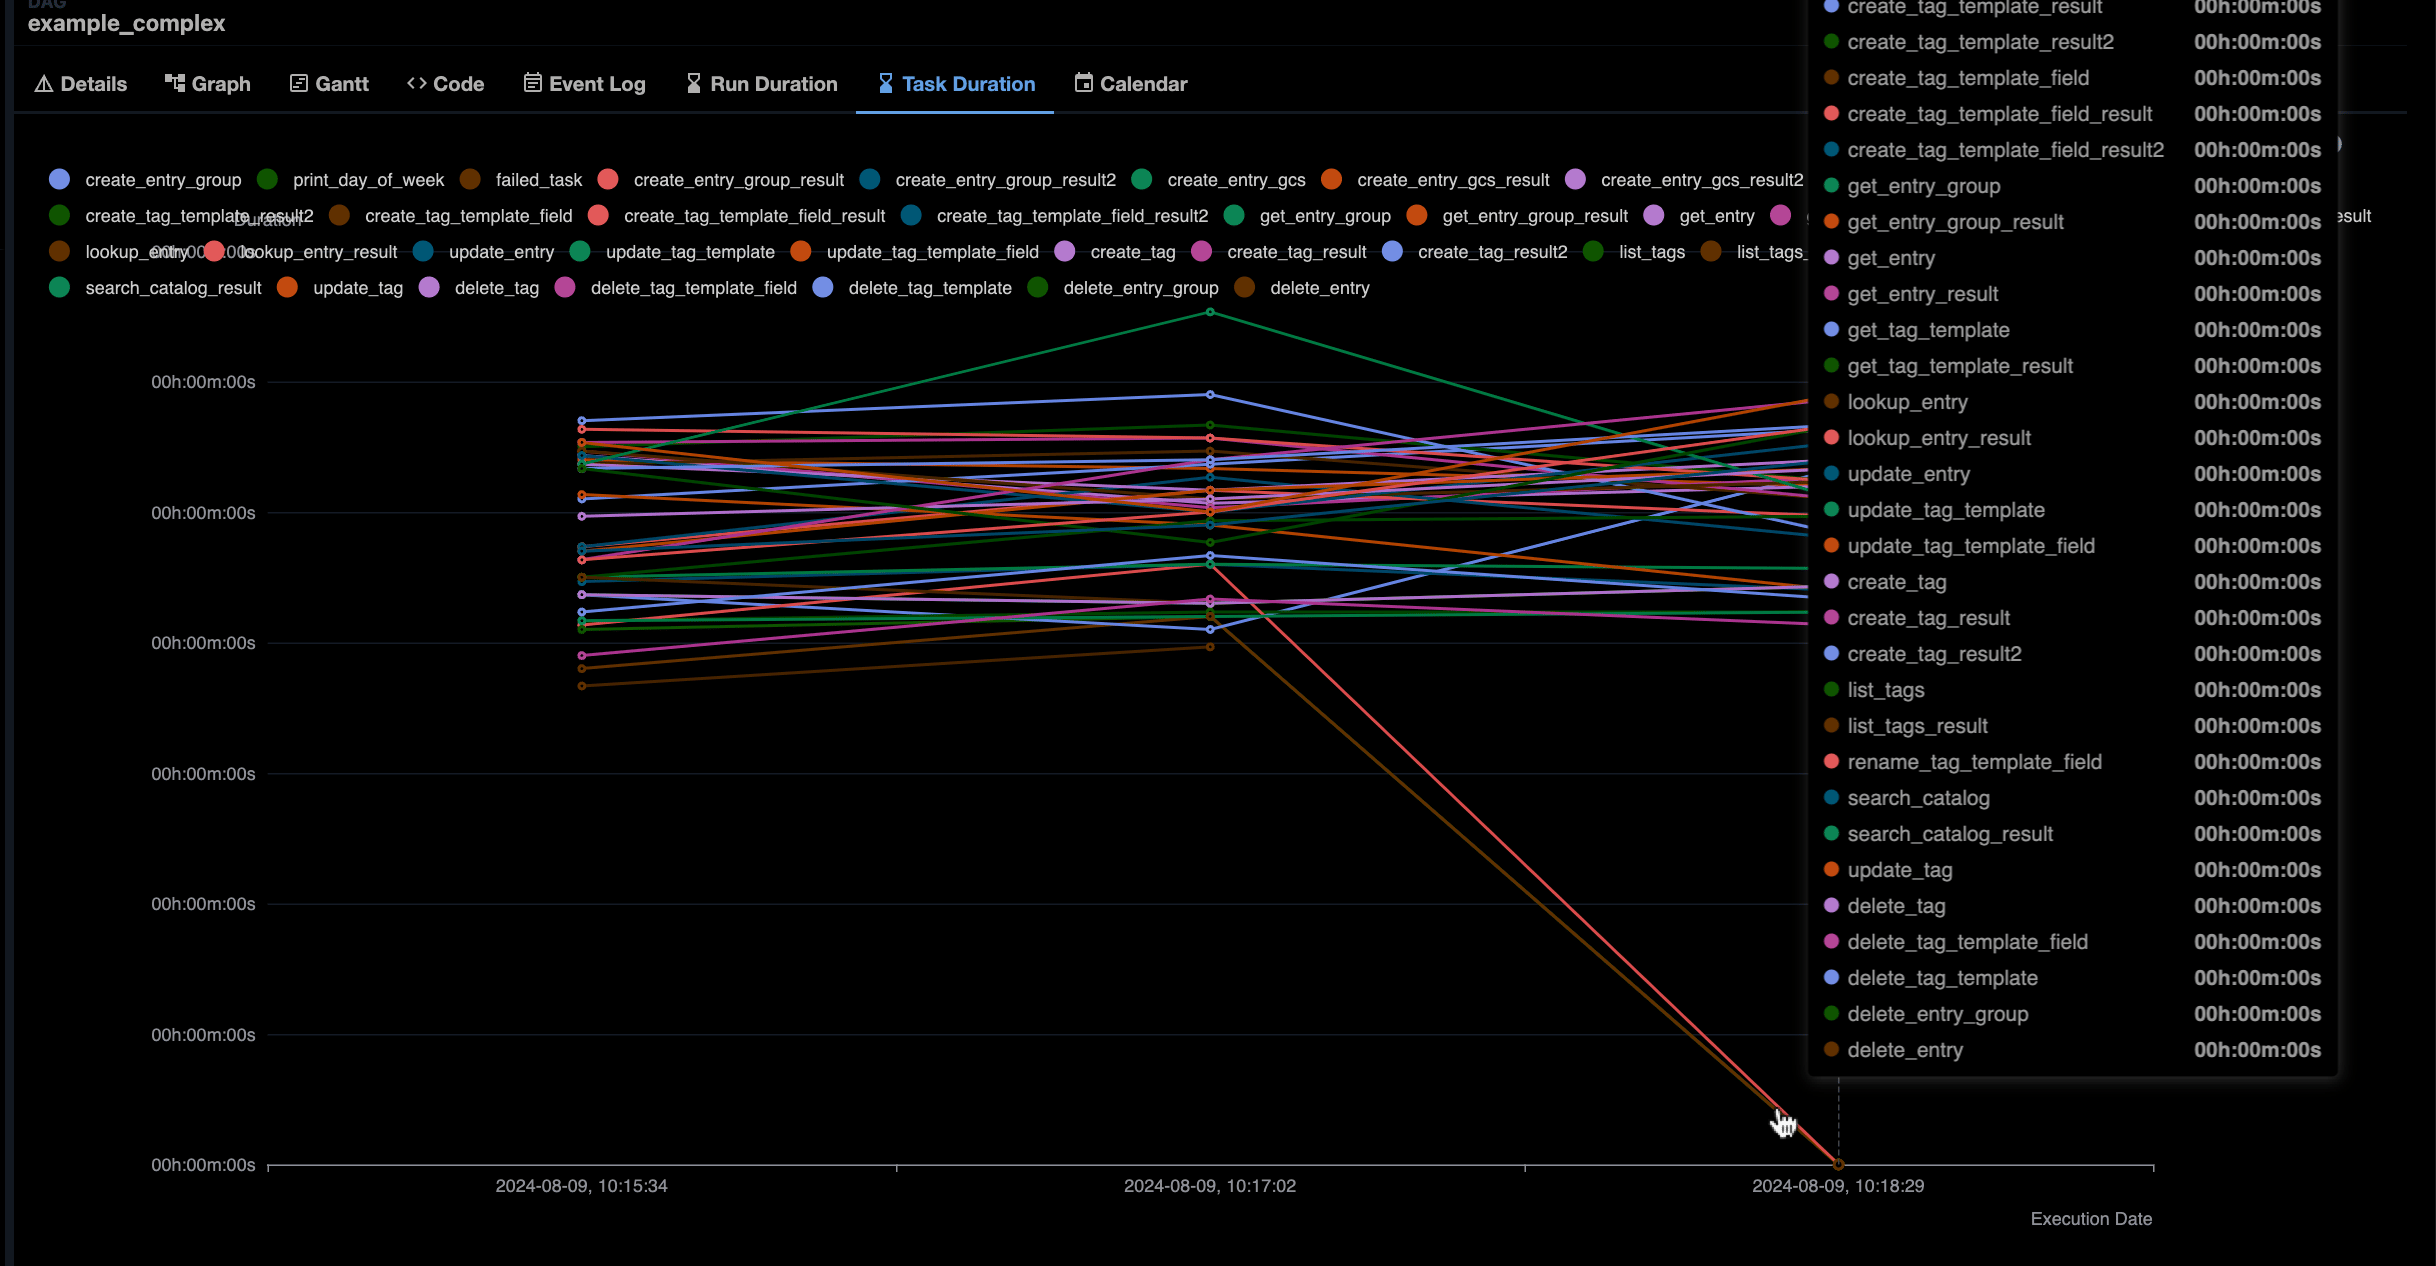
The **Task Duration** tab shows a line chart of the duration of each task across all DAG runs.
### Task Duration
The **Task Duration** tab shows a line chart of the duration of each task across all DAG runs.
 ### Logs
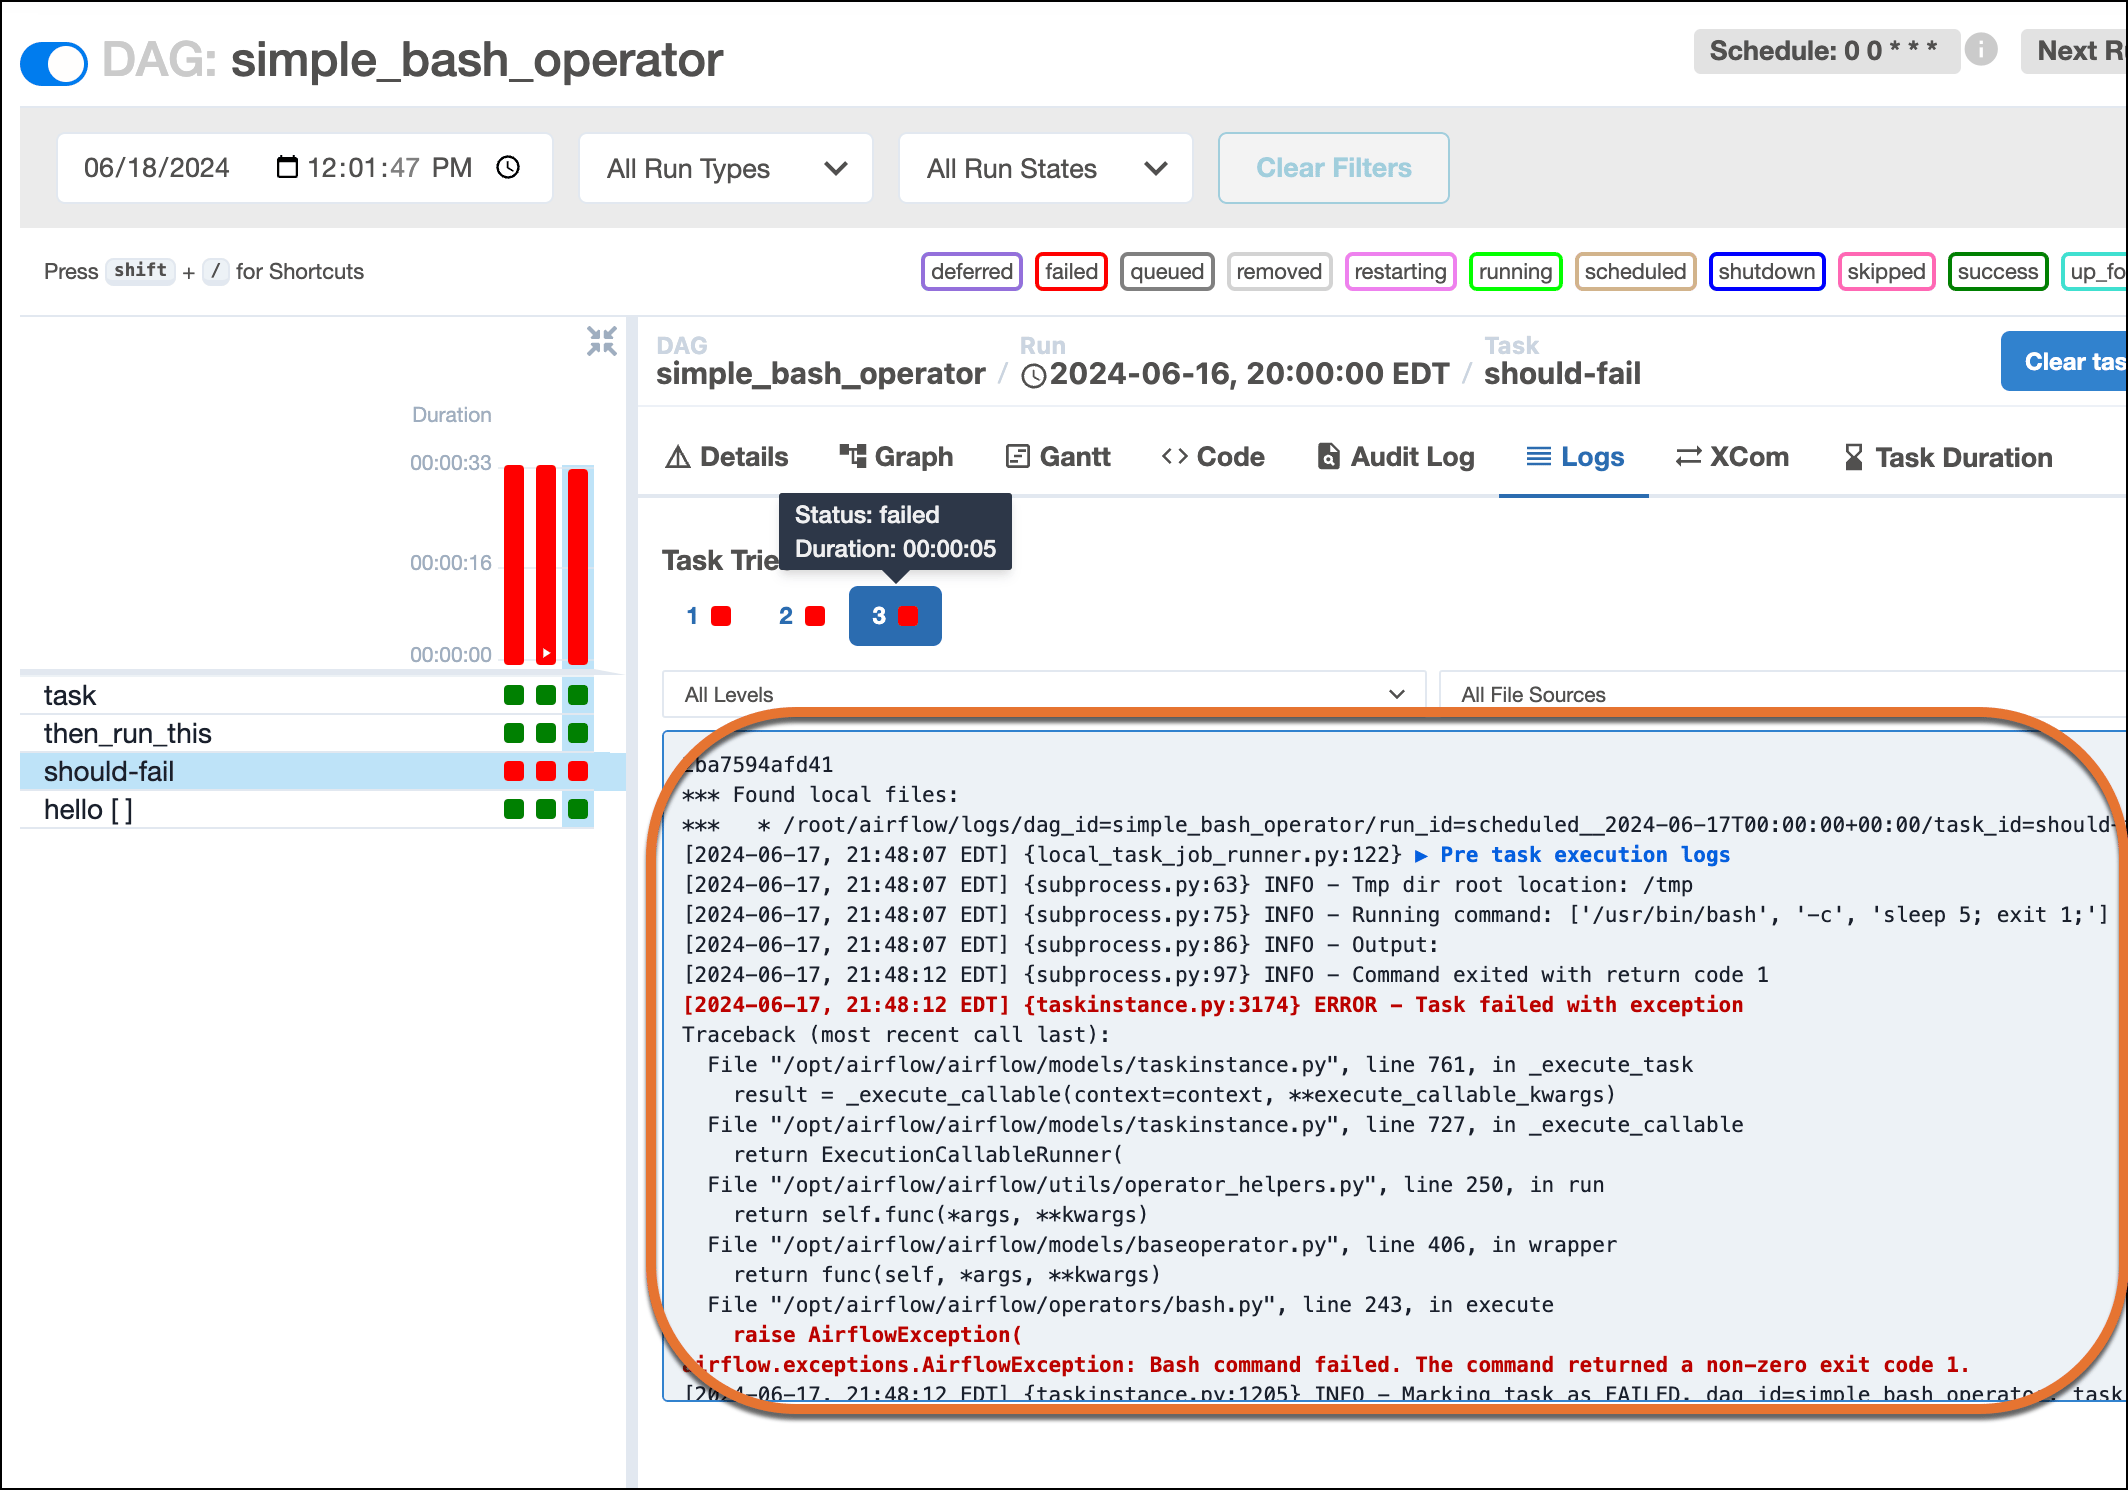
To access the [logs](/docs/learn/2.x/logging#log-locations) of a specific task instance, click the **Logs** tab which appears as soon as you select a task instance. By default the logs of the task execution are shown, while the **Pre task execution logs** and the **Post task execution logs** are collapsed and can be expanded by clicking the respective log item.
### Logs
To access the [logs](/docs/learn/2.x/logging#log-locations) of a specific task instance, click the **Logs** tab which appears as soon as you select a task instance. By default the logs of the task execution are shown, while the **Pre task execution logs** and the **Post task execution logs** are collapsed and can be expanded by clicking the respective log item.
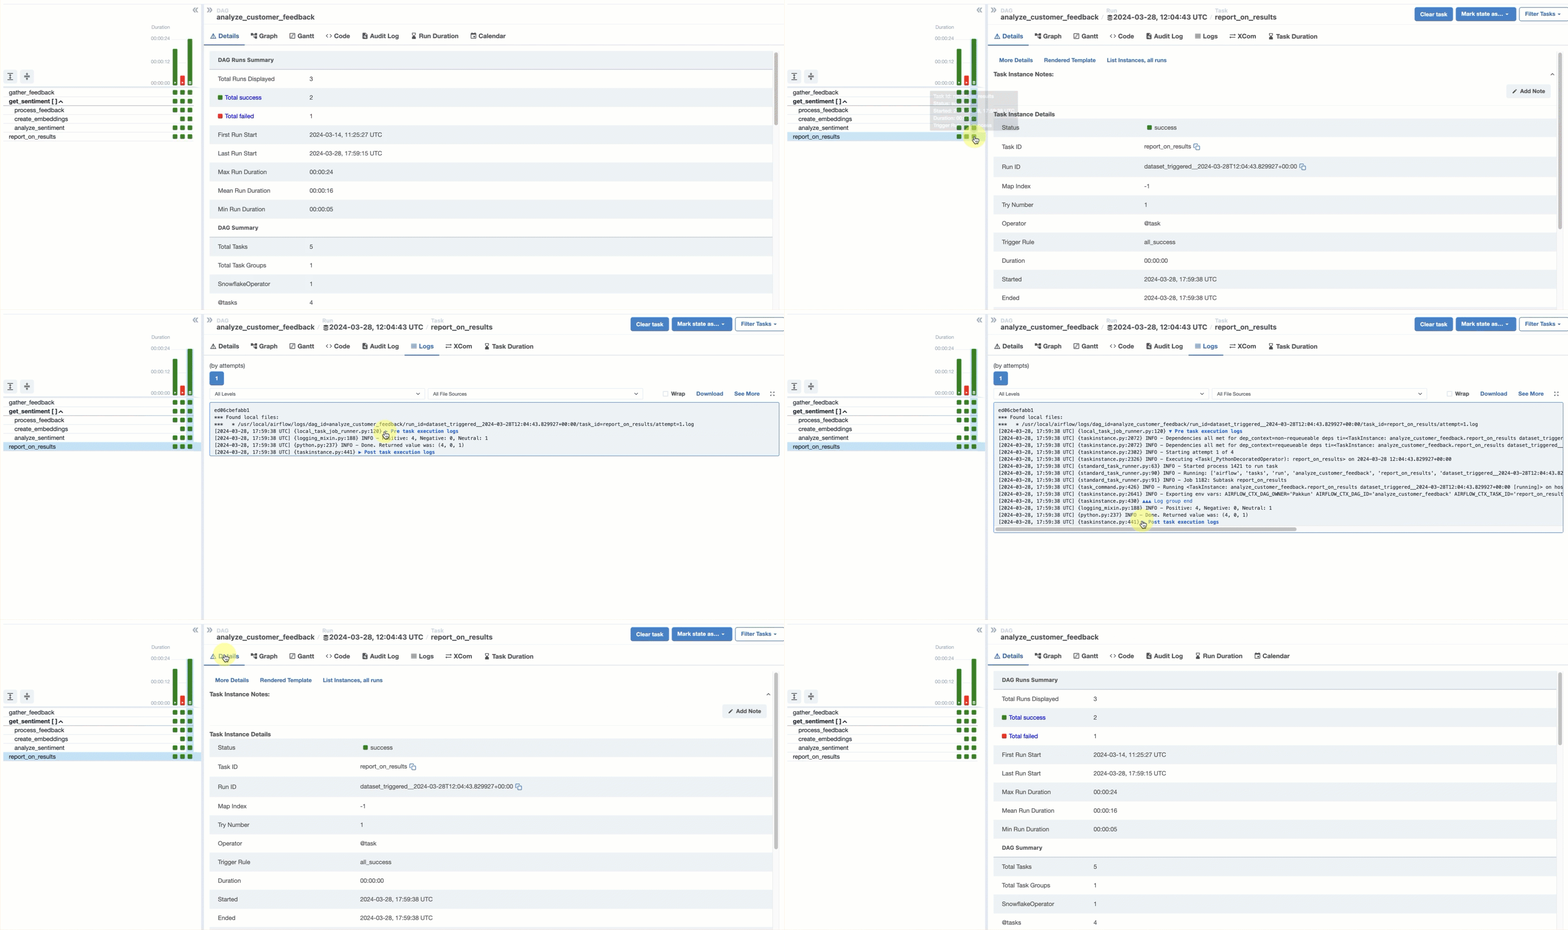 Click the **Logs** tab to see the logs for a selected task. If a task has been retried, you can click a task try button to see the logs for that attempt. Hover over a button for status and duration information at a glance.
 ## Cluster activity tab
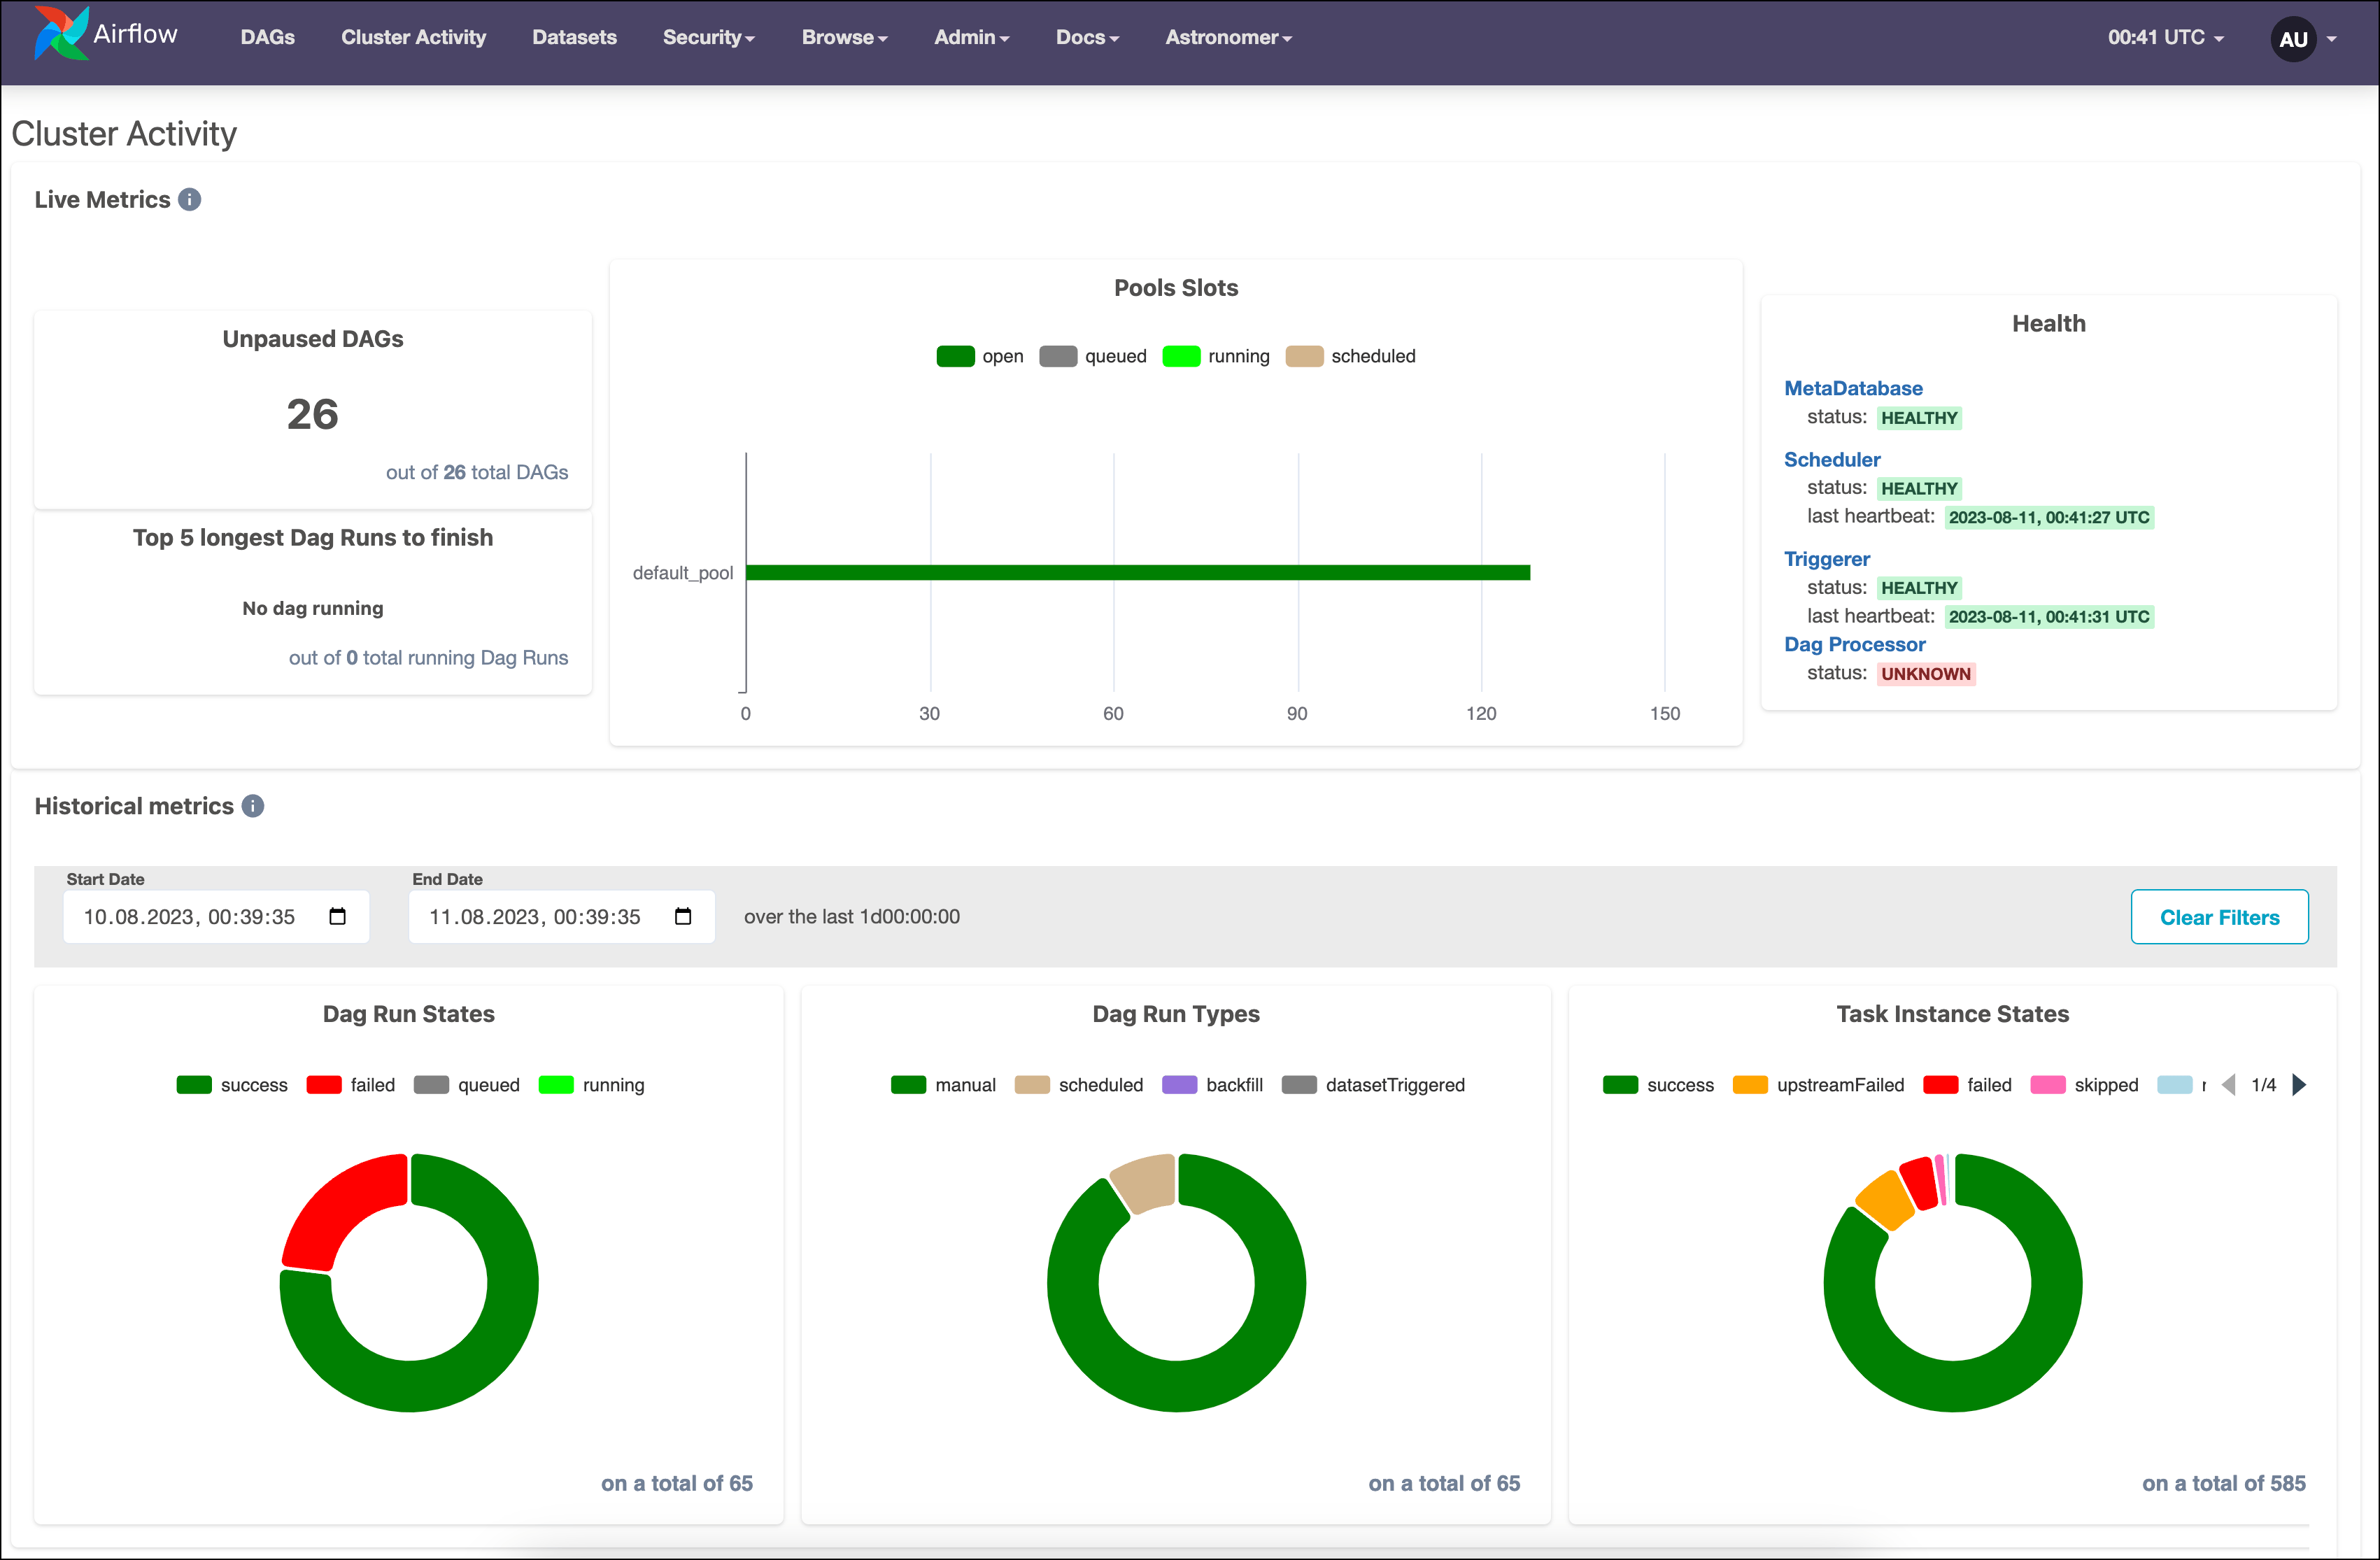
The **Cluster Activity** tab shows aggregated metrics for the entire Airflow cluster. It includes live metrics, such as currently occupied slots in different [pools](/docs/learn/2.x/airflow-pools), unpaused DAGs, and scheduler health.
It also includes historical metrics like the states of past DAG runs and task instances, as well as how each DAG run was triggered.
## Cluster activity tab
The **Cluster Activity** tab shows aggregated metrics for the entire Airflow cluster. It includes live metrics, such as currently occupied slots in different [pools](/docs/learn/2.x/airflow-pools), unpaused DAGs, and scheduler health.
It also includes historical metrics like the states of past DAG runs and task instances, as well as how each DAG run was triggered.
 ## Datasets tab
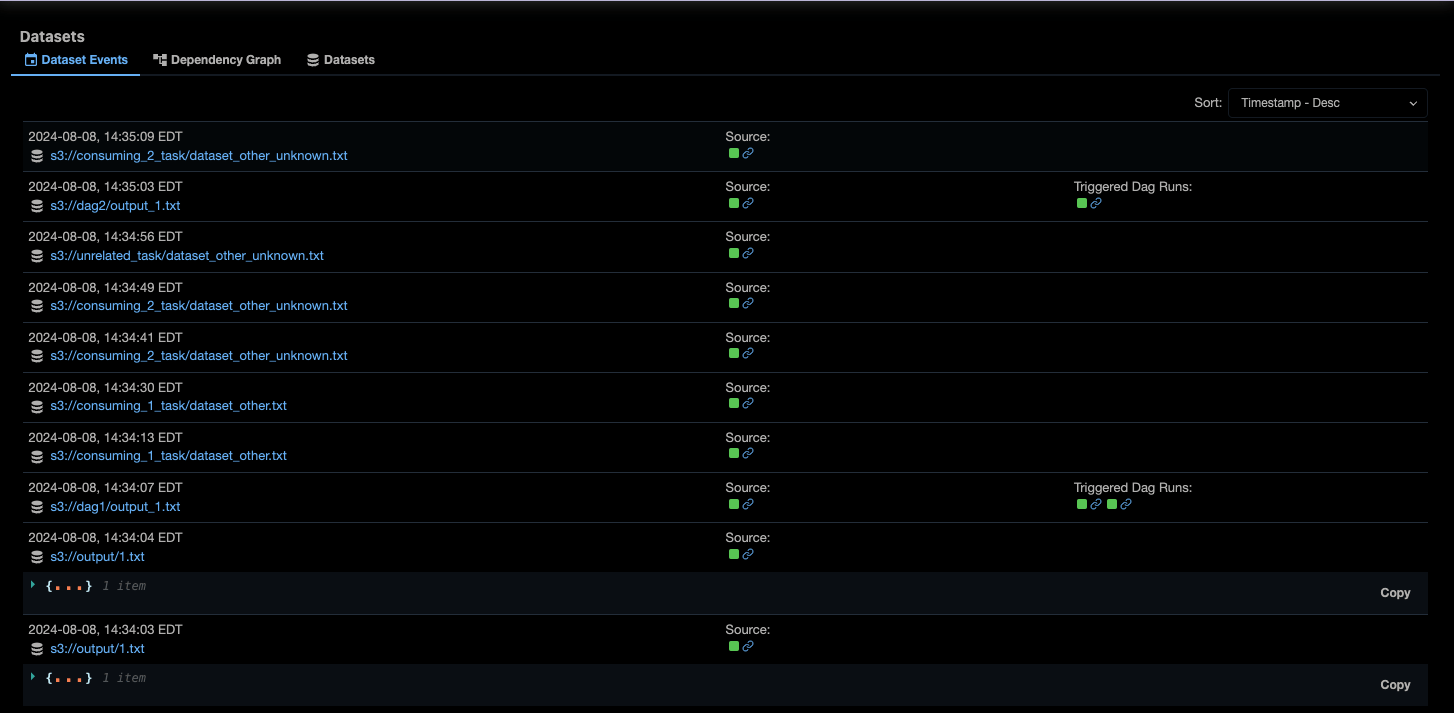
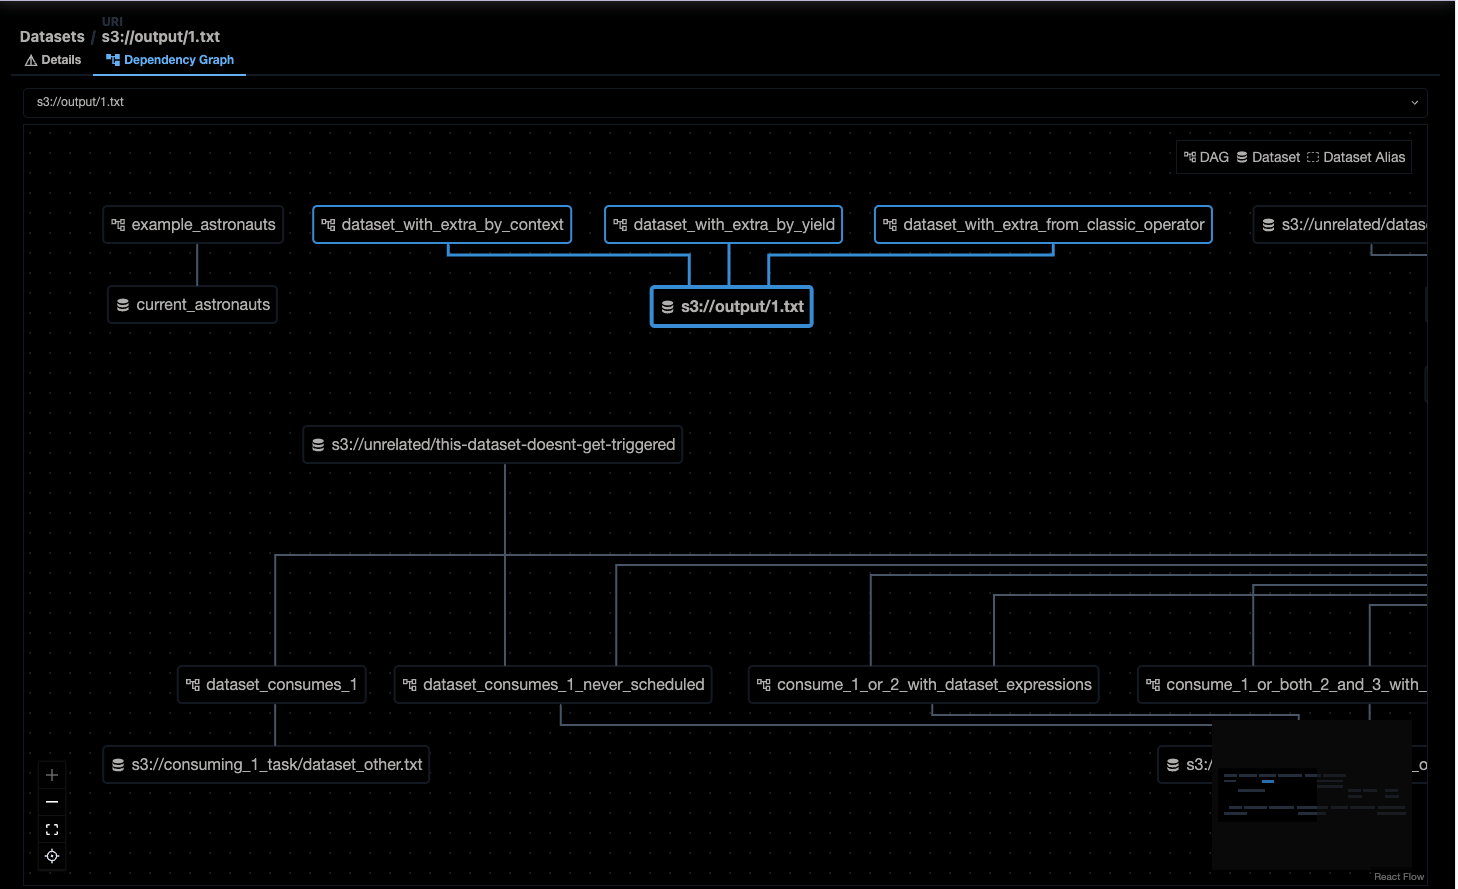
The **Dataset** tab links to a page showing all datasets that have been produced in the Airflow environment, with additional tabs offering:
* a dependency graph of all dependencies between datasets and DAGs.
* a table of datasets containing a URI, the total number of updates, and a timestamp of the last update for each dataset.
## Datasets tab
The **Dataset** tab links to a page showing all datasets that have been produced in the Airflow environment, with additional tabs offering:
* a dependency graph of all dependencies between datasets and DAGs.
* a table of datasets containing a URI, the total number of updates, and a timestamp of the last update for each dataset.
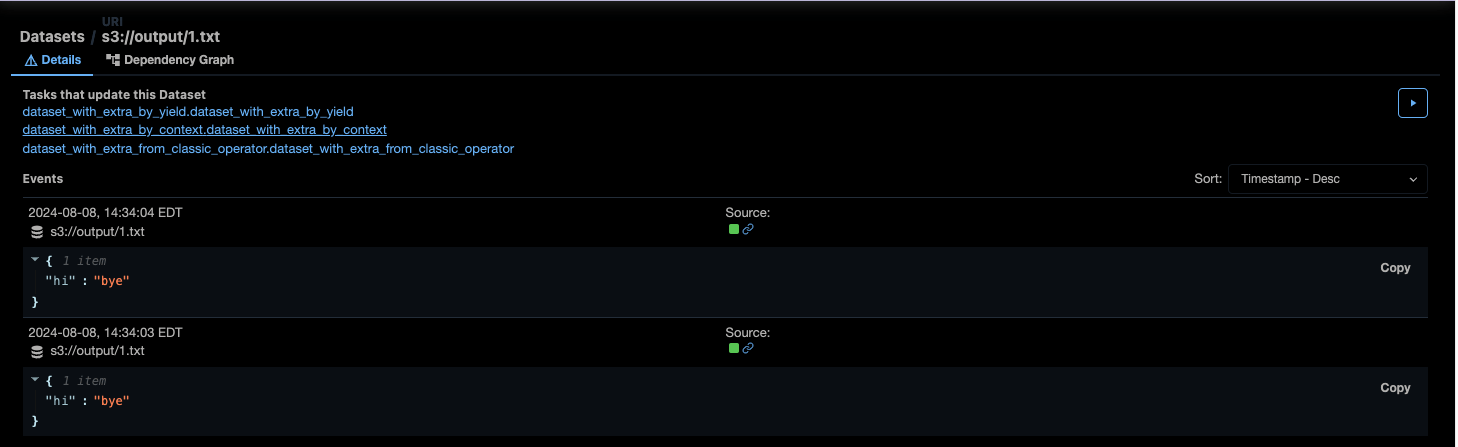
 Click a dataset to open the history of all updates to the dataset that were recorded in the Airflow environment. You can use the Play button to manually trigger an update to a Dataset.
 Click the **Dependency graph** tab to view a holistic graph of datasets and DAGs.
 ## Security tab
**Astro does not support the Security tab**
On Astro, role-based access control is managed at the platform level. As a result, the Security tab isn't needed and isn't available on Airflow deployments on Astro.
The **Security** tab links to multiple pages, including **List Users** and **List Roles**, that you can use to review and manage Airflow role-based access control (RBAC). For more information on working with RBAC, see [Security](https://airflow.apache.org/docs/apache-airflow/stable/security/index.html).
## Security tab
**Astro does not support the Security tab**
On Astro, role-based access control is managed at the platform level. As a result, the Security tab isn't needed and isn't available on Airflow deployments on Astro.
The **Security** tab links to multiple pages, including **List Users** and **List Roles**, that you can use to review and manage Airflow role-based access control (RBAC). For more information on working with RBAC, see [Security](https://airflow.apache.org/docs/apache-airflow/stable/security/index.html).
 If you are running Airflow on Astronomer, the Astronomer RBAC will extend into Airflow and take precedence. There is no need for you to use Airflow RBAC in addition to Astronomer RBAC. Astronomer RBAC can be managed from the Astronomer UI, so the **Security** tab might be less relevant for Astronomer users.
## Browse tab
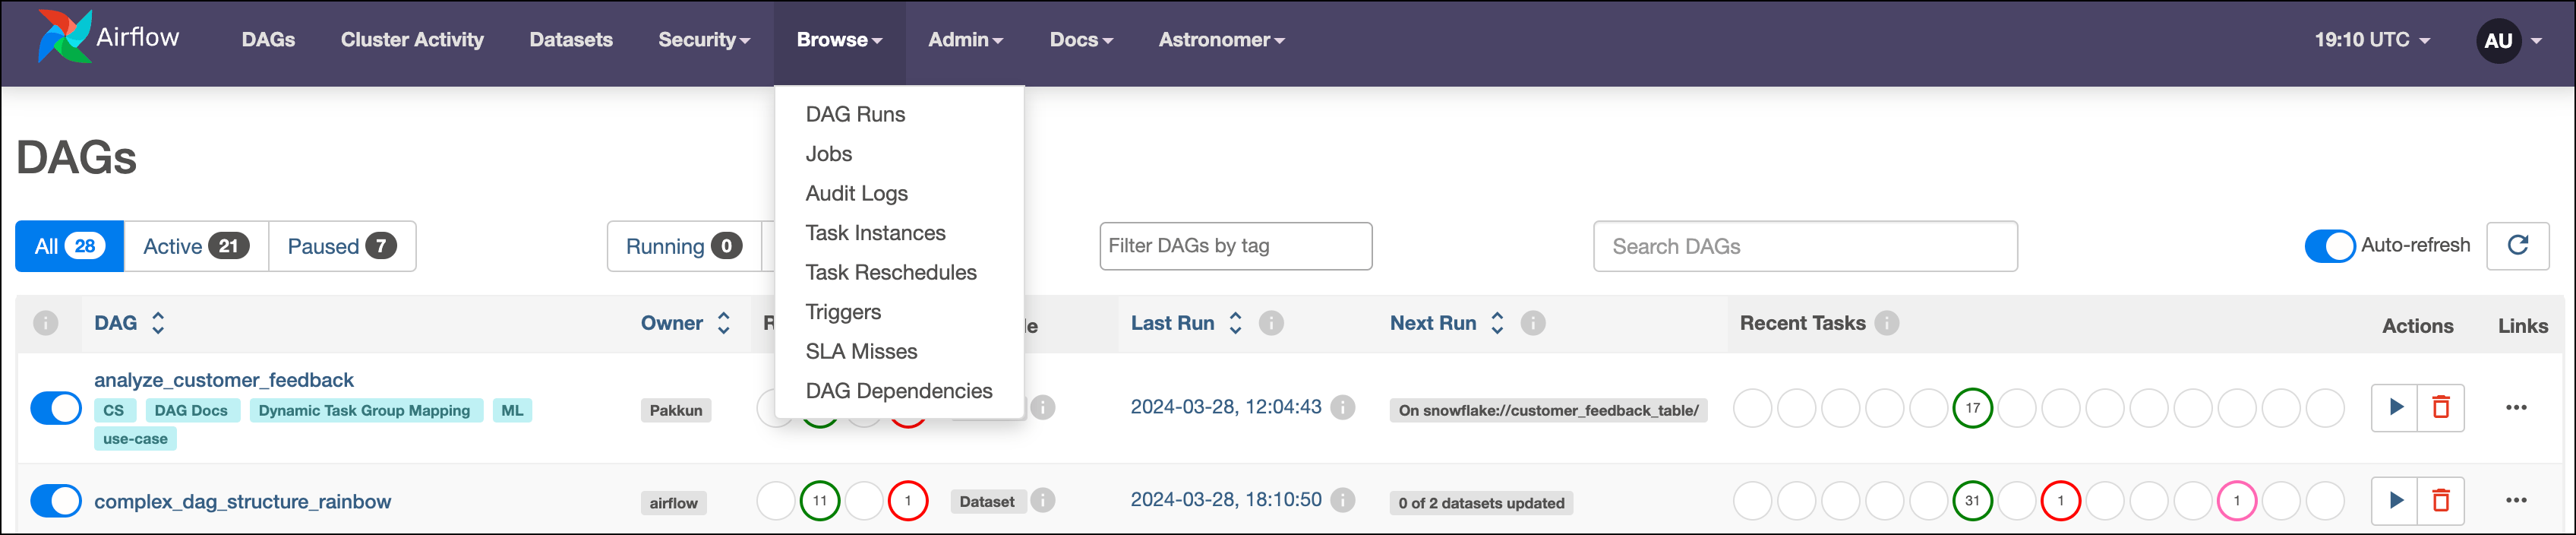
The **Browse** tab links to multiple pages that provide additional insight into and control over your DAG runs and task instances for all DAGs in one place.
If you are running Airflow on Astronomer, the Astronomer RBAC will extend into Airflow and take precedence. There is no need for you to use Airflow RBAC in addition to Astronomer RBAC. Astronomer RBAC can be managed from the Astronomer UI, so the **Security** tab might be less relevant for Astronomer users.
## Browse tab
The **Browse** tab links to multiple pages that provide additional insight into and control over your DAG runs and task instances for all DAGs in one place.
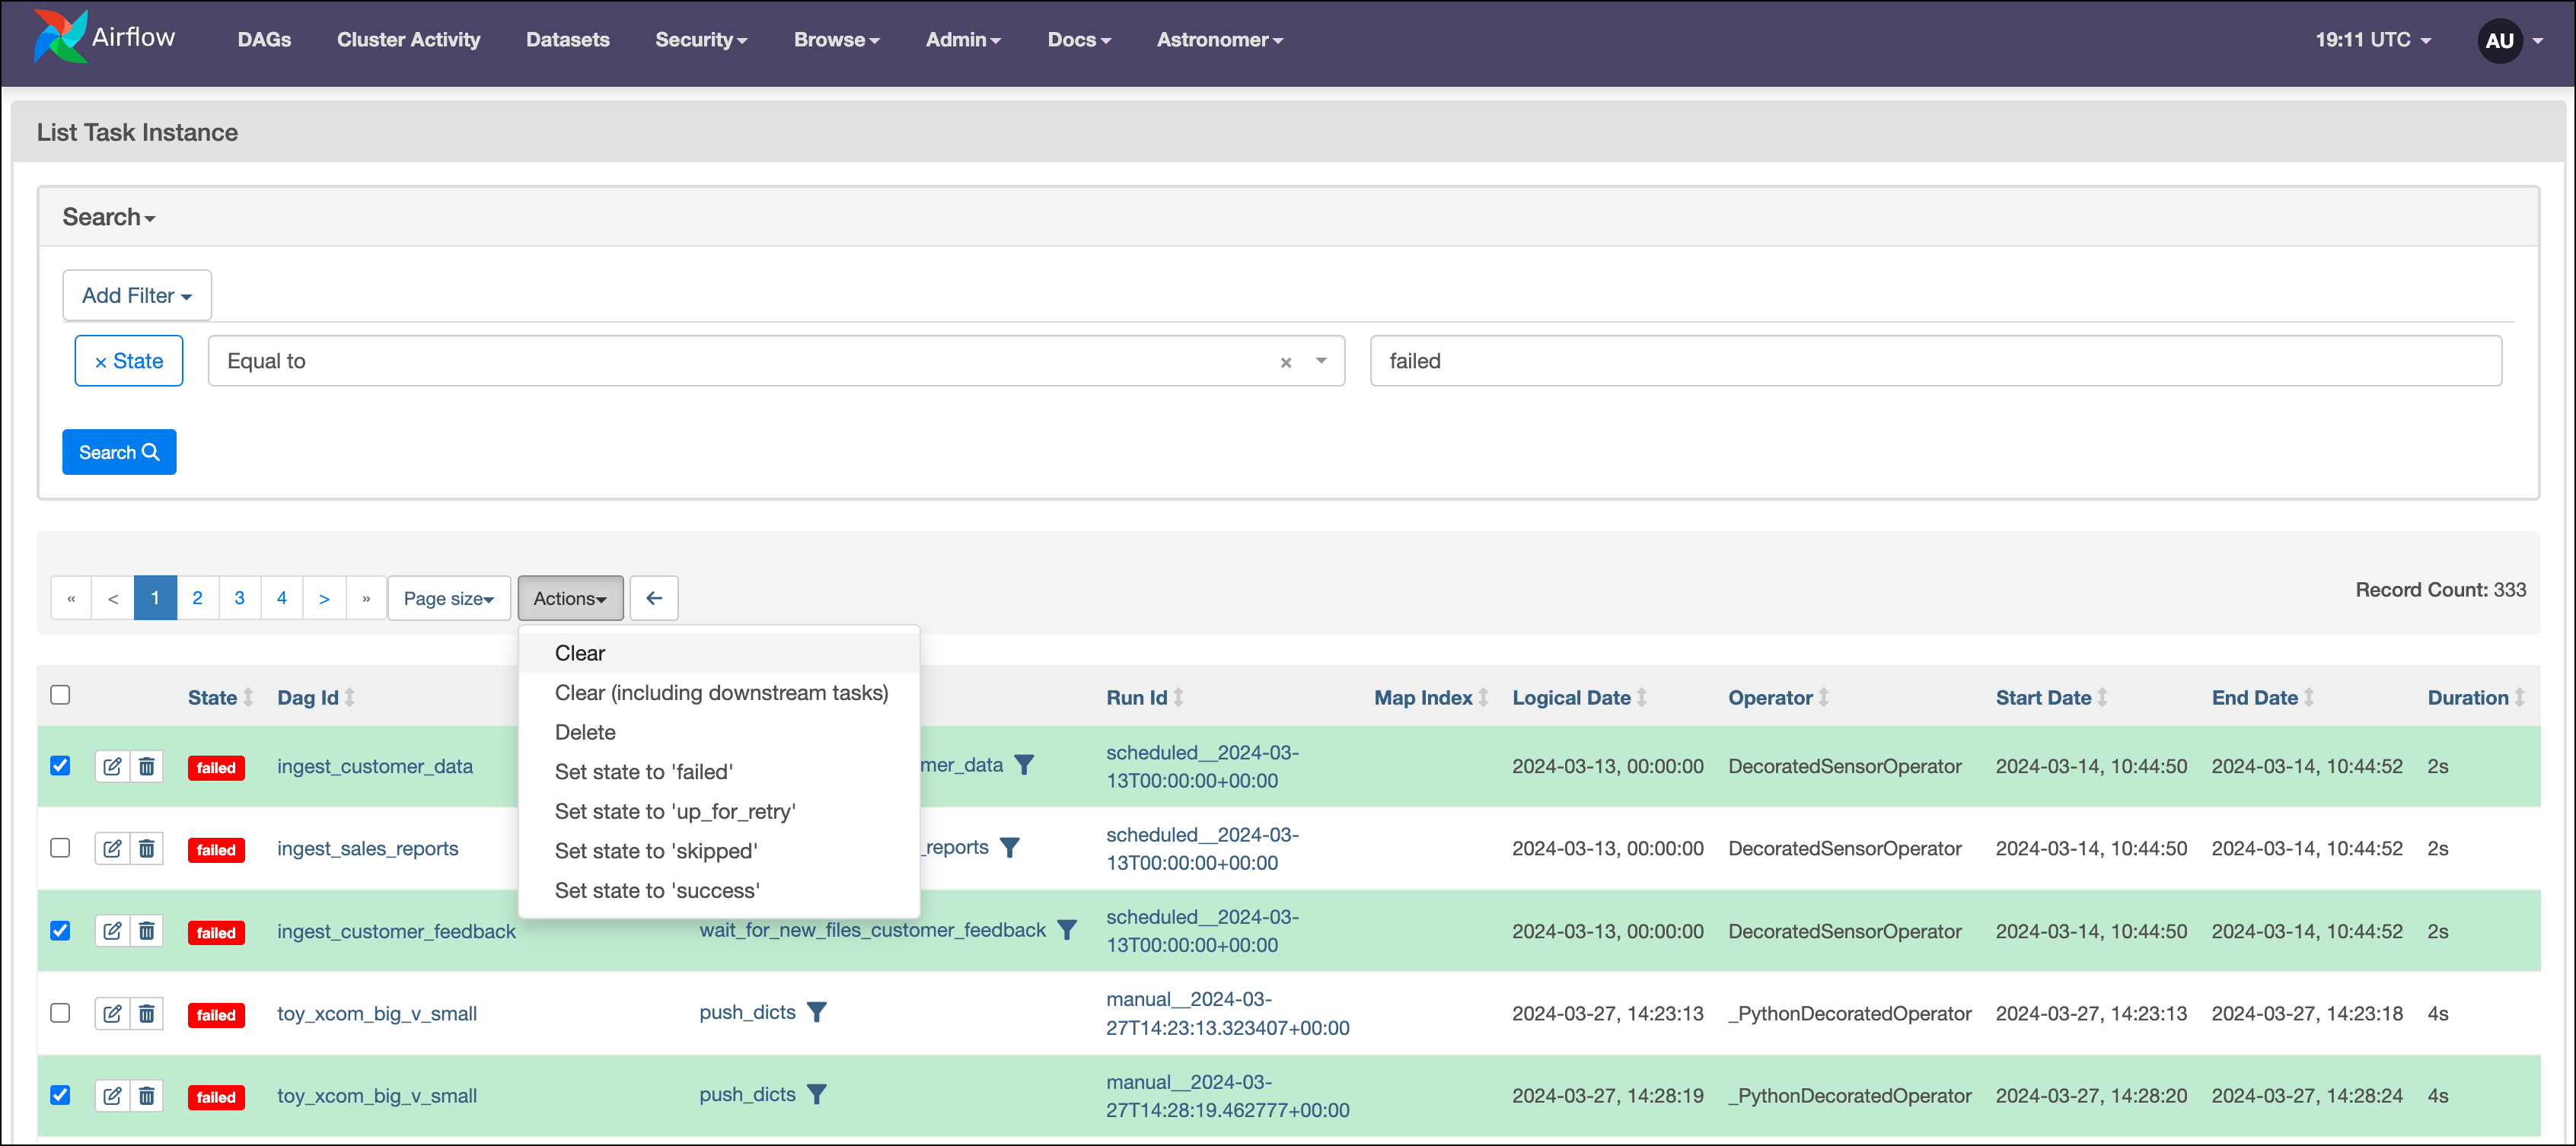
 The DAG runs and task instances pages are the easiest way to view and manipulate these objects in aggregate. If you need to re-run tasks in multiple DAG runs, you can do so from this page by selecting all relevant tasks and clearing their status.
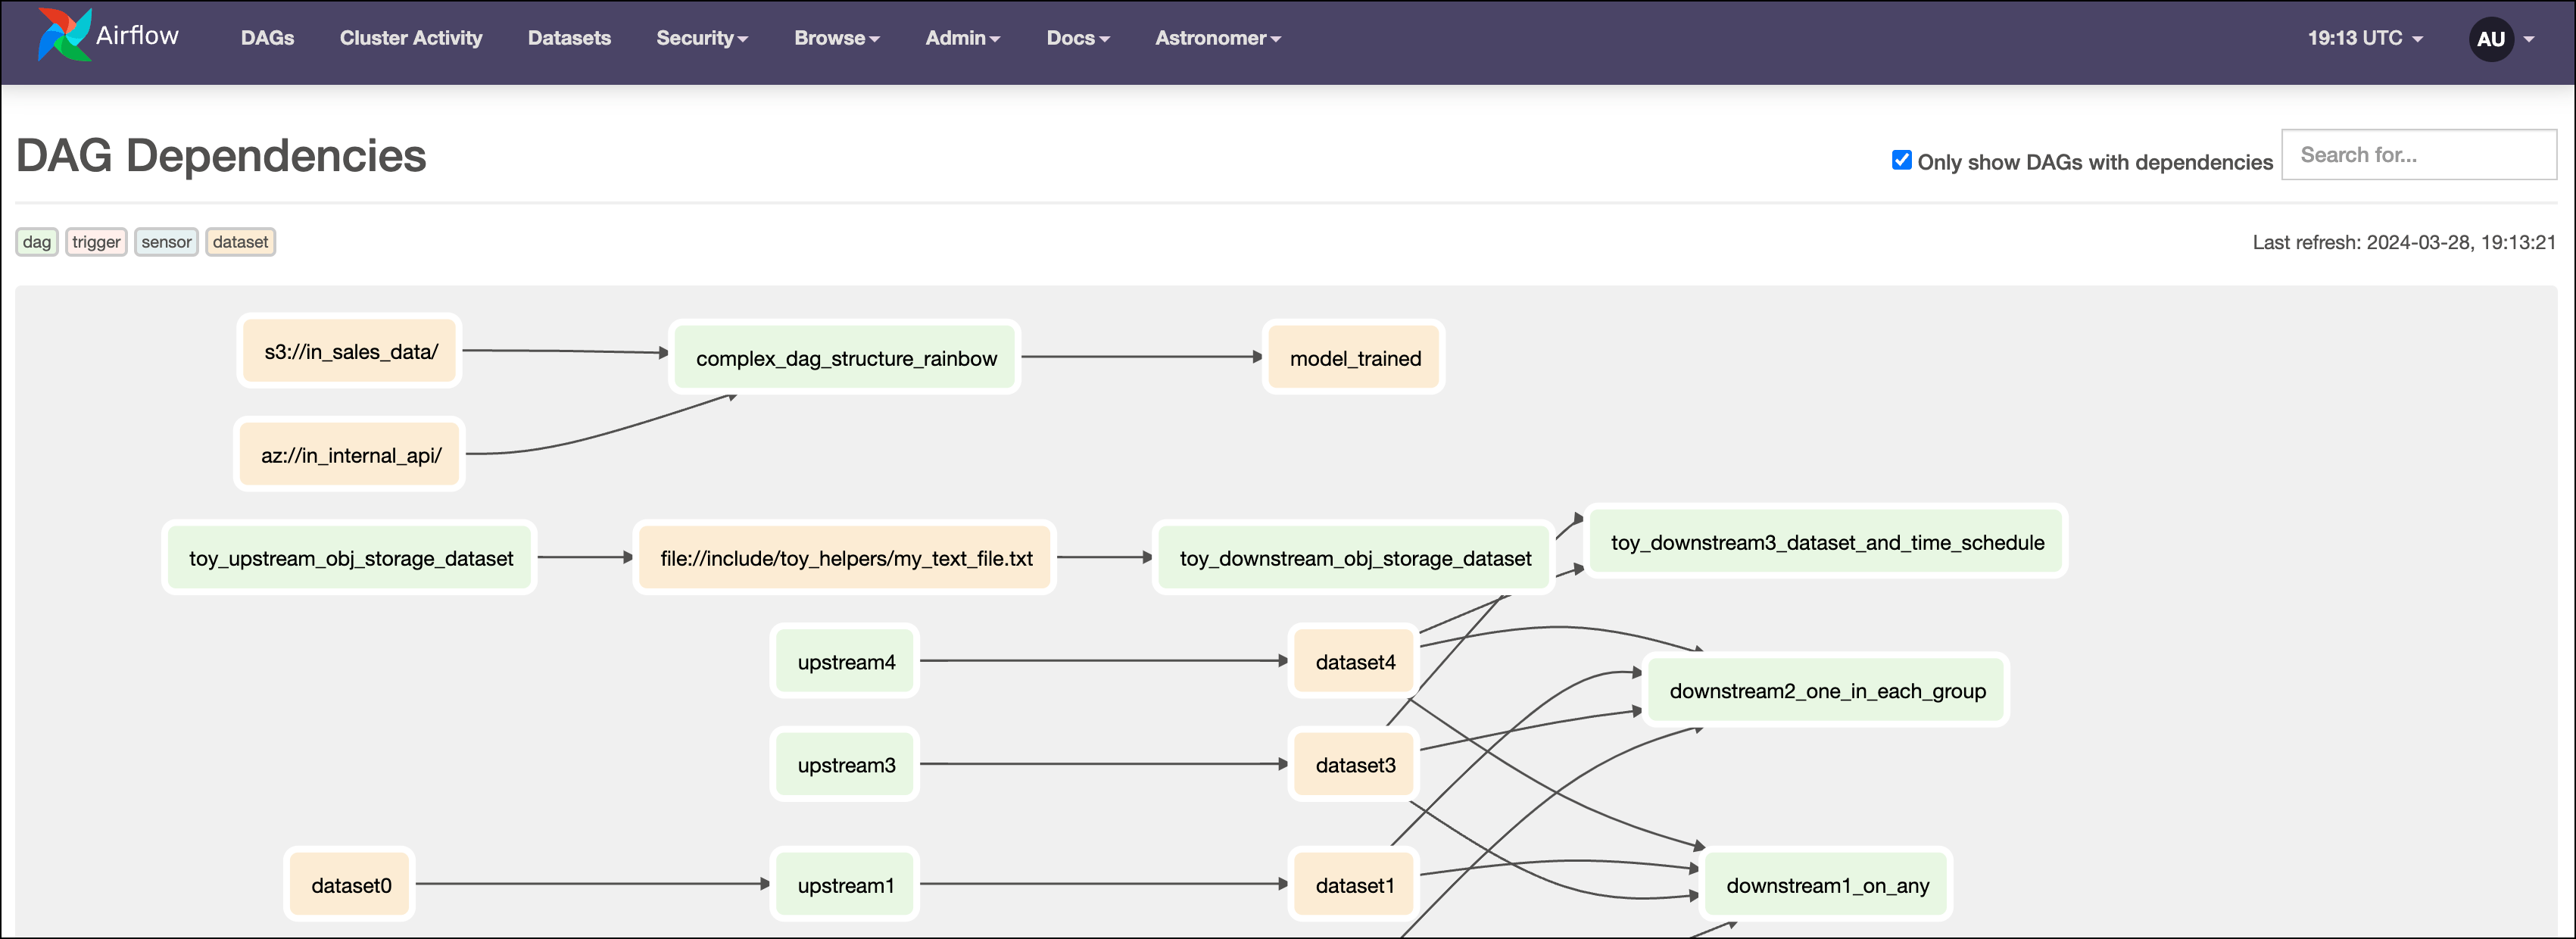
 The DAG Dependencies view shows a graphical representation of any [cross-DAG](/docs/learn/2.x/cross-dag-dependencies) and dataset dependencies in your Airflow environment.
 Other views on the **Browse** tab include:
* **Jobs:** Shows a list of all jobs that have been completed. This includes executed tasks as well as scheduler jobs.
* **Audit Logs:** Shows a list of events that have occurred in your Airflow environment that can be used for auditing purposes.
* **Task Reschedules:** Shows a list of all tasks that have been rescheduled.
* **Triggers:** Shows any triggers that occurred in this Airflow environment. To learn more about triggers and related concepts, you can check out the guide on [Deferrable Operators](/docs/learn/2.x/deferrable-operators).
* **SLA Misses:** Shows any task instances that have missed their SLAs.
## Admin tab
The **Admin** tab links to pages for content related to Airflow administration that aren't specific to any particular DAG. Many of these pages can be used to both view and modify your Airflow environment.
Other views on the **Browse** tab include:
* **Jobs:** Shows a list of all jobs that have been completed. This includes executed tasks as well as scheduler jobs.
* **Audit Logs:** Shows a list of events that have occurred in your Airflow environment that can be used for auditing purposes.
* **Task Reschedules:** Shows a list of all tasks that have been rescheduled.
* **Triggers:** Shows any triggers that occurred in this Airflow environment. To learn more about triggers and related concepts, you can check out the guide on [Deferrable Operators](/docs/learn/2.x/deferrable-operators).
* **SLA Misses:** Shows any task instances that have missed their SLAs.
## Admin tab
The **Admin** tab links to pages for content related to Airflow administration that aren't specific to any particular DAG. Many of these pages can be used to both view and modify your Airflow environment.
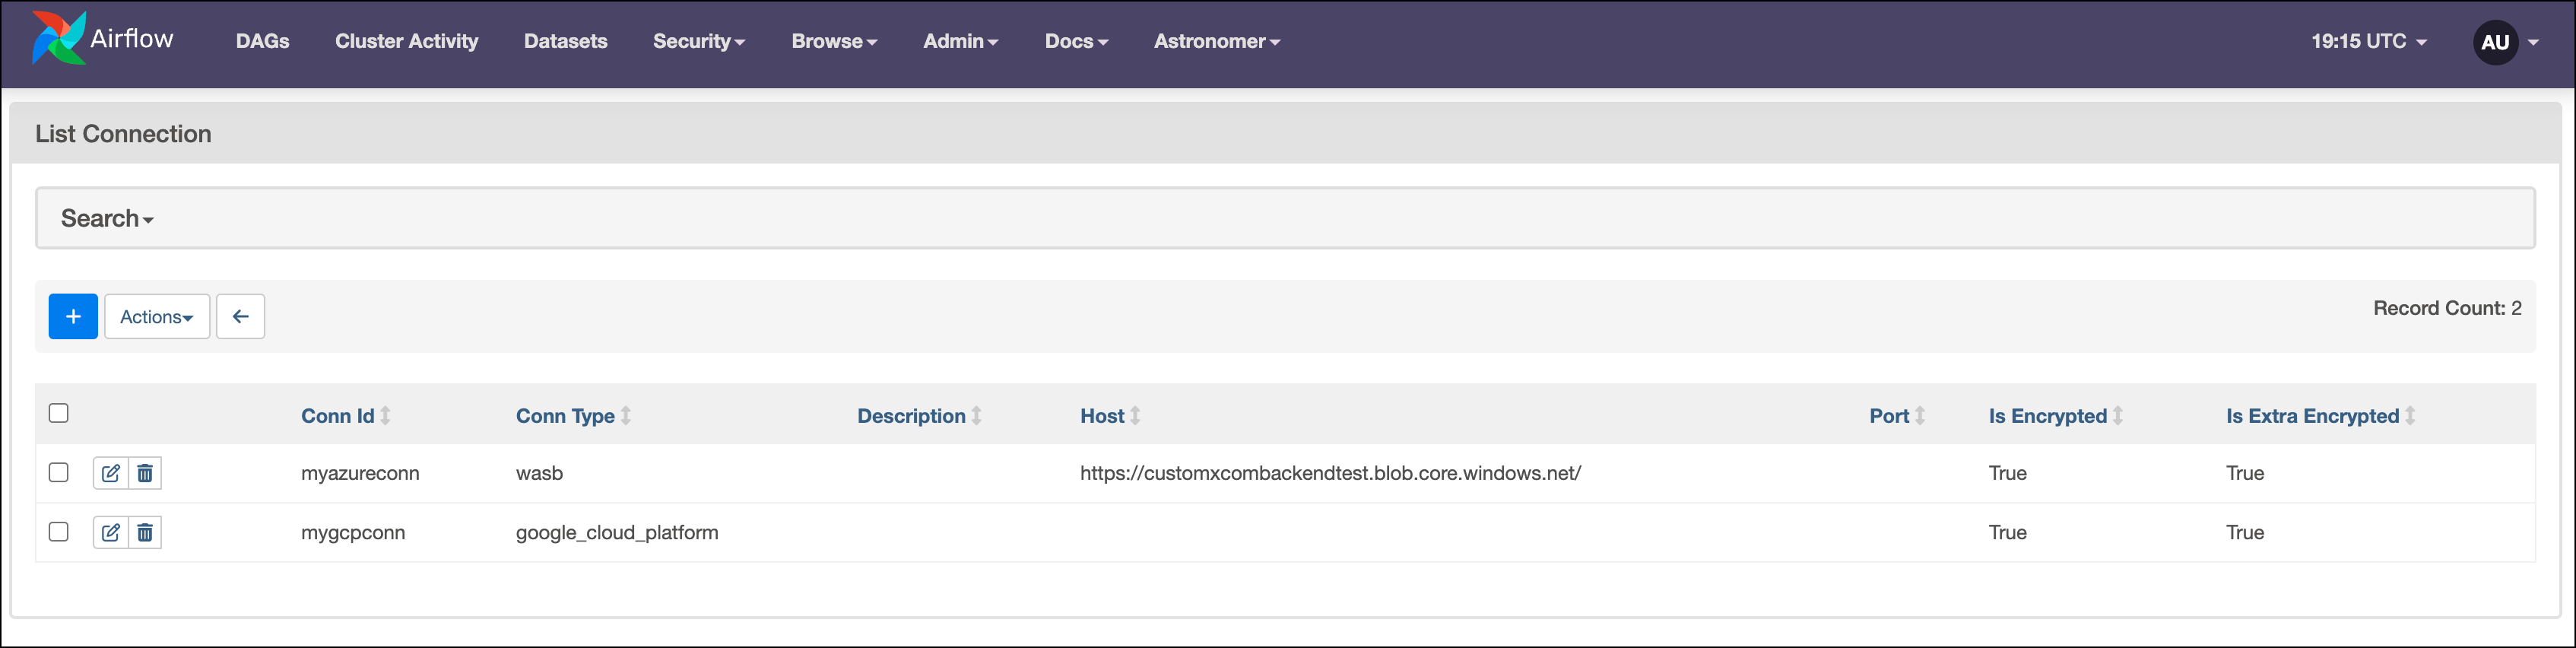
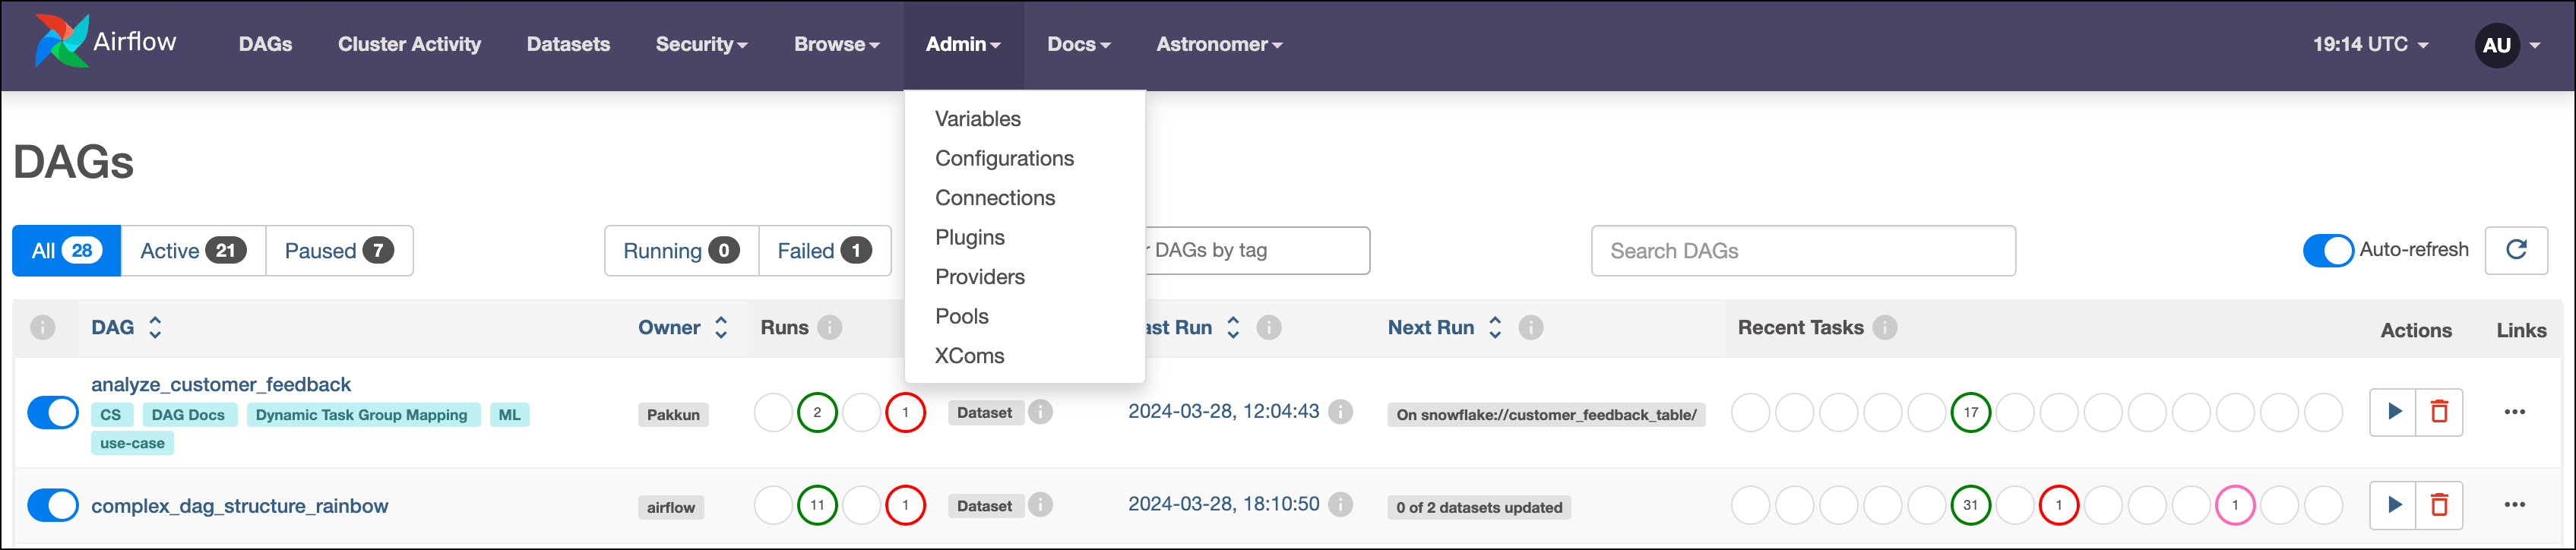 For example, the **Connections** page shows all Airflow connections stored in your environment. Click **+** to add a new connection. For more information, see [Managing your Connections in Apache Airflow](/docs/learn/2.x/connections).
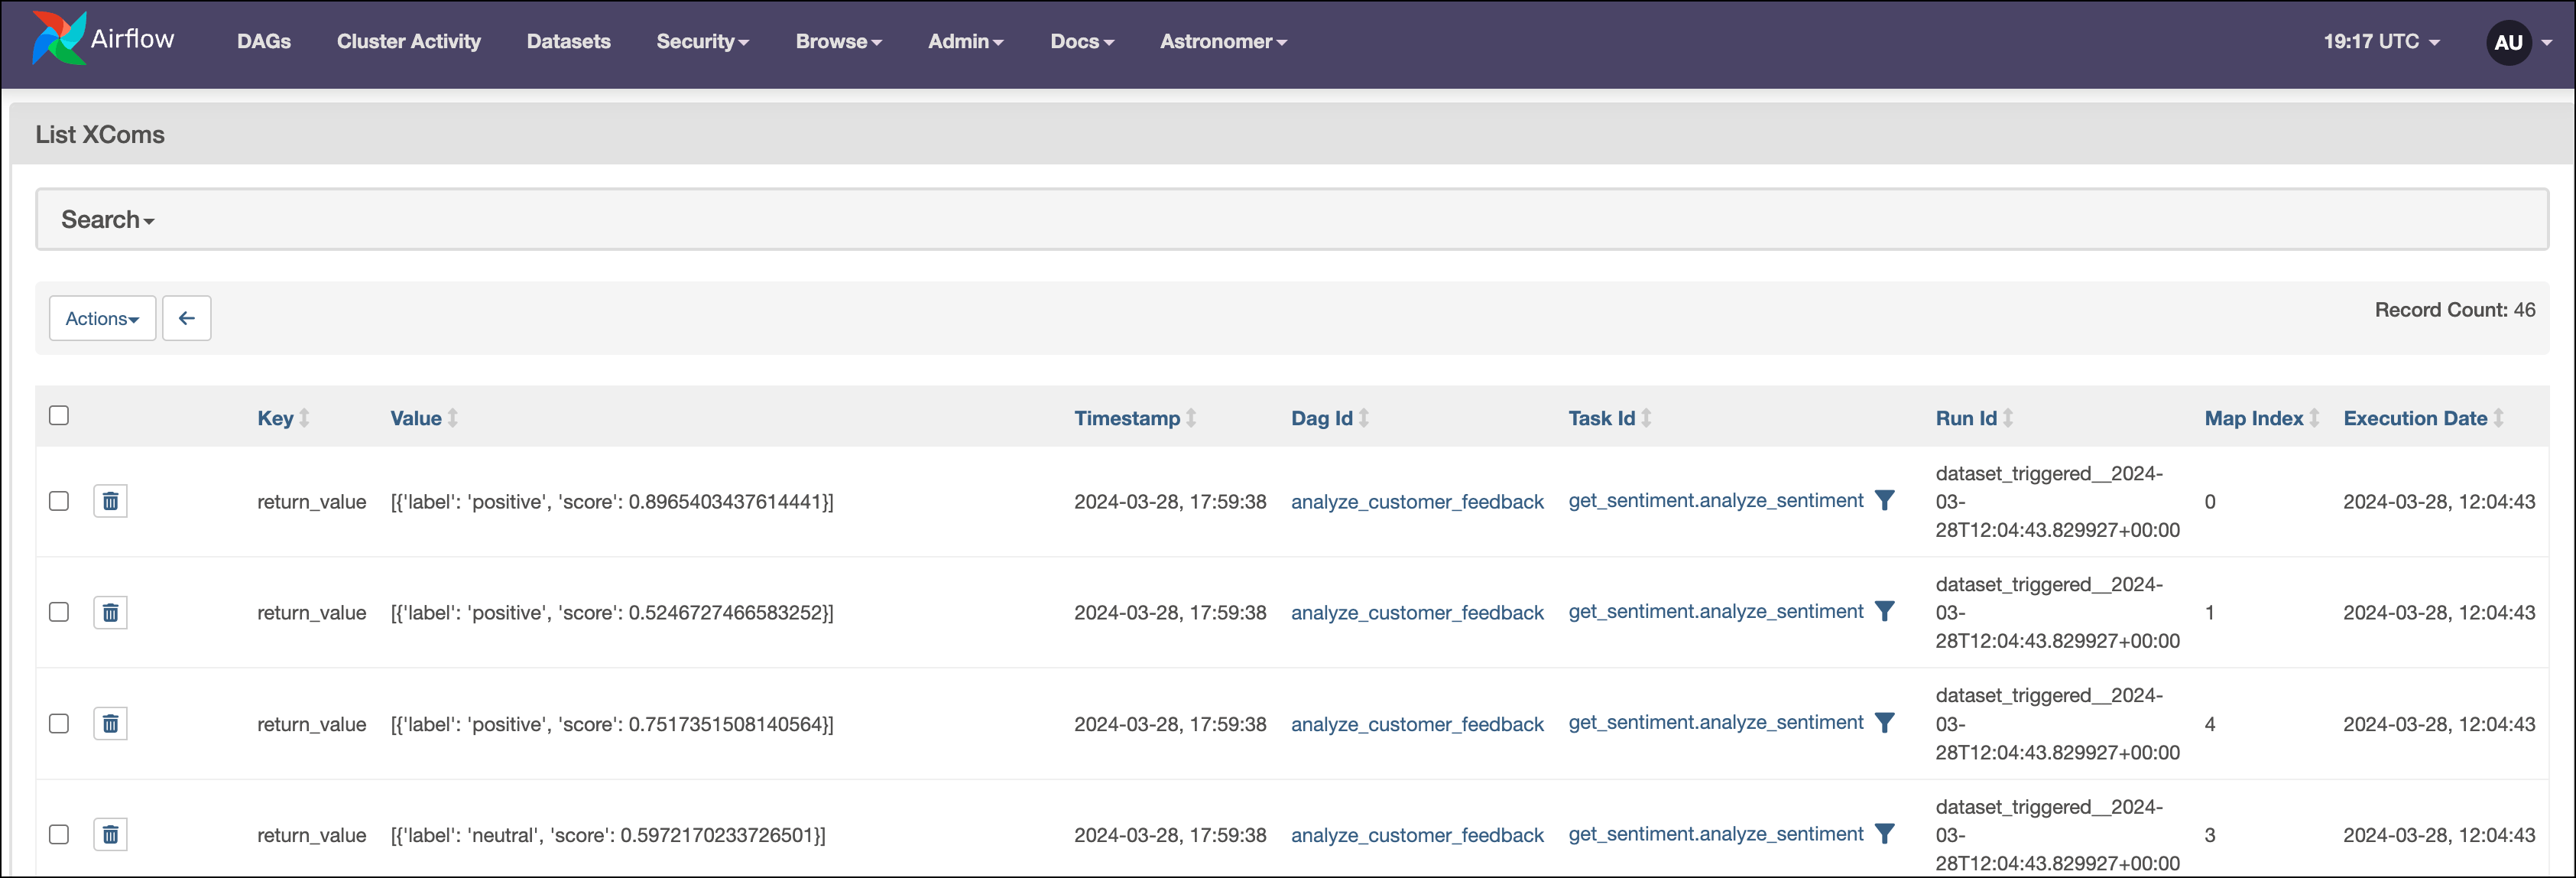
 Similarly, the XComs page shows a list of all XComs stored in the metadata database and allows you to easily delete them.
 Other pages on the **Admin** tab include:
* **Variables:** View and manage [Airflow variables](https://airflow.apache.org/docs/apache-airflow/stable/howto/variable.html).
* **Configurations:** View the contents of your `airflow.cfg` file. Note that this can be disabled by your Airflow admin for security reasons.
* **Plugins:** View any [Airflow plugins](https://airflow.apache.org/docs/apache-airflow/stable/plugins.html) defined in your environment.
* **Providers:** View all [Airflow providers](https://airflow.apache.org/docs/apache-airflow-providers/) included in your Airflow environment with their version number.
* **Pools:** View and manage [Airflow pools](https://airflow.apache.org/docs/apache-airflow/stable/administration-and-deployment/pools.html).
## Docs
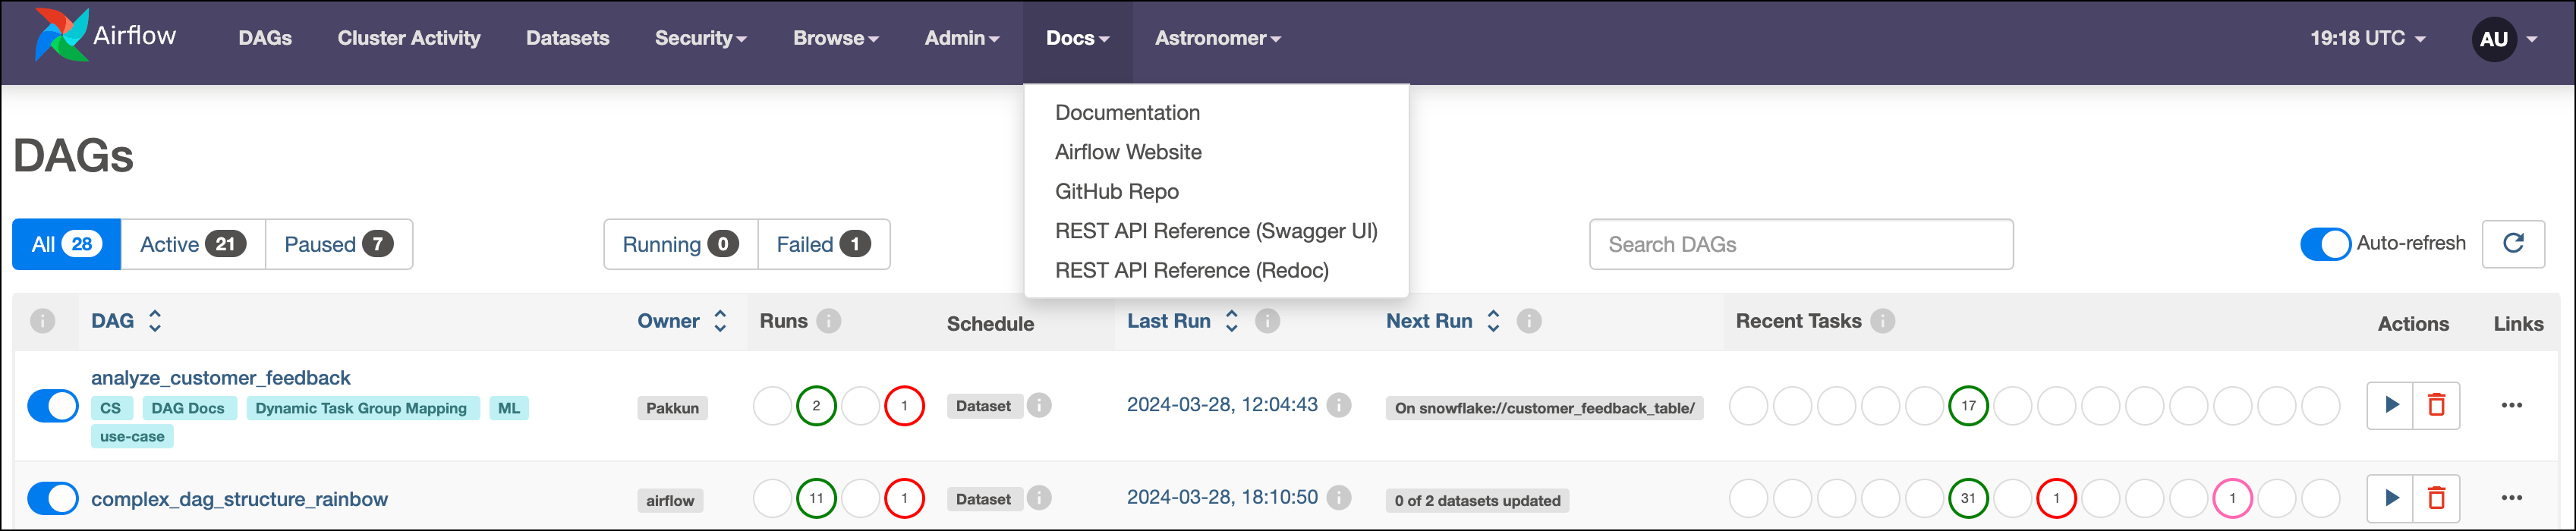
The **Docs** tab provides links to external Airflow resources including:
* [Airflow documentation](https://airflow.apache.org/docs/apache-airflow/stable/)
* [The Airflow website](https://airflow.apache.org/)
* [The Airflow GitHub repository](https://github.com/apache/airflow)
* The REST API Swagger and the Redoc documentation
Other pages on the **Admin** tab include:
* **Variables:** View and manage [Airflow variables](https://airflow.apache.org/docs/apache-airflow/stable/howto/variable.html).
* **Configurations:** View the contents of your `airflow.cfg` file. Note that this can be disabled by your Airflow admin for security reasons.
* **Plugins:** View any [Airflow plugins](https://airflow.apache.org/docs/apache-airflow/stable/plugins.html) defined in your environment.
* **Providers:** View all [Airflow providers](https://airflow.apache.org/docs/apache-airflow-providers/) included in your Airflow environment with their version number.
* **Pools:** View and manage [Airflow pools](https://airflow.apache.org/docs/apache-airflow/stable/administration-and-deployment/pools.html).
## Docs
The **Docs** tab provides links to external Airflow resources including:
* [Airflow documentation](https://airflow.apache.org/docs/apache-airflow/stable/)
* [The Airflow website](https://airflow.apache.org/)
* [The Airflow GitHub repository](https://github.com/apache/airflow)
* The REST API Swagger and the Redoc documentation
 ## Customization options
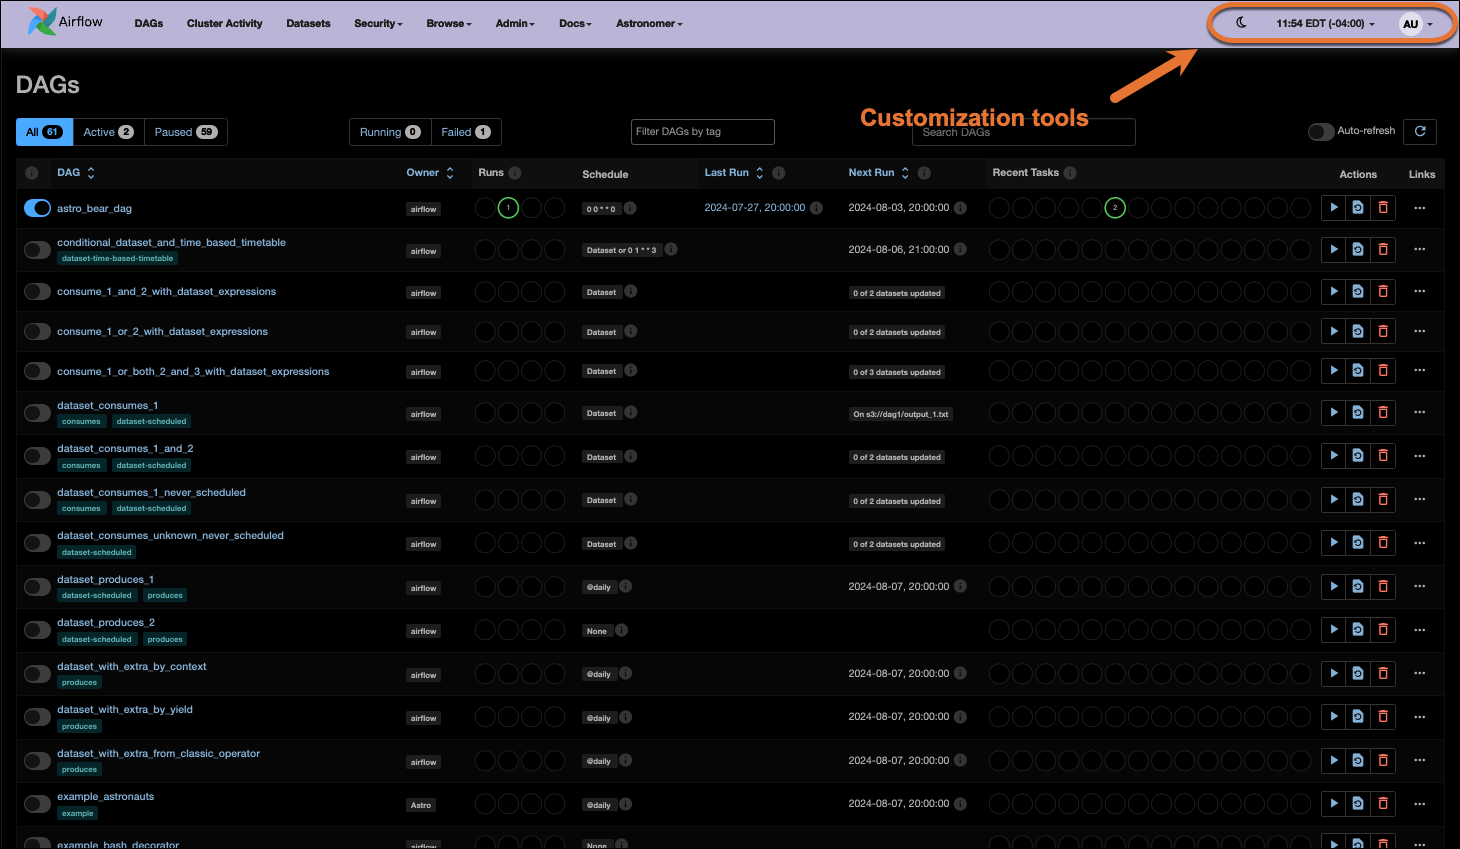
In the upper right-hand corner of the UI, you will find a light/dark theme toggle button, time zone selector with search functionality, and a login dropdown with a link to an editable user profile view.
## Customization options
In the upper right-hand corner of the UI, you will find a light/dark theme toggle button, time zone selector with search functionality, and a login dropdown with a link to an editable user profile view.
 ## Conclusion
This guide provided a basic overview of some of the most commonly used features of the Airflow UI.
The Airflow community is consistently working on improvements to the UI to provide a better user experience and additional functionality. Make sure you upgrade your Airflow environment frequently to ensure you are taking advantage of Airflow UI updates as the community releases them.
## Conclusion
This guide provided a basic overview of some of the most commonly used features of the Airflow UI.
The Airflow community is consistently working on improvements to the UI to provide a better user experience and additional functionality. Make sure you upgrade your Airflow environment frequently to ensure you are taking advantage of Airflow UI updates as the community releases them.