> ## Documentation Index
> Fetch the complete documentation index at: https://astronomer.io/docs/llms.txt
> Use this file to discover all available pages before exploring further.
# Export Astro reporting data
This is feature is only available if you are on the **Enterprise** tier or above. See [Astro Plans and Pricing](https://www.astronomer.io/pricing/).
As an Astro administrator, you can export reporting data to share with other team members or to keep a record of key performance indicators. Astro supports several different methods for exporting reporting data based on how and when you want to receive the data. Specifically, you can export data:
* Manually through the Astro UI.
* On a regular schedule.
* Whenever a certain condition is met, such as a metric reaching a specific threshold. This is known as a *dashboard alert*.
When you export reporting data, Astro exports the last [one million rows of data](https://help.sigmacomputing.com/docs/download-export-and-upload-limitations) from a specific dashboard in the file format of your choice. Use this document to learn about the different ways you can trigger the export process.
Watch the Astro Academy [Reporting](https://academy.astronomer.io/learning-bytes-reporting) Learning Byte video to learn more about how observe your teams' Airflow Deployments.
## Prerequisites
* Only users with **Organization Billing Admin** [user permissions](/docs/astro/user-permissions#organization-roles) can access Organization dashboards.
## Download reporting data
1. To view Organization dashboards, click **Dashboards** in the Astro UI menu. You can also access this page directly at [https://cloud.astronomer.io/dashboards](https://cloud.astronomer.io/dashboards).
2. Click the **Underlying Data** tab. This tab contains the raw data that powers each dashboard chart in a standardized financial format, including the following tables:
* **Deployment Activity**: Deployment task, Dag, operator, and code push metrics aggregated by day, week, or month time periods.
* **Workspace Activity**: Workspace task, Dag, operator, and code push metrics aggregated by day, week, or month time periods.
* **Daily Cost Breakdown**: Costs broken down by day. Includes a second table in the FinOps FOCUS format.
Each table includes filters so you can narrow the data before exporting.
 For the **Daily Cost Breakdown** table, export a larger range of dates and upsert the data, because costs can arrive late.
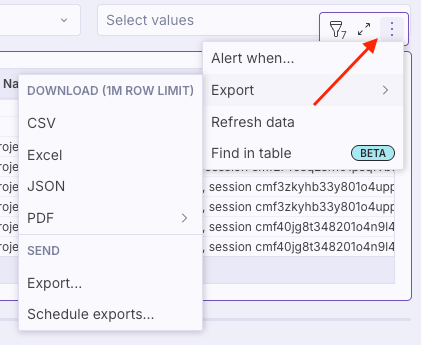
3. Click the three-dot menu on the table that you want to export, then click **Export**. Under **DOWNLOAD**, choose the file format that you want to download your data in. Astro generates your data export and saves it to your local computer.
For the **Daily Cost Breakdown** table, export a larger range of dates and upsert the data, because costs can arrive late.
3. Click the three-dot menu on the table that you want to export, then click **Export**. Under **DOWNLOAD**, choose the file format that you want to download your data in. Astro generates your data export and saves it to your local computer.
 ## Export reporting data
Instead of downloading your data directly, you can email it or send it to an external service through a webhook.
1. To view Organization dashboards, click **Dashboards** in the Astro UI menu. You can also access this page directly at [https://cloud.astronomer.io/dashboards](https://cloud.astronomer.io/dashboards).
2. Click the **Underlying Data** tab, then click the three-dot menu for the table you want to export. Click **Export**, then under **SEND**, click **Export...**.
3. Choose where you want to send the data report.
* **Email** - Enter the recipient's email address and optionally edit the subject line and email body message.
* **Webhook** - ([Sigma feature in beta](https://help.sigmacomputing.com/docs/webhook-exports)) Add the webhook URL where you want to export your data to.
4. In the **Attachments** section, select the report you want to send and file format to include it as. You can choose from the same file types that are available for a one-time data download.
5. (Optional) To send more than one report, click **+ Add**, and then select the report you want to send and its file format.
When you receive a report via email, the sender appears as **Sigma Computing**. The subject line also includes the name of the dashboard element's data you exported.
## Export reporting data
Instead of downloading your data directly, you can email it or send it to an external service through a webhook.
1. To view Organization dashboards, click **Dashboards** in the Astro UI menu. You can also access this page directly at [https://cloud.astronomer.io/dashboards](https://cloud.astronomer.io/dashboards).
2. Click the **Underlying Data** tab, then click the three-dot menu for the table you want to export. Click **Export**, then under **SEND**, click **Export...**.
3. Choose where you want to send the data report.
* **Email** - Enter the recipient's email address and optionally edit the subject line and email body message.
* **Webhook** - ([Sigma feature in beta](https://help.sigmacomputing.com/docs/webhook-exports)) Add the webhook URL where you want to export your data to.
4. In the **Attachments** section, select the report you want to send and file format to include it as. You can choose from the same file types that are available for a one-time data download.
5. (Optional) To send more than one report, click **+ Add**, and then select the report you want to send and its file format.
When you receive a report via email, the sender appears as **Sigma Computing**. The subject line also includes the name of the dashboard element's data you exported.
 ### Schedule a data report
Astronomer recommends scheduling exports from the **Underlying Data** tab instead of from individual charts. The standardized format provides consistent data that replaces previous chart-specific export customizations.
1. To view Organization dashboards, click **Dashboards** in the Astro UI menu. You can also access this page directly at [https://cloud.astronomer.io/dashboards](https://cloud.astronomer.io/dashboards).
2. Click the **Underlying Data** tab, then click the three-dot menu for the table you want to schedule an export for. Click **Export**, then under **SEND**, click **Schedule exports...**.
3. Enter the where you want to send the data report.
* **Email** - Enter the recipient's email address and optionally edit the subject line and email body message.
* **Webhook** - ([Sigma feature in beta](https://help.sigmacomputing.com/docs/webhook-exports)) Add the webhook URL where you want to export your data to.
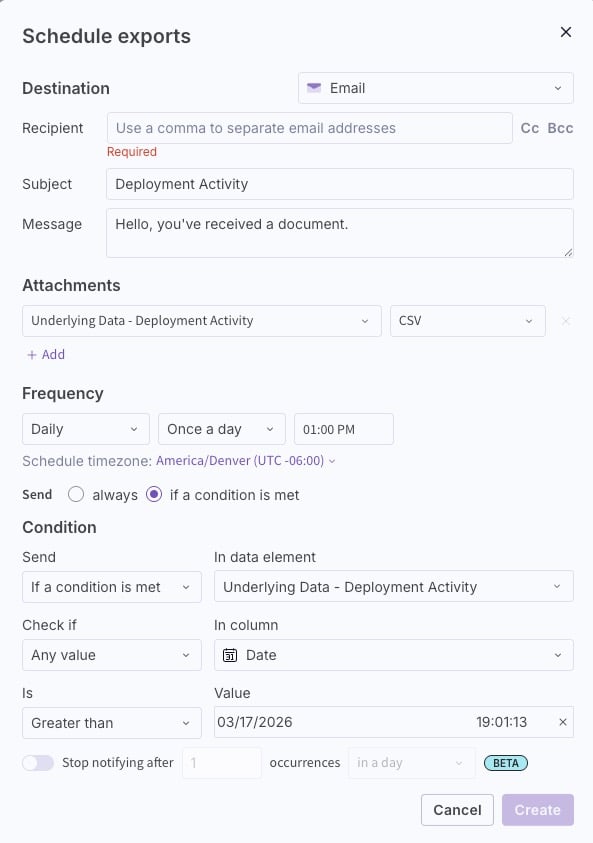
If you toggle **Condition** when setting up your schedule, it allows you to configure a conditional data export, or *dashboard alert*. Instead of sending a report at a specific time interval, it sends a data report when your data meets criteria that you define.
## Create a dashboard alert
A dashboard alert contains a message and a data export that Astro sends when specific criteria are met in one of your reporting metrics. Use dashboard alerts to quickly receive messages and data when your metrics reach a specific threshold, such as when task failures exceed a certain amount.
1. To view Organization dashboards, click **Dashboards** in the Astro UI menu. You can also access this page directly at [https://cloud.astronomer.io/dashboards](https://cloud.astronomer.io/dashboards).
2. Click the three-dot menu for the reporting element you want to set up an alert for. Click **Alert when...**.
3. Configure the export destination and attachments, then in the **Frequency** section, select **if a condition is met**. In the **Condition** section that appears, define when you want the dashboard to send the data report.
### Schedule a data report
Astronomer recommends scheduling exports from the **Underlying Data** tab instead of from individual charts. The standardized format provides consistent data that replaces previous chart-specific export customizations.
1. To view Organization dashboards, click **Dashboards** in the Astro UI menu. You can also access this page directly at [https://cloud.astronomer.io/dashboards](https://cloud.astronomer.io/dashboards).
2. Click the **Underlying Data** tab, then click the three-dot menu for the table you want to schedule an export for. Click **Export**, then under **SEND**, click **Schedule exports...**.
3. Enter the where you want to send the data report.
* **Email** - Enter the recipient's email address and optionally edit the subject line and email body message.
* **Webhook** - ([Sigma feature in beta](https://help.sigmacomputing.com/docs/webhook-exports)) Add the webhook URL where you want to export your data to.
If you toggle **Condition** when setting up your schedule, it allows you to configure a conditional data export, or *dashboard alert*. Instead of sending a report at a specific time interval, it sends a data report when your data meets criteria that you define.
## Create a dashboard alert
A dashboard alert contains a message and a data export that Astro sends when specific criteria are met in one of your reporting metrics. Use dashboard alerts to quickly receive messages and data when your metrics reach a specific threshold, such as when task failures exceed a certain amount.
1. To view Organization dashboards, click **Dashboards** in the Astro UI menu. You can also access this page directly at [https://cloud.astronomer.io/dashboards](https://cloud.astronomer.io/dashboards).
2. Click the three-dot menu for the reporting element you want to set up an alert for. Click **Alert when...**.
3. Configure the export destination and attachments, then in the **Frequency** section, select **if a condition is met**. In the **Condition** section that appears, define when you want the dashboard to send the data report.
 When you receive a dashboard alert in an email, the sender appears as **Sigma Computing**. The subject line also includes the name of the dashboard element's data you exported.