> ## Documentation Index
> Fetch the complete documentation index at: https://astronomer.io/docs/llms.txt
> Use this file to discover all available pages before exploring further.
# Best practices for rightsizing Airflow resources on Astro
Astro gives you options to customize your Deployment settings, enabling you to choose the right amount of resources for your processing needs. This means you can customize the size of your Airflow components so that your processes can sufficiently scale for heavier workloads, without you needing to reserve resources that you don't need.
This guide shares an example process for how to use Deployment Metrics in Astro to analyze your Deployment's performance and determine whether or not to adjust your allocated resources. The process covers the following steps:
* Define thresholds for the minimum and maximum resource use that you feel are an optimal performance range.
* Examine your historical Dag and Deployment performance data to see if your Deployment operates within your optimal performance range.
* Determine any required changes to your resource allocations for your workers and scheduler.
* Make those adjustments in your Deployment settings.
You can periodically repeat this process to make sure that your Airflow resources are optimized for your workloads as your needs change.
If you want to analyze your Deployment metrics in greater detail, you can use the [Universal Metrics Exporter](/docs/astro/export-metrics) to configure a metrics export at the Deployment or Workspace level.
## Feature overview
* Use [Deployment metrics](/docs/astro/deployment-metrics) to estimate the right size of your Airflow resource.
* Adjust your [Deployment resource sizes](/docs/astro/deployment-resources) to meet your needs.
## Prerequisites
This guide assumes that you have:
* At least one [Astro Deployment](/docs/astro/create-deployment).
* At least one active [Astro project](/docs/cli/v1.43/develop-project), because you need your Dag performance data.
* Workspace Owner, Workspace Operator, or Deployment Admin [user permissions](/docs/astro/user-permissions).
* Familiarity with the different Airflow Executors available on Astro, the [Astro Executor, Celery Executor and Kubernetes Executor](/docs/astro/executors-overview).
## Step 1: Determine performance thresholds
Define two performance thresholds:
* **Maximum threshold** Choose a capacity percentage, between 0% and 100%, that you want to consider the upper limit for ideal performance, but still leaves some additional capacity for pipeline growth. This example uses 75% for the maximum threshold.
* **Minimum threshold** Choose a capacity percentage, between 0% and 100%, that you want to consider the lower limit for ideal performance, where you don't think that unconsumed resources are wasted. This example uses 50% for the minimum threshold.
## Step 2: Retrieve your Deployment metrics
In the Astro UI, open the Deployments page and choose the Deployment you want to rightsize. Navigate to the **Analytics** tab and choose **Last 7 days** for the timeframe.
## Step 3: Adjust your scheduler resource settings
For Astro Hosted Deployments that are **Medium**, **Large**, or **Extra Large**, your scheduler has a separate Dag processor component, which appears as a separate line in each line graph of your Deployment metrics. In these Deployments, scheduler and Dag processor resources should be considered separately. For Small deployments, which combine the scheduler and Dag processor, use the following **Scheduler Resources** steps to right-size your Deployment size.
### Scheduler Resources
The Deployment metrics show the CPU and Memory use per Pod as percentages, which you can compare to the **Minimum Threshold** and **Maximum Threshold** that you defined in Step 1. For scheduler resources, follow the same process:
* If CPU or Memory is between the **Minimum Threshold** and the **Maximum Threshold**, no changes are needed.
* If CPU or Memory is greater than the **Maximum Threshold**, then increase those resources.
* If CPU or Memory is less than the **Minimum Threshold**, then decrease those resources.
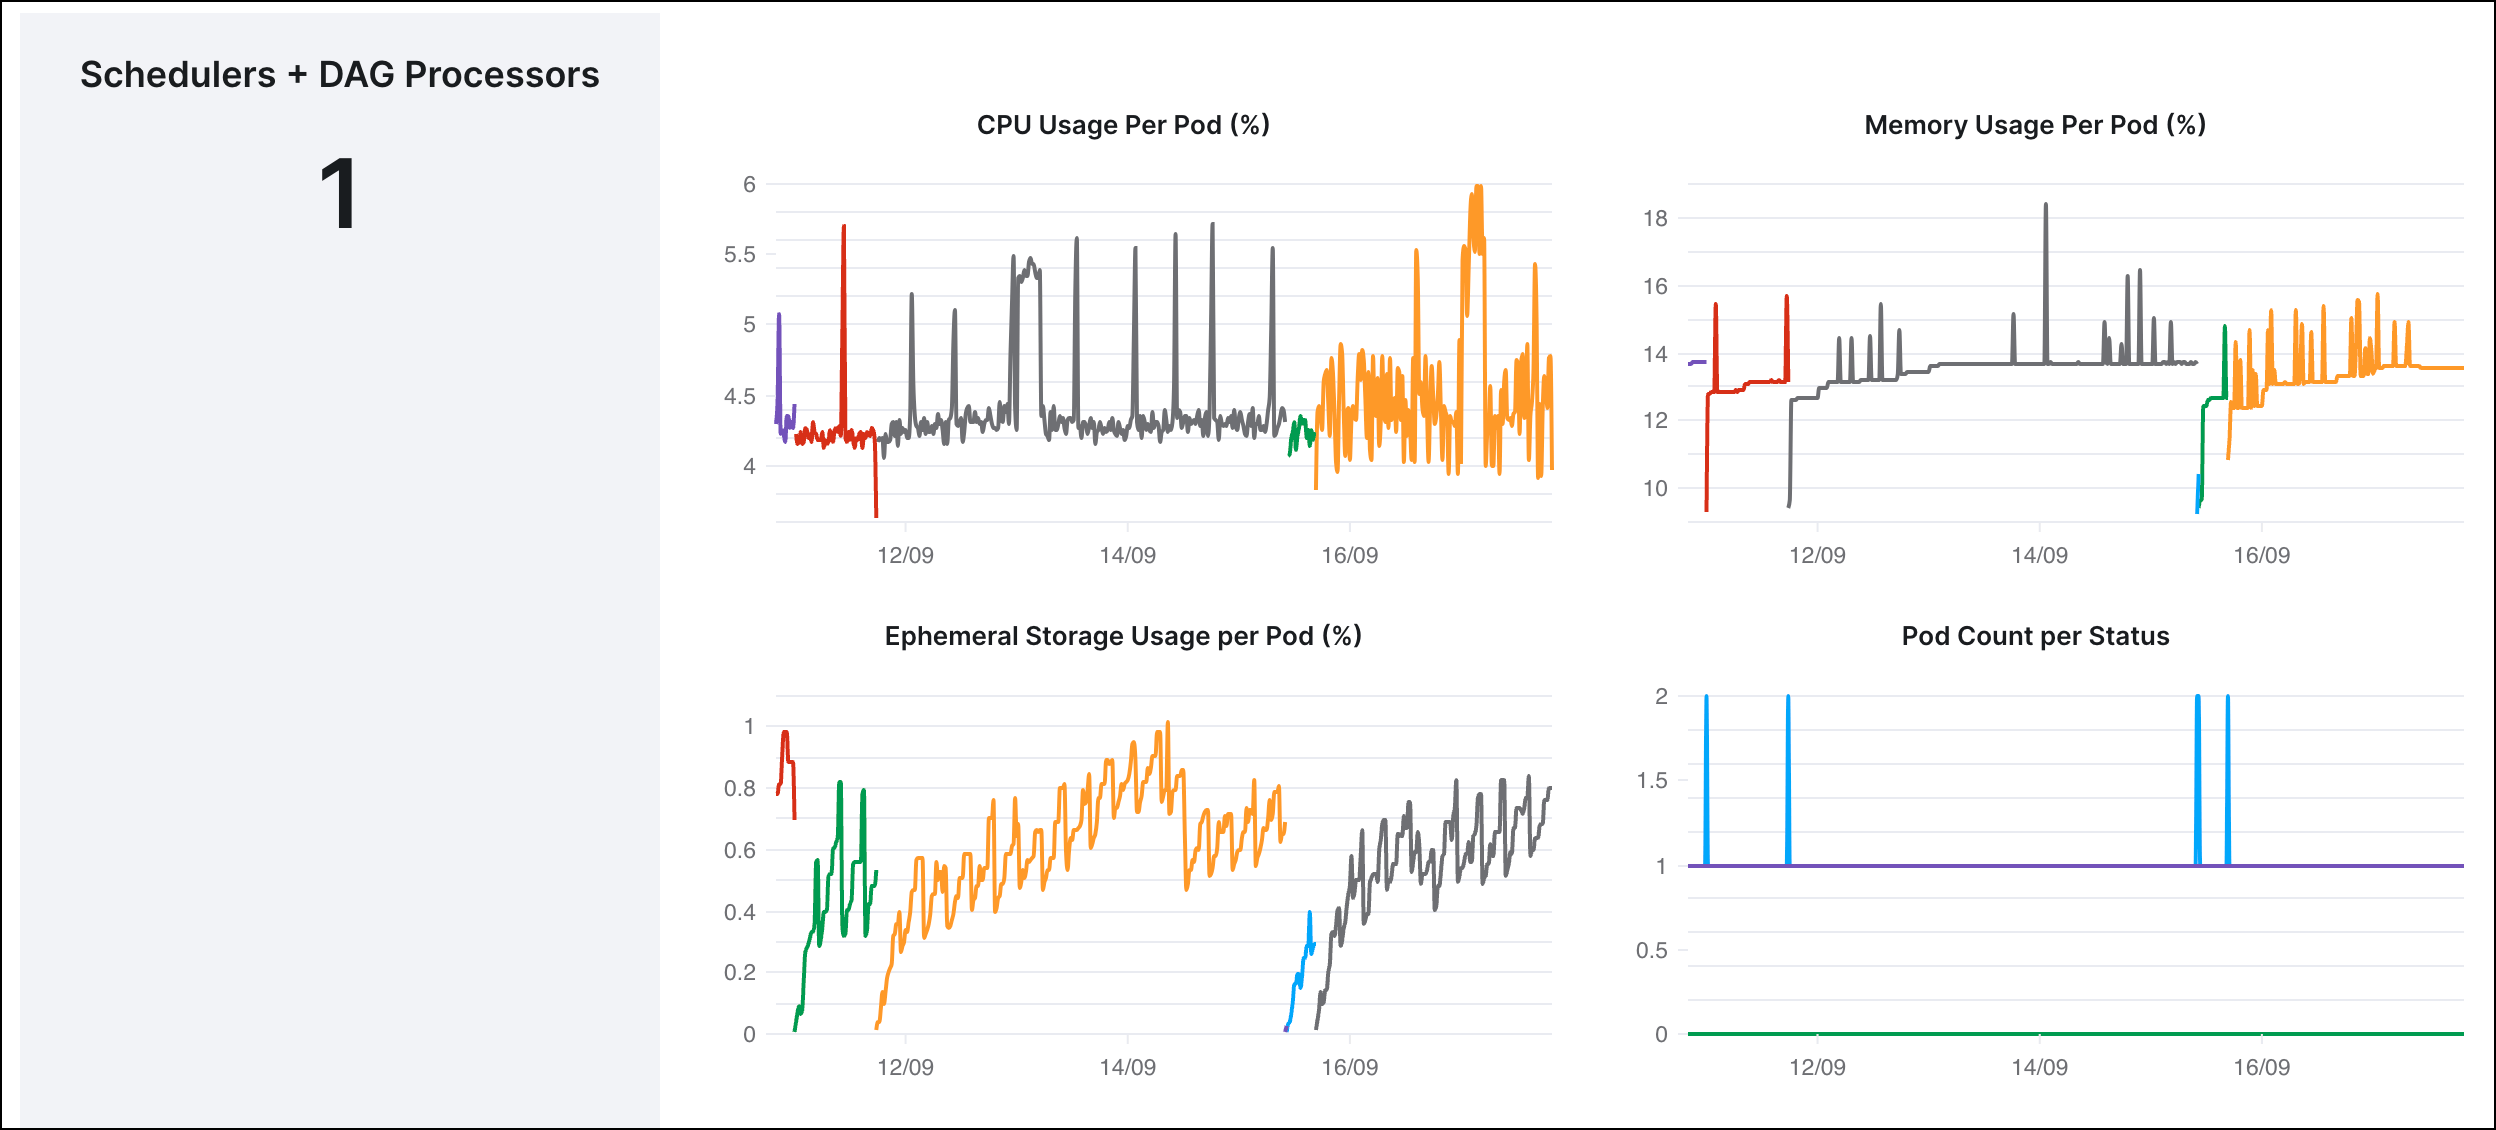
In the following example, you can see the resource metrics for a small scheduler and Dag processor, where both run in one single process and the metrics show a single line graph. If you had a minimum threshold set for `50%` and maximum for `75%`, the following example that shows around 5% CPU use and 14% for Memory use indicates that you can allocate more processes to this Deployment, or decrease the memory and CPU for its scheduler.
 ### Dag processor Resources and Performance
For **Medium**, **Large**, and **Extra Large** Deployments only
For **Medium**, **Large**, and **Extra Large** Deployments, the Dag processor can run close to, or at, maximum vCPU utilization without competing for resources with the scheduler, since the two components run separately. A Dag processor running at 100% vCPU utilization results in slower Dag file processing times without causing scheduler unavailability. For these Deployment sizes, high Dag processor vCPU utilization is a good sign because this means your Dag processor is running near full capacity and is processing Dags efficiently.
You can rightsize Dag processor memory following the same process as other resources:
* If CPU or Memory is between the **Minimum Threshold** and the **Maximum Threshold**, no changes are needed.
* If CPU or Memory is greater than the **Maximum Threshold**, then increase those resources.
* If CPU or Memory is less than the **Minimum Threshold**, then decrease those resources.
To rightsize Dag processor vCPU, consider your current Dag file processing speed. In large deployments, **Large** and **Extra Large** size, the limitation for Dag file processing time tends to be the number of parsing processes, which can be adjusted through an [Airflow environment variable](https://airflow.apache.org/docs/apache-airflow/stable/configurations-ref.html#parsing-processes), `parsing_processes`. You can create and store an Airflow environment variable directly in the [Astro UI](/docs/astro/create-and-link-variables).
If Dag file processing is slow and you want to increase performance, use the following steps:
* If Dag processor vCPU utilization is low (\< 50%), increase Dag processor vCPU utilization by increasing the number of parsing processes. You should see Dag processor vCPU utilization increase.
* If Dag processor vCPU utilization is high (> 80%), or the number of parsing processes is higher than 12 parsing processes, increase Deployment size.
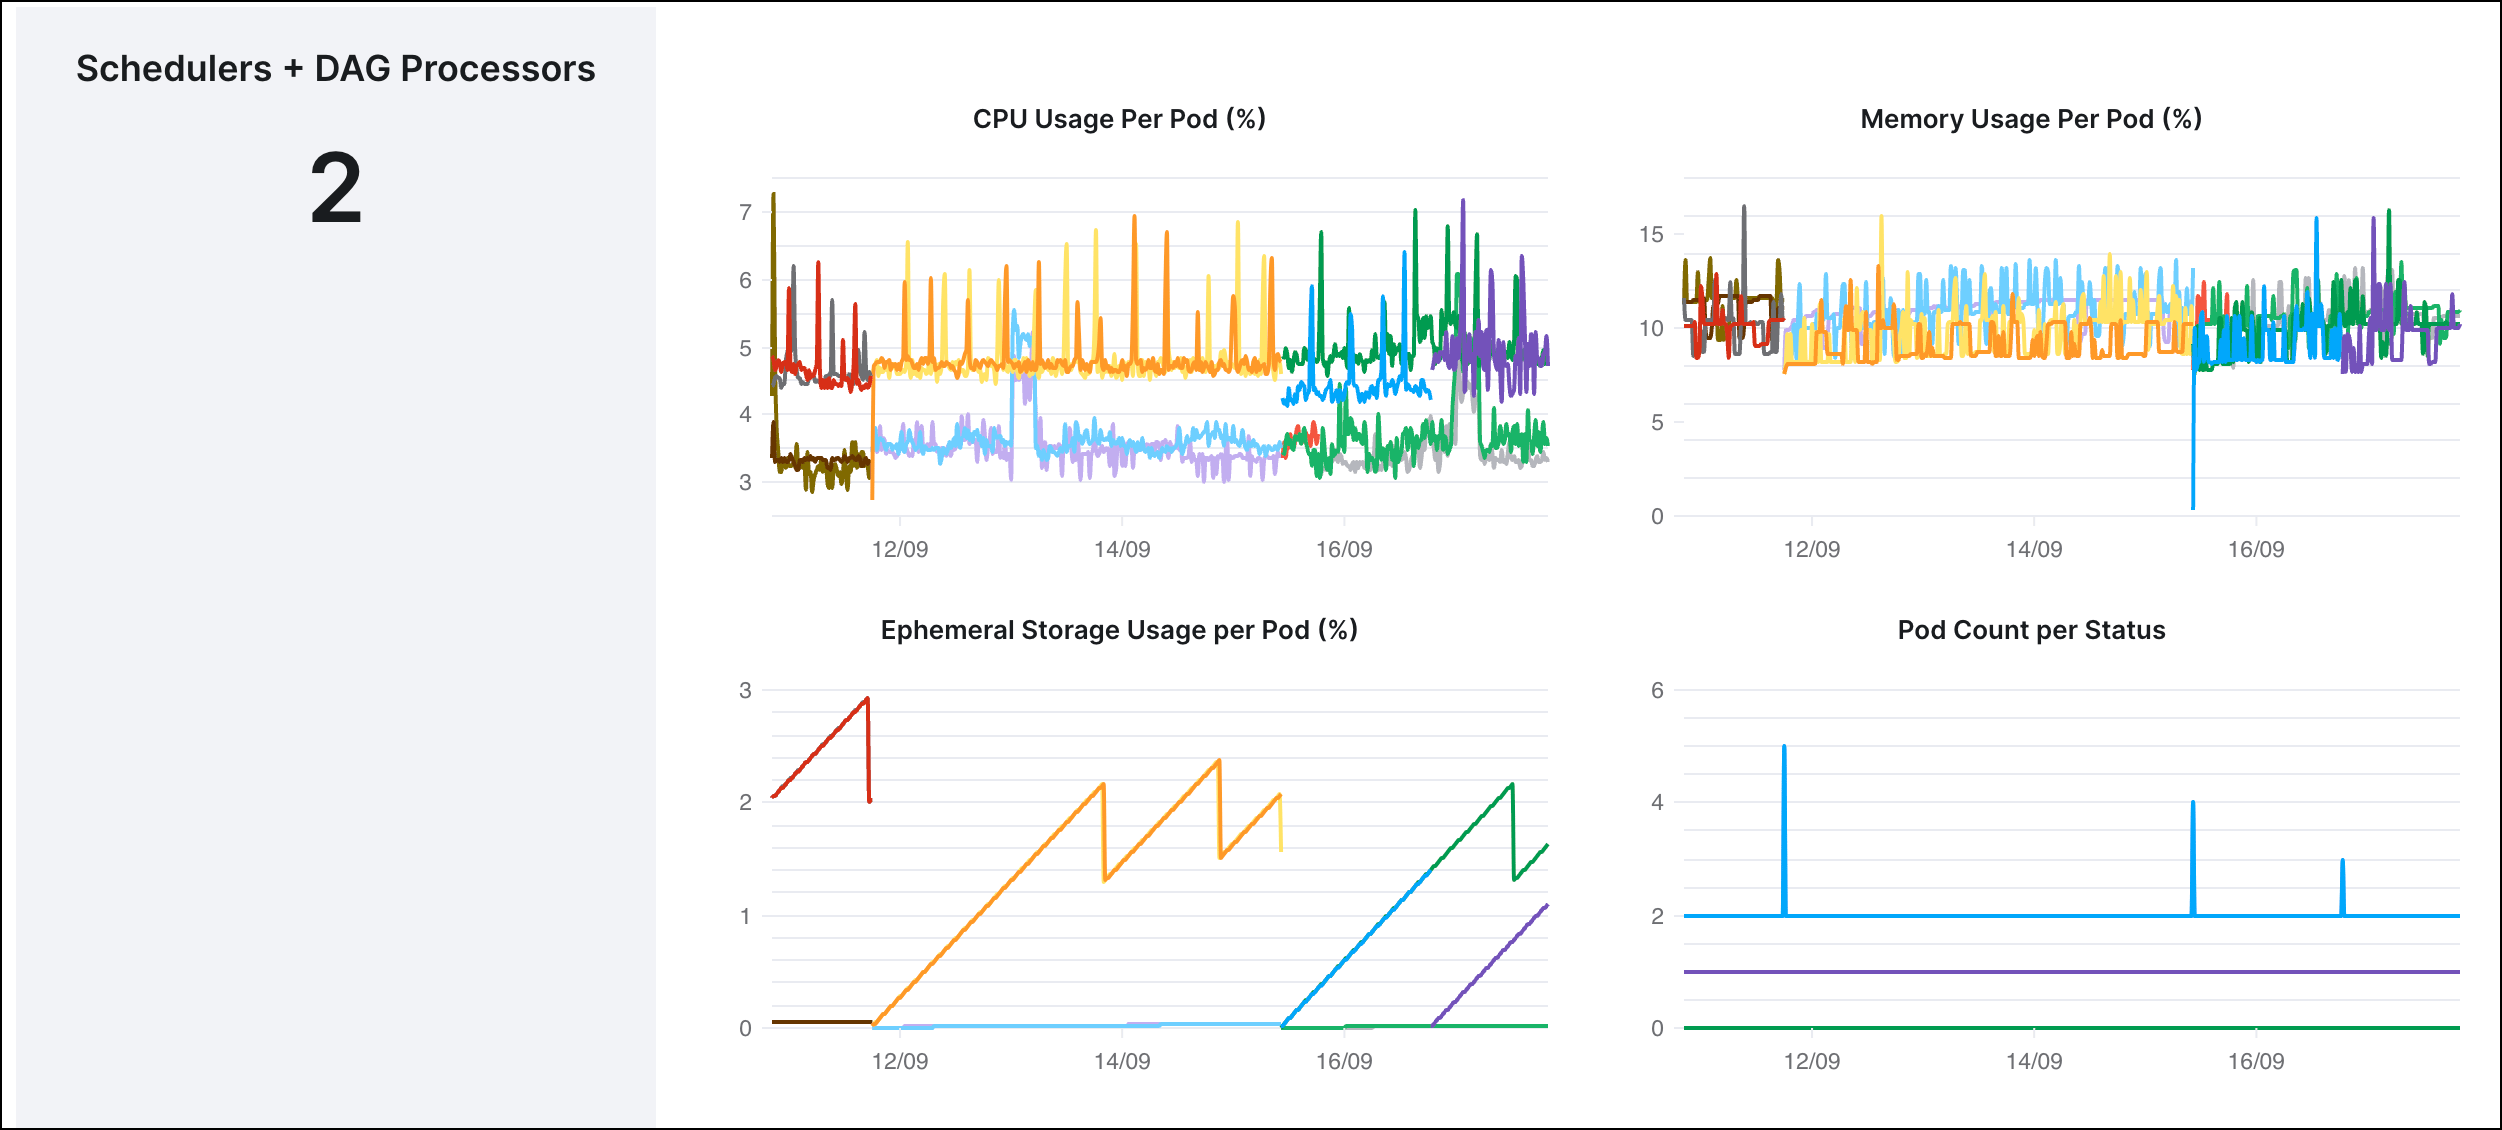
In the following example, you can see the resource metrics for a Medium size scheduler that includes a Dag processor. If you had a minimum threshold set for `50%` and maximum for `75%`, the following example that shows consistent 4-8% for the Dag processor vCPU, consistent 2-6% use for scheduler CPU use, and 7-15% memory use by both the scheduler and Dag processor indicates that you can allocate more processes to this Deployment, or scale down the size of the size of the resources.
### Dag processor Resources and Performance
For **Medium**, **Large**, and **Extra Large** Deployments only
For **Medium**, **Large**, and **Extra Large** Deployments, the Dag processor can run close to, or at, maximum vCPU utilization without competing for resources with the scheduler, since the two components run separately. A Dag processor running at 100% vCPU utilization results in slower Dag file processing times without causing scheduler unavailability. For these Deployment sizes, high Dag processor vCPU utilization is a good sign because this means your Dag processor is running near full capacity and is processing Dags efficiently.
You can rightsize Dag processor memory following the same process as other resources:
* If CPU or Memory is between the **Minimum Threshold** and the **Maximum Threshold**, no changes are needed.
* If CPU or Memory is greater than the **Maximum Threshold**, then increase those resources.
* If CPU or Memory is less than the **Minimum Threshold**, then decrease those resources.
To rightsize Dag processor vCPU, consider your current Dag file processing speed. In large deployments, **Large** and **Extra Large** size, the limitation for Dag file processing time tends to be the number of parsing processes, which can be adjusted through an [Airflow environment variable](https://airflow.apache.org/docs/apache-airflow/stable/configurations-ref.html#parsing-processes), `parsing_processes`. You can create and store an Airflow environment variable directly in the [Astro UI](/docs/astro/create-and-link-variables).
If Dag file processing is slow and you want to increase performance, use the following steps:
* If Dag processor vCPU utilization is low (\< 50%), increase Dag processor vCPU utilization by increasing the number of parsing processes. You should see Dag processor vCPU utilization increase.
* If Dag processor vCPU utilization is high (> 80%), or the number of parsing processes is higher than 12 parsing processes, increase Deployment size.
In the following example, you can see the resource metrics for a Medium size scheduler that includes a Dag processor. If you had a minimum threshold set for `50%` and maximum for `75%`, the following example that shows consistent 4-8% for the Dag processor vCPU, consistent 2-6% use for scheduler CPU use, and 7-15% memory use by both the scheduler and Dag processor indicates that you can allocate more processes to this Deployment, or scale down the size of the size of the resources.
 Learn more about adjusting `parsing_processes` and how to see the number of default parsing processes across each Deployment size in [Scaling Airflow](/docs/learn/airflow-scaling-workers#scheduler-settings).
See [Scheduler resources](/docs/astro/deployment-resources#size-options) for more details about configuring your scheduler.
## Step 4: Adjust your executor resource settings
Go to the **Workers** section of your Deployment analytics to view the **CPU** and **Memory** use for your workers. This shows the CPU and Memory use per worker Pod as percentages, which you can compare to the **Minimum threshold** and **Maximum threshold** you defined in Step 1.
Enable **Dynamic Y-Axis scaling** to autoscale the graphs to best fit the data reported for each metric.
* If CPU or Memory is between the **Minimum Threshold** and the **Maximum Threshold**, no changes are needed.
* If CPU or Memory is greater than the **Maximum Threshold**, then increase those resources.
* If CPU or Memory is less than the **Minimum Threshold**, then decrease those resources.
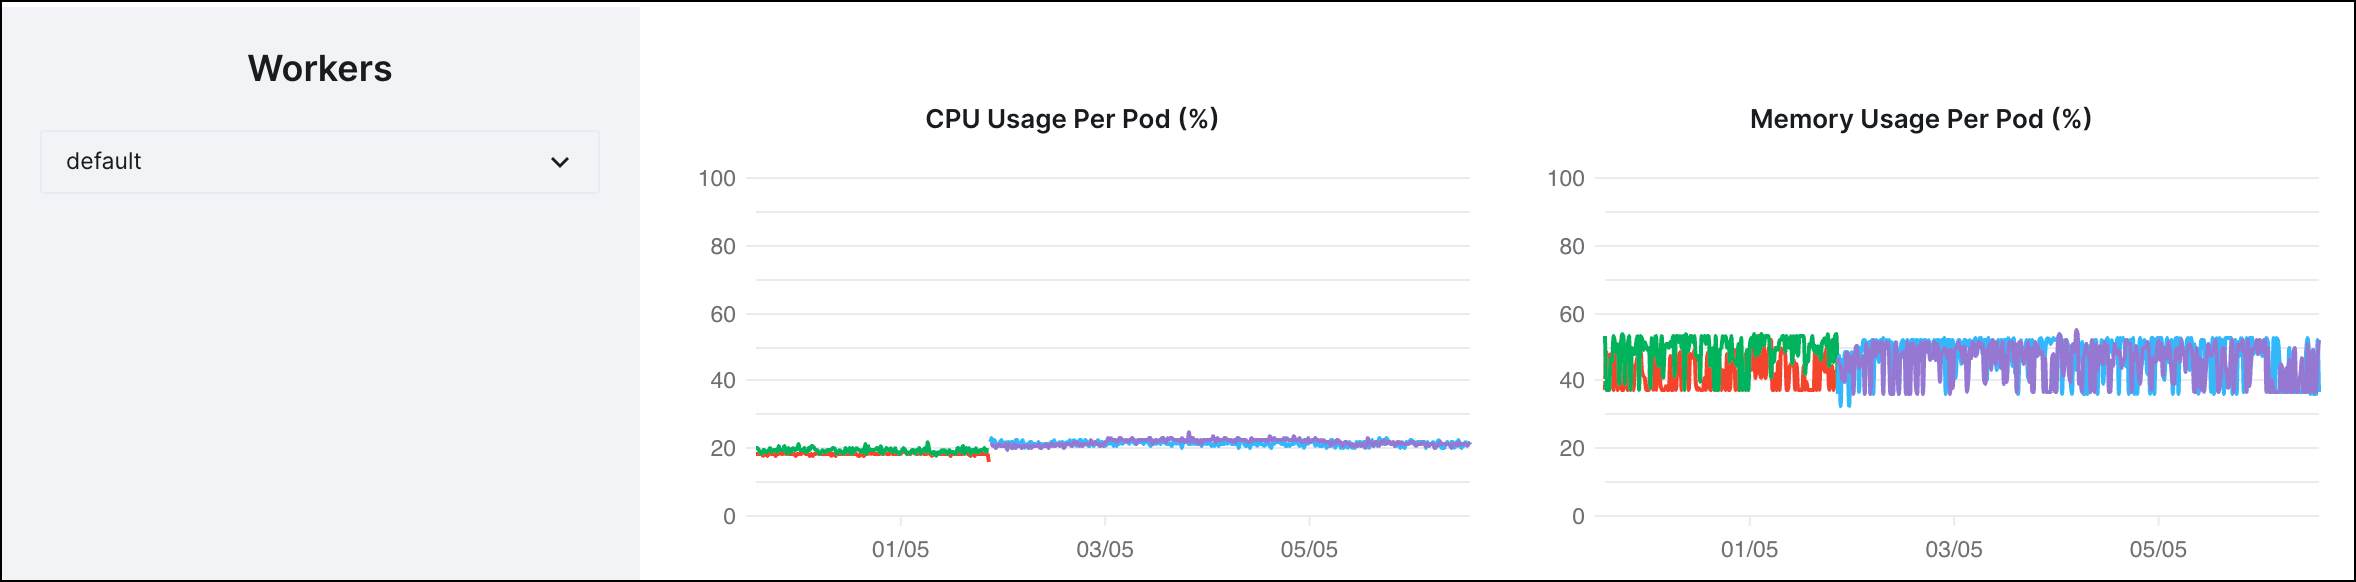
Using the following example, with the thresholds defined as `50%` for the minimum and `75%` for the maximum, you would reduce the available CPU for your workers because CPU use over time remained around 25% to 30%. Because the metrics show resource use to remain approximately 50%, which is within the optimal performance range but consistently on the lower end of the scale, you could choose to reduce the resources you use. Depending on whether you use the CeleryExecutor or Kubernetes executor, you adjust your resources in different ways.
Learn more about adjusting `parsing_processes` and how to see the number of default parsing processes across each Deployment size in [Scaling Airflow](/docs/learn/airflow-scaling-workers#scheduler-settings).
See [Scheduler resources](/docs/astro/deployment-resources#size-options) for more details about configuring your scheduler.
## Step 4: Adjust your executor resource settings
Go to the **Workers** section of your Deployment analytics to view the **CPU** and **Memory** use for your workers. This shows the CPU and Memory use per worker Pod as percentages, which you can compare to the **Minimum threshold** and **Maximum threshold** you defined in Step 1.
Enable **Dynamic Y-Axis scaling** to autoscale the graphs to best fit the data reported for each metric.
* If CPU or Memory is between the **Minimum Threshold** and the **Maximum Threshold**, no changes are needed.
* If CPU or Memory is greater than the **Maximum Threshold**, then increase those resources.
* If CPU or Memory is less than the **Minimum Threshold**, then decrease those resources.
Using the following example, with the thresholds defined as `50%` for the minimum and `75%` for the maximum, you would reduce the available CPU for your workers because CPU use over time remained around 25% to 30%. Because the metrics show resource use to remain approximately 50%, which is within the optimal performance range but consistently on the lower end of the scale, you could choose to reduce the resources you use. Depending on whether you use the CeleryExecutor or Kubernetes executor, you adjust your resources in different ways.
 #### Changing Celery Executor resources
If you use the Celery Executor, you cannot directly configure the CPU or memory available to your workers. Instead, you can configure the worker types, such as `A5` or `A10`, which have a fixed amount of CPU and memory. See more information about [Configuring worker queues](/docs/astro/configure-worker-queues) to select a different resource size.
#### Configuring Kubernetes executor resources
If you use the Kubernetes Executor or `KubernetesPodOperator`, you can edit the CPU and memory available to each pod. For more information, see:
* [Configuring a KubernetesExecutor-deployment default pod resources](/docs/astro/deployment-resources#configure-kubernetes-pod-resources)
* [Configuring per-task resources worker pod resources](/docs/astro/kubernetes-executor#example-set-cpu-or-memory-limits-and-requests)
* [Configuring `KubernetesPodOperator` pod resources](/docs/astro/kpo-task-level-resources)
To determine optimal resources for each KubernetesExecutor/`KubernetesPodOperator` pod, start with low resources, and increase resources gradually if you find the task is running slow or is terminated by Kubernetes due to insufficient resources.
For example, start with 1 GiB memory and gradually increase the memory allotment until the task runs successfully. You can avoid wasting excess resources by following the best practice of gradually increasing your resource settings, instead of assigning the maximum option available.
## Step 5: (Optional - Celery only) Examine Pod count
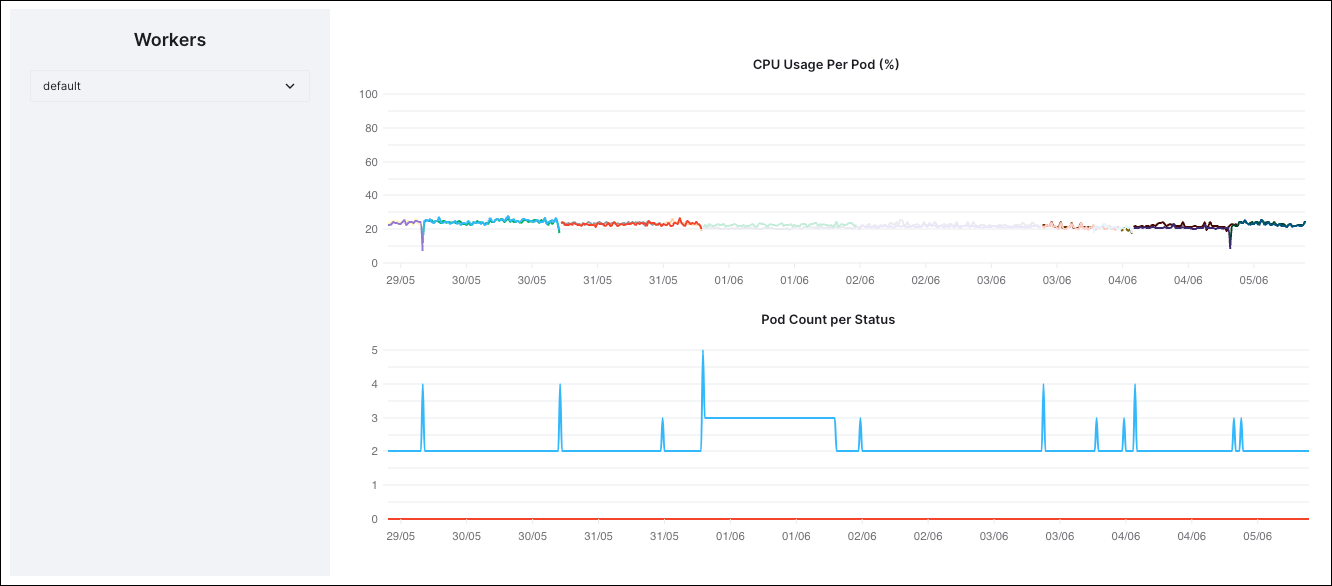
If you have minimum and maximum Celery pod counts configured for your Deployment, you can compare the **Pod count per status** to your **CPU use**. This diagram shows you how many pods your Deployment uses.
The following example shows the Pods used by a Deployment that can autoscale to a maximum of ten worker Pods, and a minimum of zero Pods. Because the maximum number of Pods used is only five Pods, you can see that there are an additional five Pods available, if needed.
#### Changing Celery Executor resources
If you use the Celery Executor, you cannot directly configure the CPU or memory available to your workers. Instead, you can configure the worker types, such as `A5` or `A10`, which have a fixed amount of CPU and memory. See more information about [Configuring worker queues](/docs/astro/configure-worker-queues) to select a different resource size.
#### Configuring Kubernetes executor resources
If you use the Kubernetes Executor or `KubernetesPodOperator`, you can edit the CPU and memory available to each pod. For more information, see:
* [Configuring a KubernetesExecutor-deployment default pod resources](/docs/astro/deployment-resources#configure-kubernetes-pod-resources)
* [Configuring per-task resources worker pod resources](/docs/astro/kubernetes-executor#example-set-cpu-or-memory-limits-and-requests)
* [Configuring `KubernetesPodOperator` pod resources](/docs/astro/kpo-task-level-resources)
To determine optimal resources for each KubernetesExecutor/`KubernetesPodOperator` pod, start with low resources, and increase resources gradually if you find the task is running slow or is terminated by Kubernetes due to insufficient resources.
For example, start with 1 GiB memory and gradually increase the memory allotment until the task runs successfully. You can avoid wasting excess resources by following the best practice of gradually increasing your resource settings, instead of assigning the maximum option available.
## Step 5: (Optional - Celery only) Examine Pod count
If you have minimum and maximum Celery pod counts configured for your Deployment, you can compare the **Pod count per status** to your **CPU use**. This diagram shows you how many pods your Deployment uses.
The following example shows the Pods used by a Deployment that can autoscale to a maximum of ten worker Pods, and a minimum of zero Pods. Because the maximum number of Pods used is only five Pods, you can see that there are an additional five Pods available, if needed.