> ## Documentation Index
> Fetch the complete documentation index at: https://astronomer.io/docs/llms.txt
> Use this file to discover all available pages before exploring further.
# Kibana logging on Astronomer Software
All Airflow logs from your Astronomer logs will flow to Elasticsearch and can be visualized on Kibana. Like Grafana, this view is only available to system admins.
## Setup
1. Open a browser and go to `kibana.BASEDOMAIN`.
2. Click **Menu** in the upper left, click **Stack Management**, and then click **Index Patterns**.
3. In the **Name** field enter `fluentd.*` and then click **Create index pattern**.
Elasticsearch uses [index patterns](https://www.elastic.co/guide/en/kibana/current/index-patterns.html) to organize how you explore data. Setting `fluentd.*` as the index means that Kibana will display all logs from all deployments (Astronomer uses `fluentd` to ship logs from pods to ElasticSearch).
4. Enter `@timestamp` as the `Time Filter`.
## Discover
After the index pattern is confirmed, the `Discover` tab displays logs as they become available.
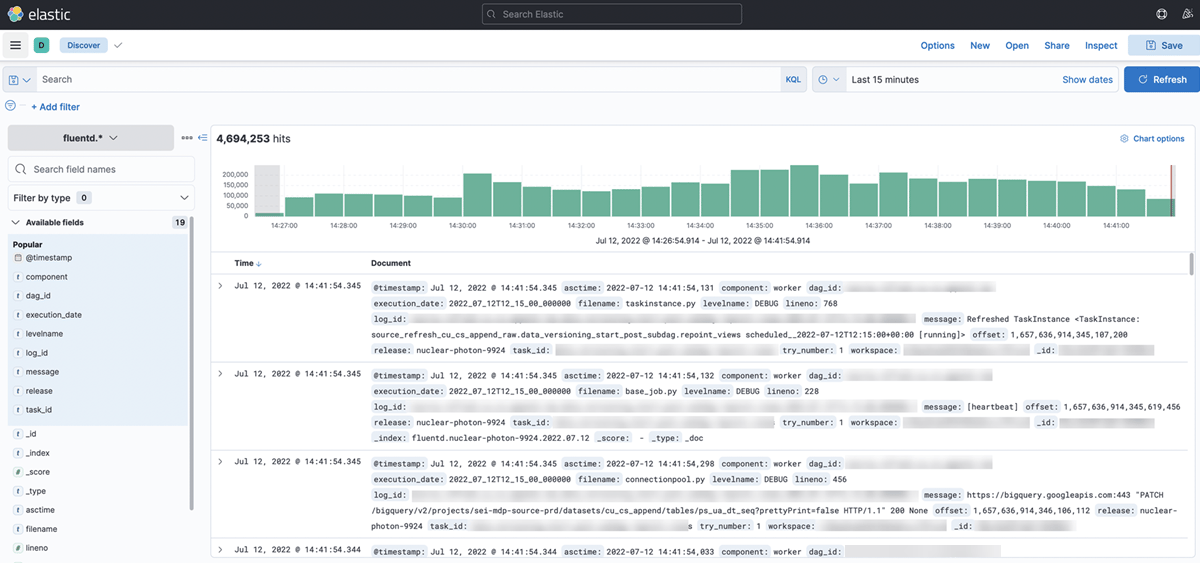 From this view, you can add filters to see logs as they come in from all Airflow deployments. You can also add field filters.
## Dashboards
Custom dashboards can be created in the `Dashboard` view.
From this view, you can add filters to see logs as they come in from all Airflow deployments. You can also add field filters.
## Dashboards
Custom dashboards can be created in the `Dashboard` view.